









This past weekend marked the 55th anniversary of the United States and the Gold Standard parting ways. We have had 55 years of the Great Fiat Experiment. In that time frame we have seen the price of Gold increase 125x and the general price level of goods and services follow suit to a lesser degree. From that moment forward, the dollar was no longer constrained by a promise to exchange it for a fixed quantity of gold. The new fiat system gave politicians and policymakers far greater power to expand money and credit, but it also removed an important monetary restraint. The decades that followed brought rising asset values, but also substantial inflation, expanding government debt, repeated credit booms and busts, and a dramatic decline in the dollar’s purchasing power. Gold and the dollar did not merely go their separate ways. We entered a world in which the measuring stick itself could change.
The end result is that traders and investors now operate in a world where making money and preserving purchasing power are no longer the same thing. Stocks, bonds, real estate, and commodities are priced in a currency whose value changes over time, while interest rates, debt, liquidity and central-bank policy can dramatically alter what those prices mean. A portfolio can rise in dollars while its real purchasing power stagnates or falls. That makes the job harder: you must not only judge whether an asset is going up or down, but whether your wealth is actually growing after inflation and currency debasement. In this brave new world, the scoreboard moves, but so does the ruler measuring it.
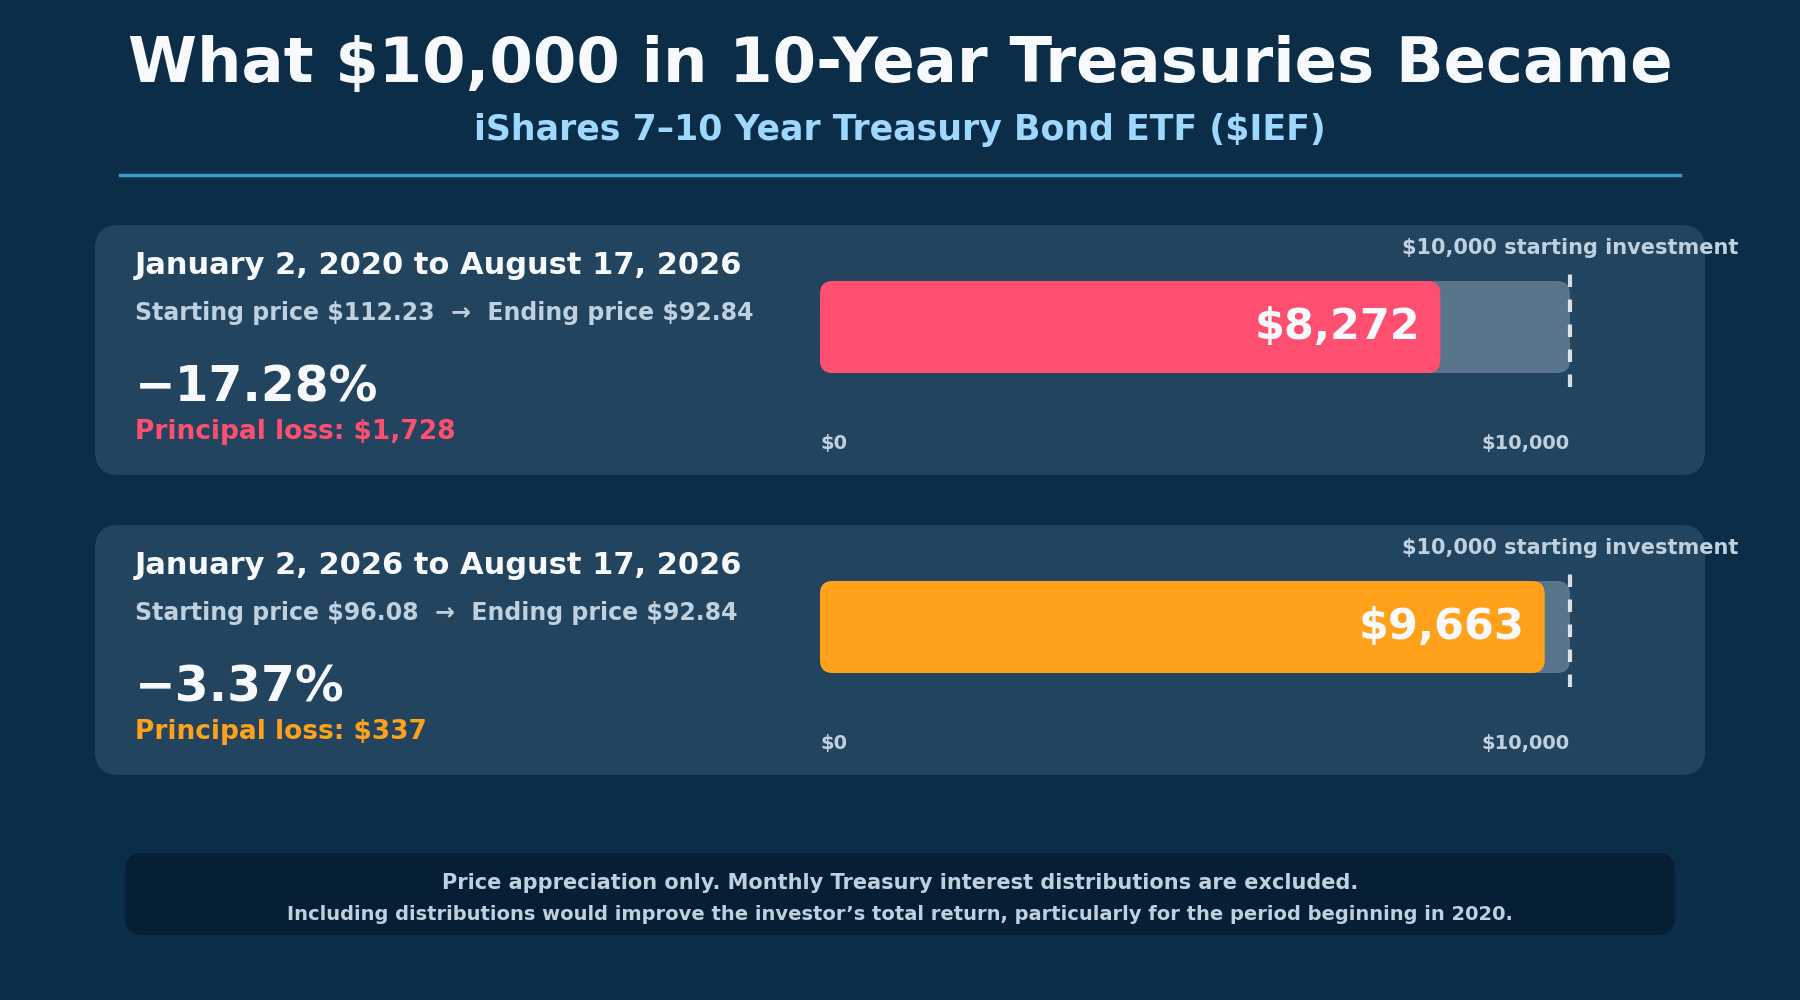
The overriding problem today is that there is a great reluctance to lend Uncle Sam money. That is a very bitter pill to swallow. That is the message buried inside the Treasury market. A $10,000 investment in the IEF Treasury ETF on January 2, 2020 has fallen to roughly $8,272 based on price alone. Even someone who entered on January 2, 2026 is underwater before counting interest payments. The United States can still find lenders, but increasingly, those lenders are demanding higher yields as compensation for inflation, debt and fiscal uncertainty. This forces everyone to become a speculator,
Traders have an expensive habit. They embrace a narrative while it works, then cling to it after reality has changed. Fifty-five years after President Nixon severed the dollar’s final link to gold, we live in a “number go up” economy. Stocks rise, houses cost more, salaries increase, and retirement accounts grow, so we call it progress. But if your salary doubles while the price of a home triples, you did not become wealthier. You merely received a larger number measured with a smaller ruler. It is against this backdrop, the declining faith in the credit of the US government that all of the financial markets operate. The government will never outright default on their commitments but what has become visibly true is that the government has become very proficient at paying back its longer term obligations with debased dollars.
That is the real purpose of this article. It is not an argument that gold is superior to stocks or that America should return to the gold standard. It is an examination of how we measure wealth when the measuring stick keeps changing. If $1 million no longer buys the security it once promised, the larger number is not necessarily evidence of progress. It may simply reveal how much purchasing power the currency has surrendered while everyone was watching the scoreboard.
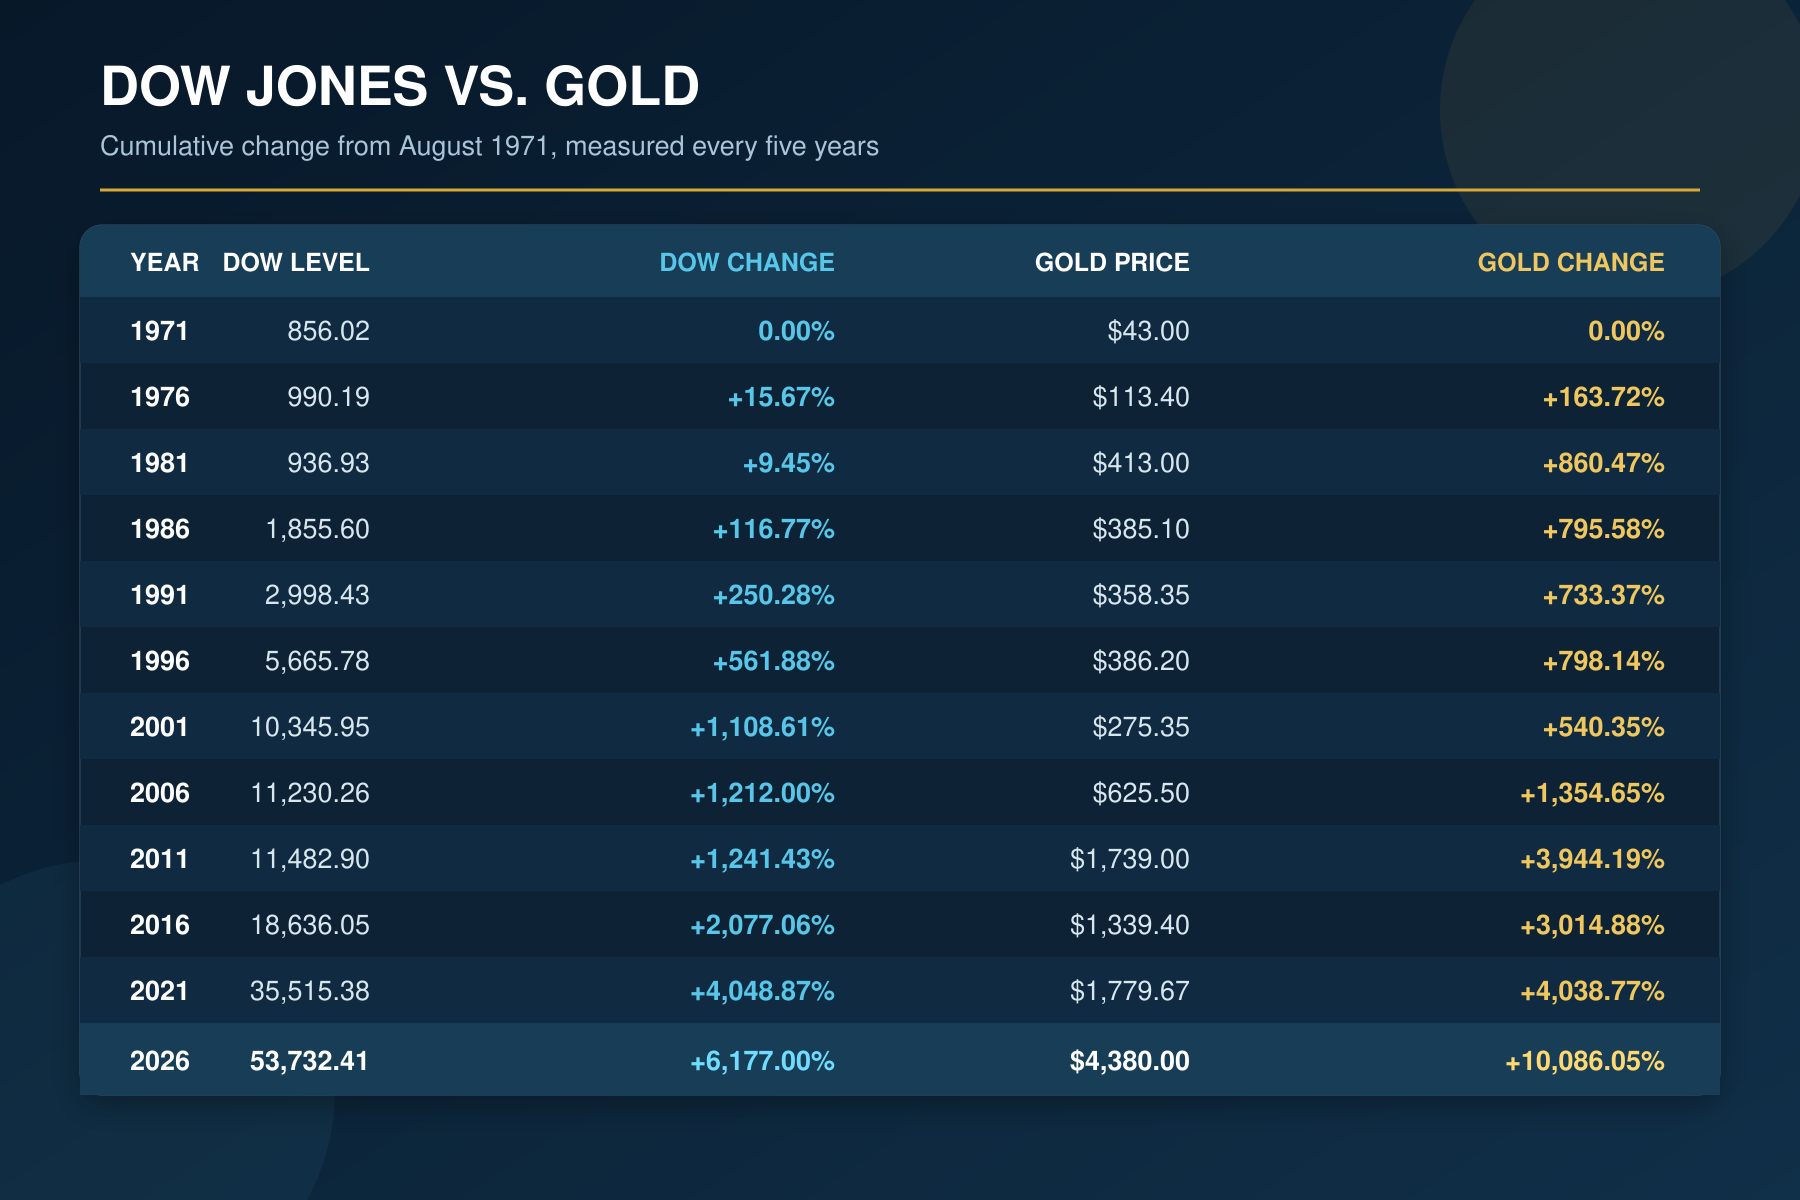
There are many ways to judge an investment, and we will explore several of them, but every asset has its spring, summer, fall and winter. Since the dollar’s final link to gold was severed, however, long-term planning has increasingly given way to rising account balances which are easily mistaken for rising wealth. The necessary question is always: compared with what? Measured from 1971, the Dow advanced roughly 6,177%, while gold rose about 10,086%, revealing distinct seasons for both assets but an unmistakable long-term winner. Gold, once money itself, outperformed an index representing 30 of America’s most prominent companies, and that is a bitter verdict on the ruler we have used to measure financial progress.
Regardless if you are new to the markets or a seasoned veteran, one of the side effects to a fiat based currency system is how quickly markets change and try to adapt to the forces that are driving it.
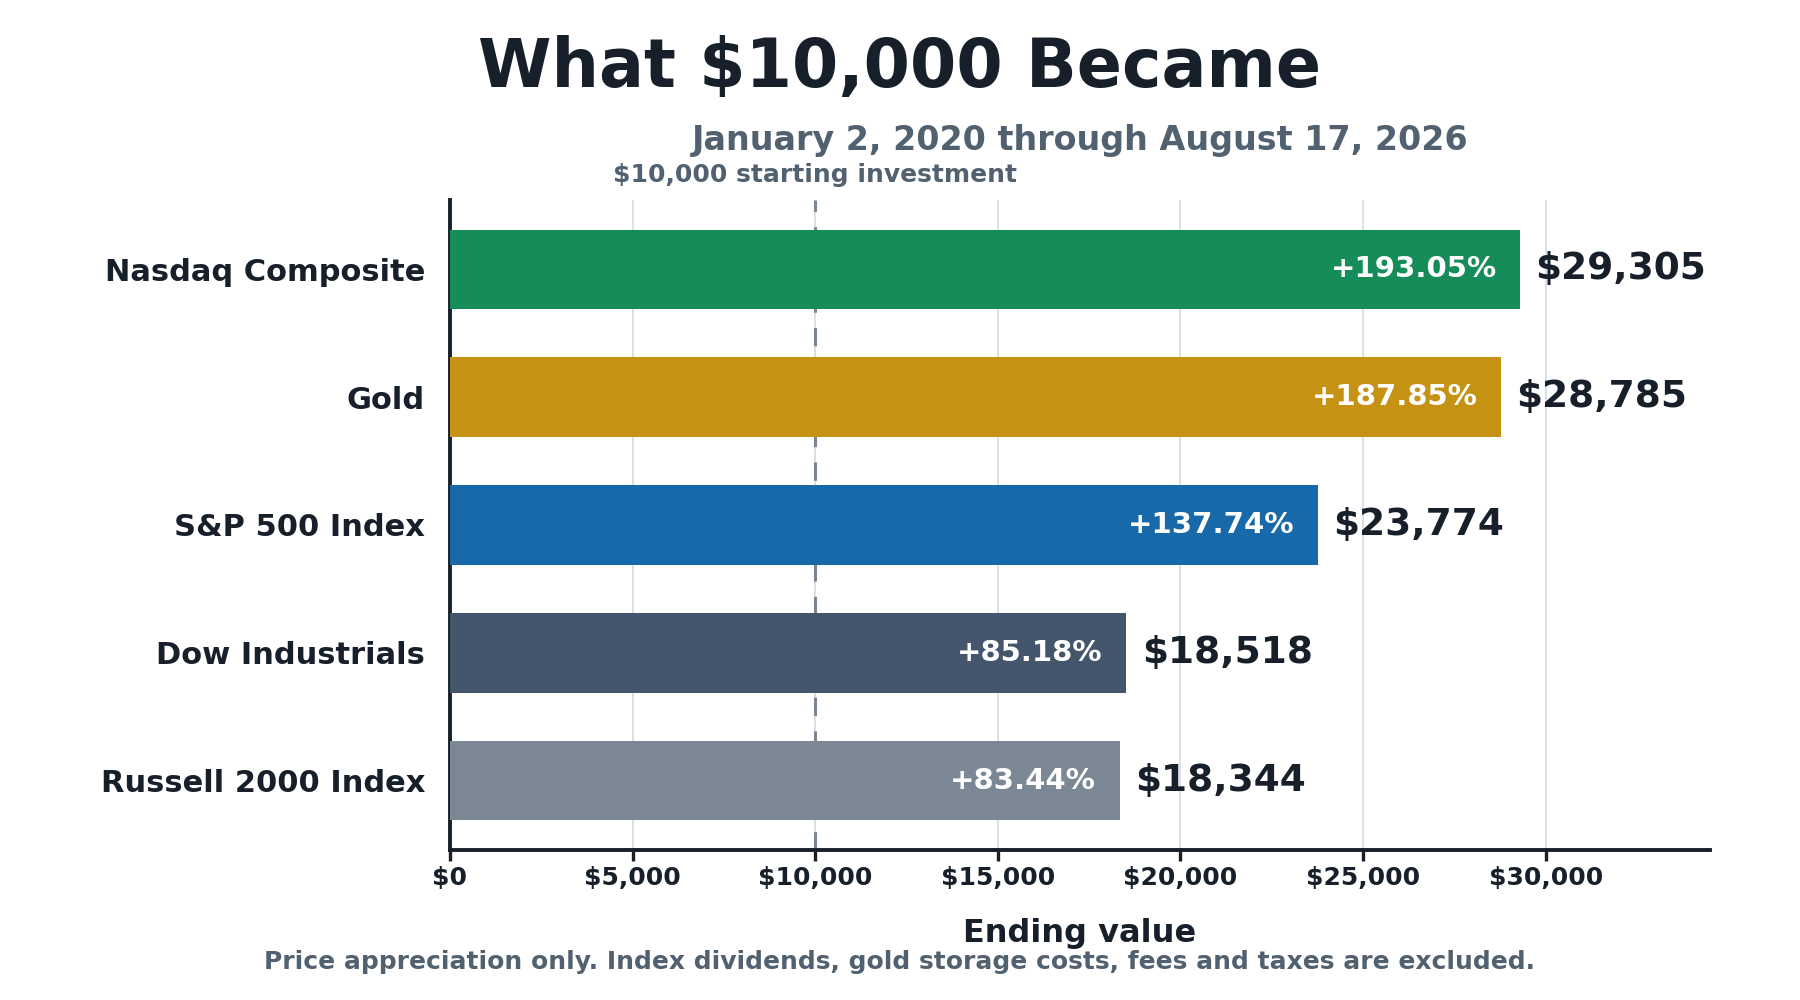
If you had invested $10,000 in January 2020, the Nasdaq would have finished slightly ahead at $29,305. Gold followed remarkably close at $28,785, while the S&P 500 reached $23,774. The Dow and Russell 2000 made money too, but they traveled at a considerably slower pace.
The useful lesson is that wealth does not always come from the asset with the most exciting story. Gold nearly matched America’s technology-heavy Nasdaq and comfortably beat the broader indexes. A sensible trader watches the scoreboard, keeps an open mind and remembers that yesterday’s slow horse can become tomorrow’s leader.
Now shorten the starting gate to January 2, 2026, and the horse race changes completely. Gold, which nearly matched the Nasdaq over the longer period, falls to last place with a gain of just 1.13%. Meanwhile, the Russell 2000 jumps from the worst long-term performer to the fastest horse of 2026, gaining 21.90%. The Nasdaq remains strong at 14.67%, followed by the S&P 500 at 12.93% and the Dow at 10.49%.
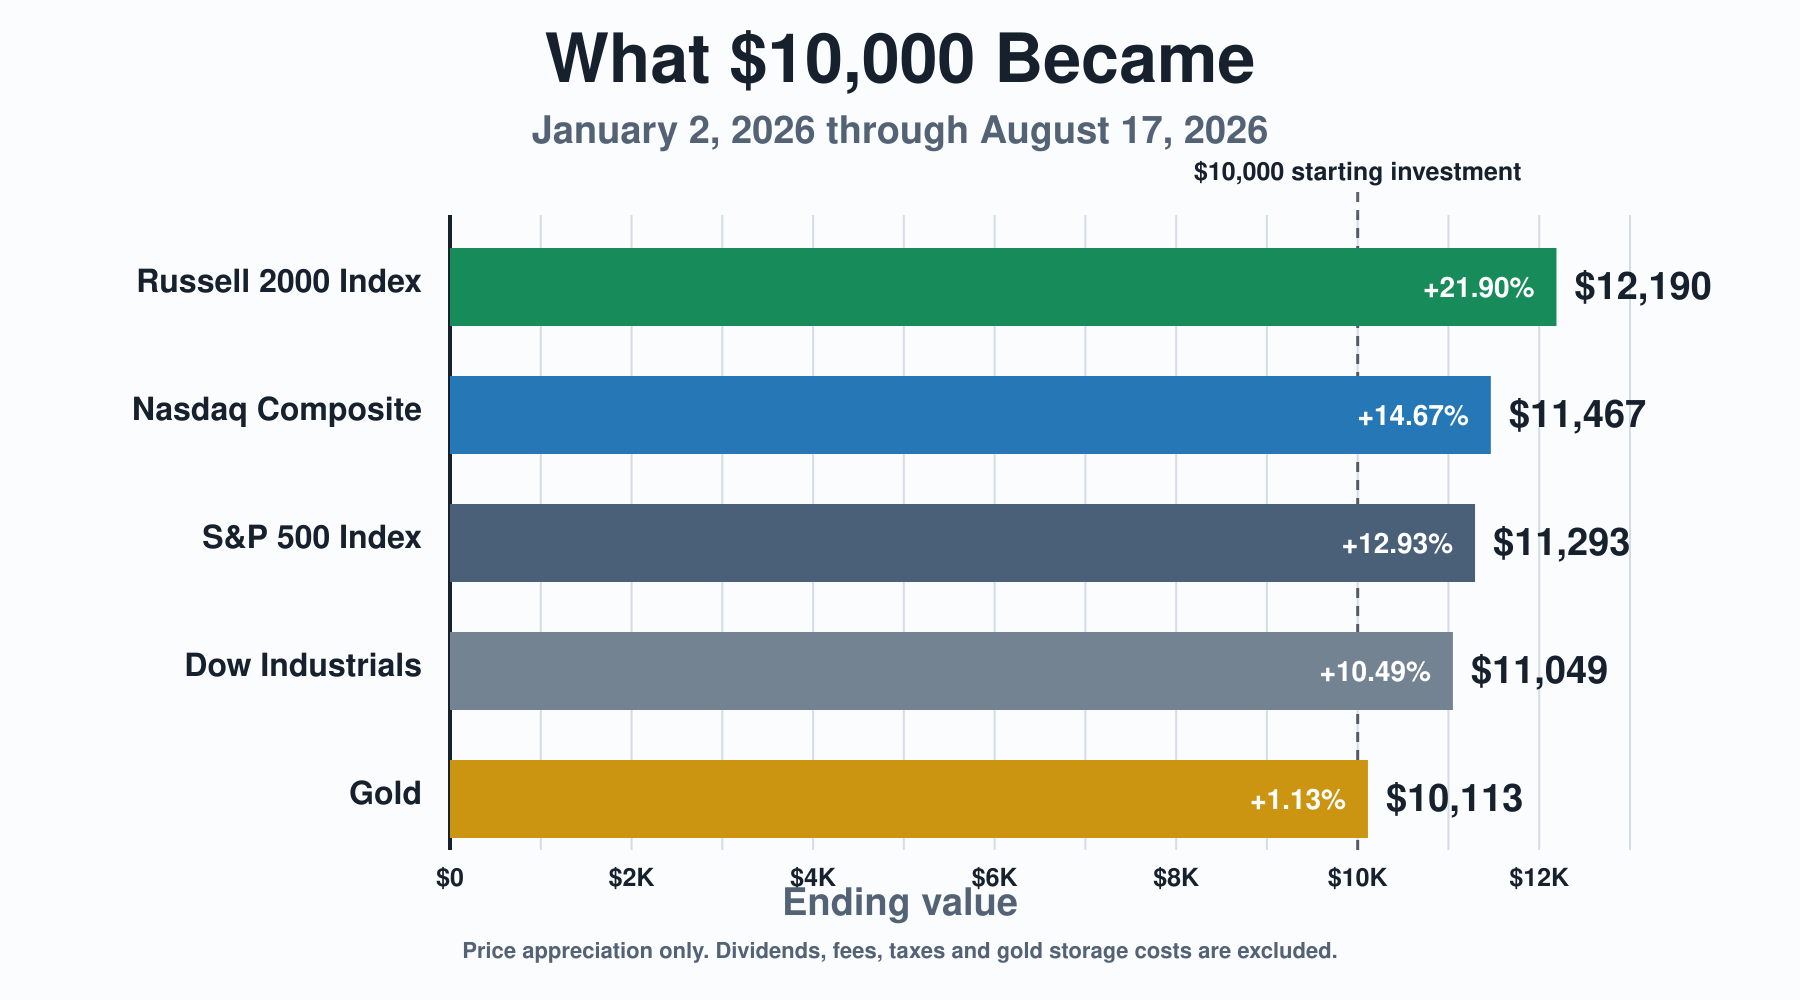
This is the nuance traders cannot afford to ignore. A long-term narrative may explain where an asset has been, but it does not tell you which asset has momentum now. Leadership changes. Seasons change. The horse that dominated the last six years may already be slowing, while yesterday’s laggard is moving into spring.
That is why performance should be evaluated across multiple time frames. The long-term view provides context, but shorter periods reveal rotation, momentum and emerging opportunity. The goal is not to defend a favorite investment. It is to recognize when the race has changed and position yourself with the horse that is actually running fastest now.
Everybody wants to own the fastest horse in the race. That sounds simple until you realize the winner changes depending on where you place the starting gate and when you stop the clock. Historians understand this. Traders often forget it. Change the dates, and yesterday’s champion can become today’s also-ran.
Every market has four seasons. Spring is when a new trend quietly begins. Summer is when momentum becomes obvious and profits come more easily. Fall is when the trend weakens, even though the old story still sounds convincing. Winter is when the narrative remains alive but the money starts disappearing. The trader’s job is not to marry the horse. It is to recognize the season.
That is where narratives become dangerous. A strong narrative moving in harmony with the trend can be extraordinarily profitable. But when the trend changes and the trader keeps believing the story, the narrative becomes an anesthetic. It dulls the pain, explains away the warning signs and keeps the trader committed while price moves in the opposite direction. Markets do not pay you for believing the best story. They pay you for being aligned with what is actually happening.
VantagePoint AI can help traders evaluate whether an asset is strengthening, weakening, or moving through a transition. It cannot eliminate uncertainty, but it can force us to compare the story against trend direction, momentum and intermarket relationships. That matters because the fastest horse in spring may be exhausted by winter.
A long-term narrative may explain where an asset has been, but it does not tell you which asset is leading next. VantagePoint AI can. Leadership changes. Seasons change. The horse that dominated the last six years may already be slowing, while yesterday’s laggard is moving into spring.
Beginning in January 2020, the Magnificent Seven did not merely beat the market. They mugged it, took its lunch money and are now buying a data center with the proceeds.
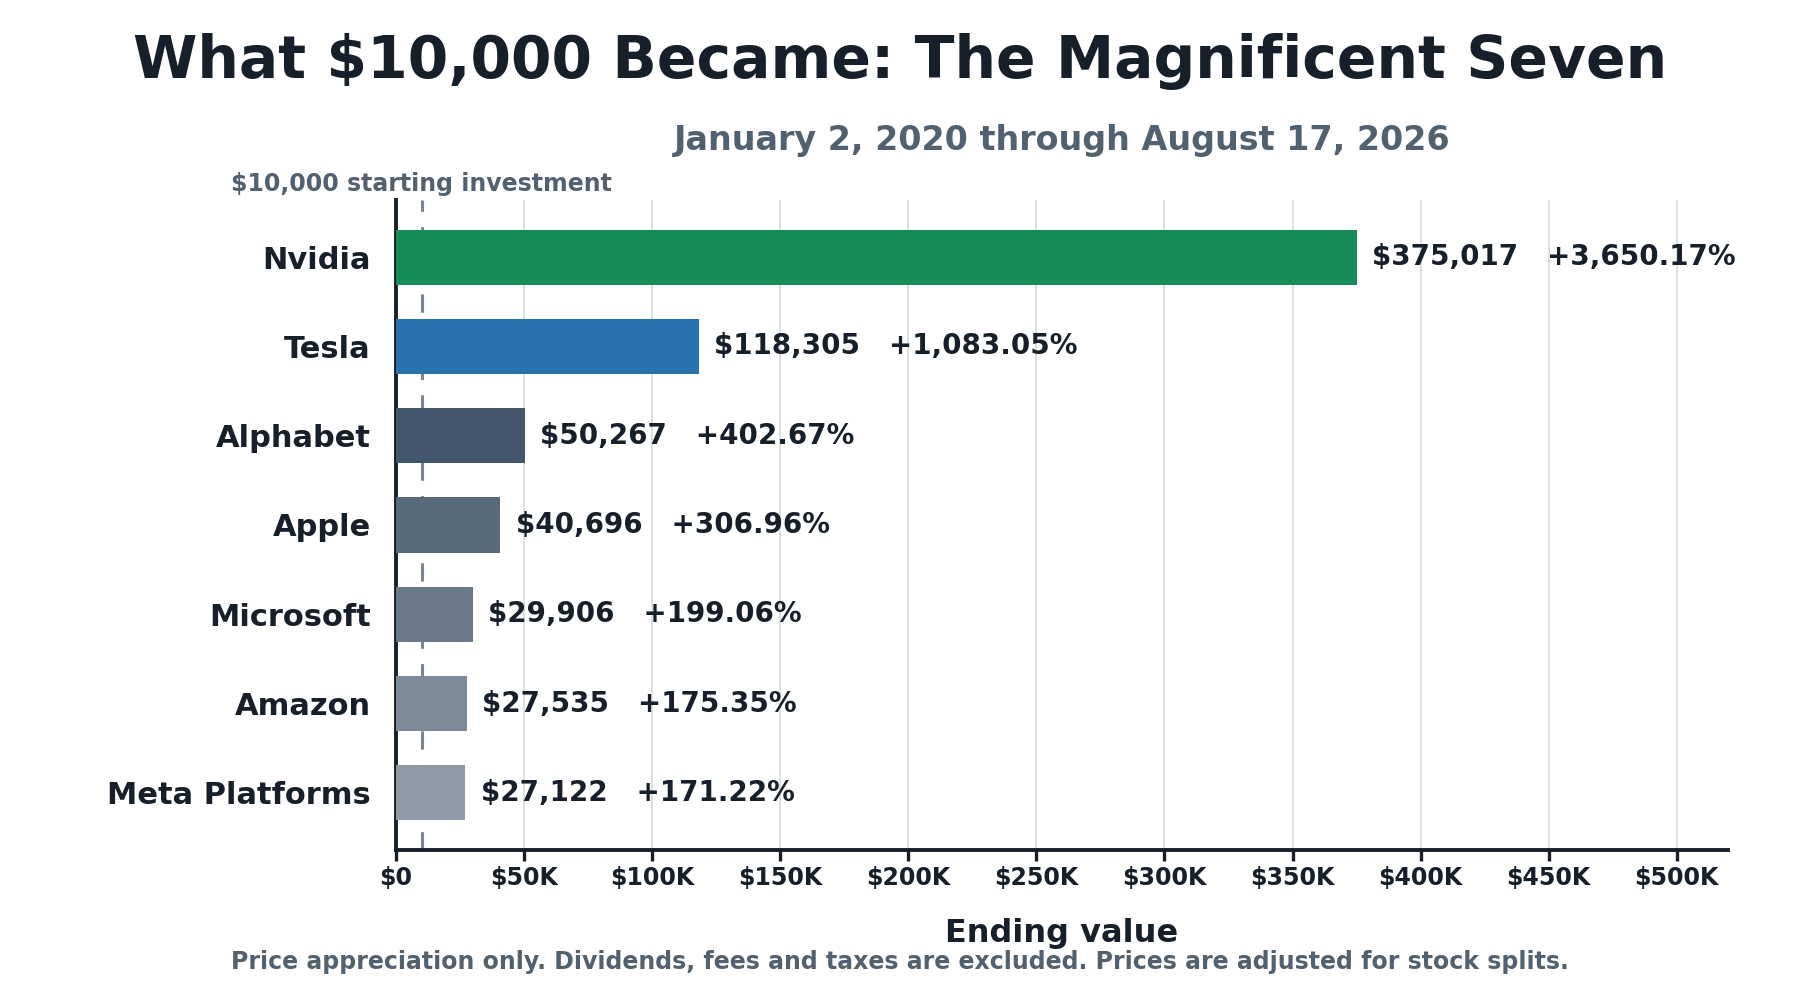
Nvidia was the undisputed champion. A $10,000 investment became $375,017, a gain of 3,650%. Tesla finished a distant second, although “distant” is a peculiar word for turning $10,000 into $118,305. Alphabet produced $50,267, Apple reached $40,696, and Microsoft nearly tripled the original investment. Even the group’s supposed laggards, Amazon and Meta, turned $10,000 into more than $27,000.
Nobody actually lost money over the full period. The only “losers” were stocks that failed to become outrageously rich as quickly as Nvidia. That is what happens when Wall Street creates a celebrity class. A 171% gain begins to look disappointing because the fellow standing next to you made 3,650%.
Compared with the broader market, the dominance was remarkable. The Nasdaq gained 193%, the S&P 500 rose 138%, the Dow advanced 85%, and the Russell 2000 gained 83%. Every member of the Magnificent Seven beat the S&P 500. Nvidia and Tesla did not beat it by a nose. They had finished the race, showered and attended the awards banquet before the index reached the final turn.
Then 2026 arrived and rearranged the furniture.
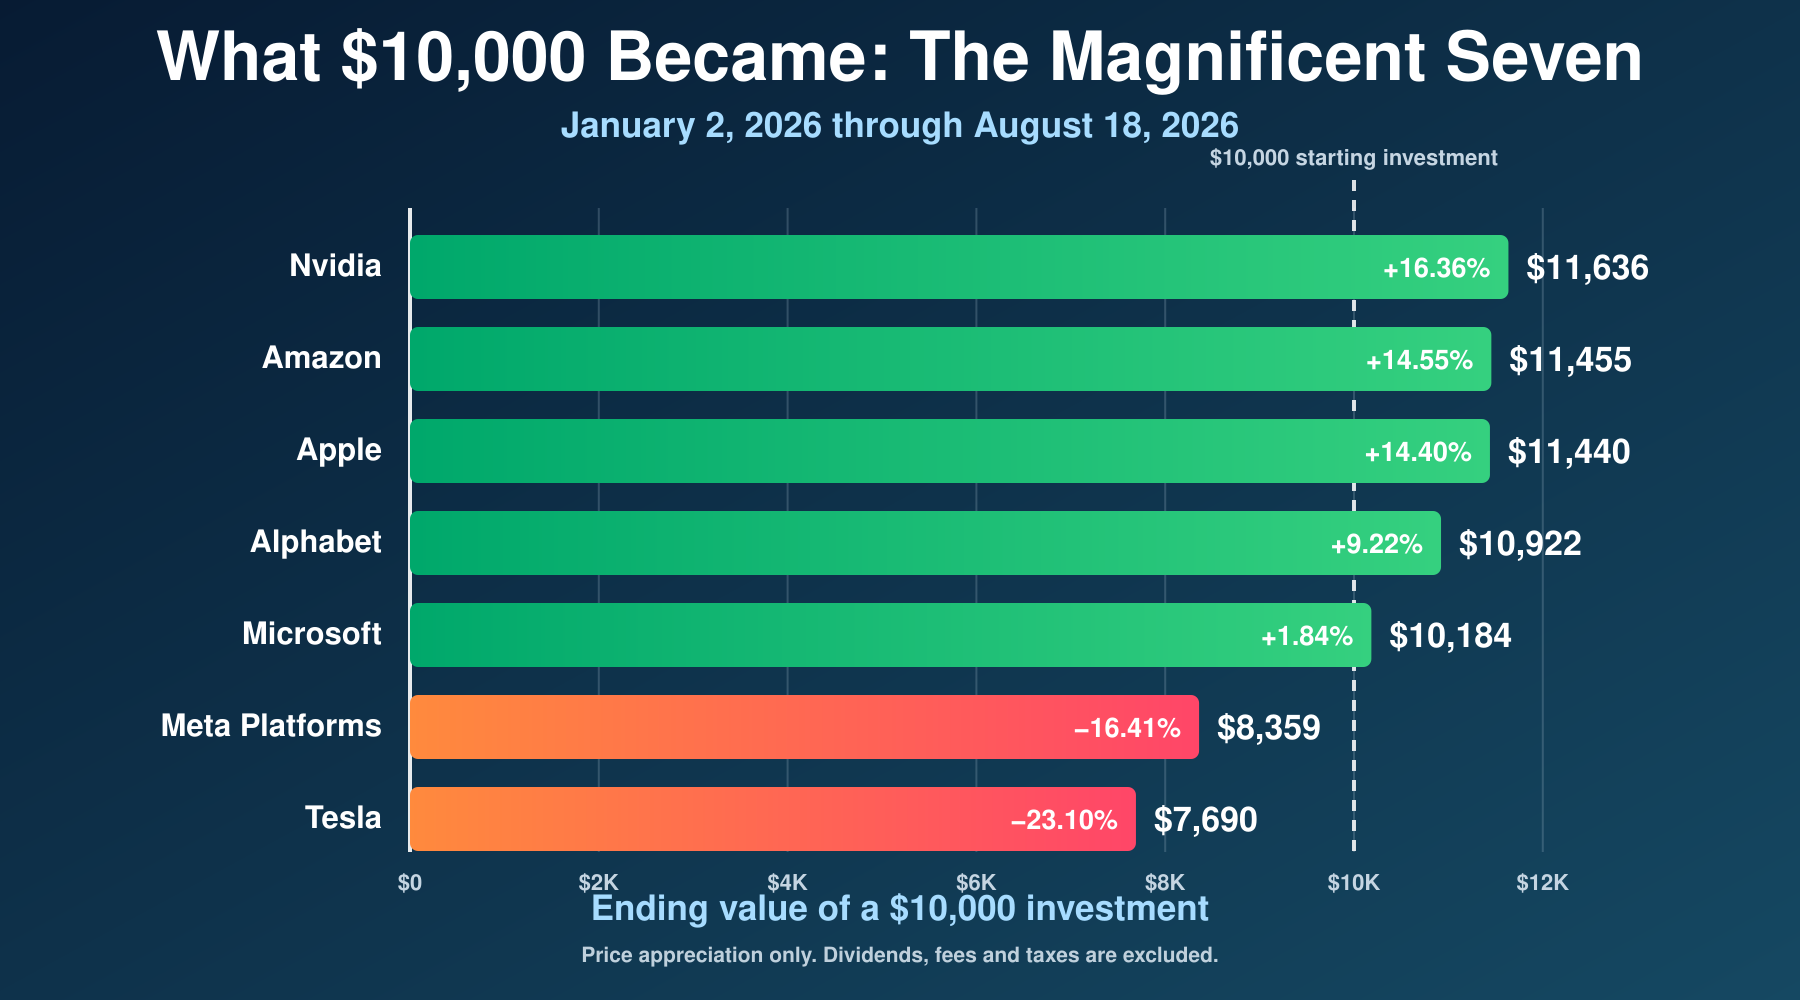
Nvidia remained the leader, but its gain was a comparatively ordinary 16.36%. Amazon climbed into second place at 14.55%, followed closely by Apple at 14.40%. Alphabet gained 9.22%, while Microsoft barely moved at 1.84%. The real shock came from Meta, down 16.41%, and Tesla, the former long-term silver medalist, down 23.10%.
The gap between Nvidia and Tesla in 2026 was nearly 40 percentage points. One turned $10,000 into $11,636. The other reduced it to $7,690. Same exclusive club. Same famous narrative. Very different result.
This shuffling is exactly what great traders monitor. They do not assume that yesterday’s fastest horse has signed a lifetime contract with victory. They watch leadership, momentum and relative strength because markets are under no obligation to preserve the old ranking. The Magnificent Seven may remain magnificent, but magnificence is not evenly distributed, and it certainly is not permanent.
The lesson is simple. Reputation tells you who won the last race. Price action tells you who is winning this one.
Let’s apply the same logic to the 11 stock market sectors.
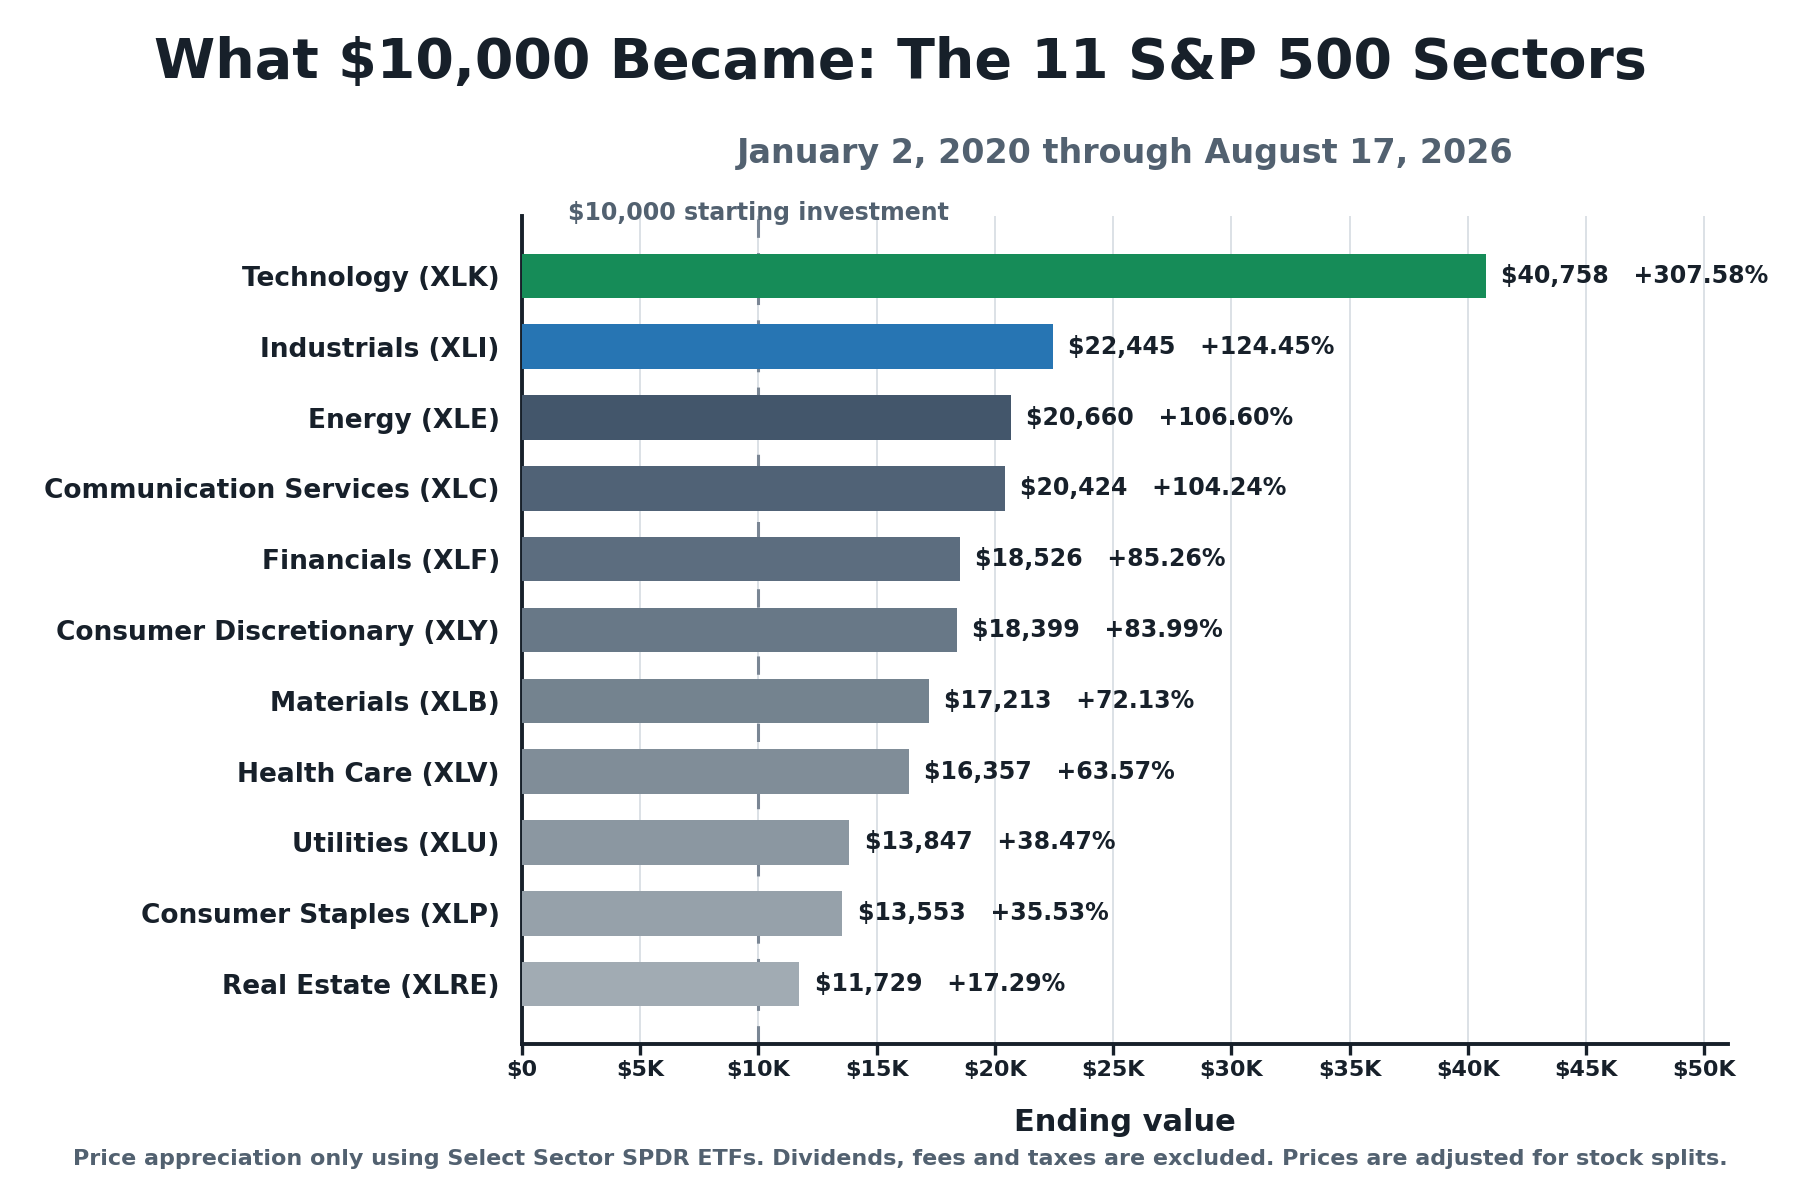
From January 2020 through August 2026, Technology ruled the market with the confidence of a monarch who had eliminated elections. A $10,000 investment became $40,758, a gain of more than 307%. Industrials finished a distant second at $22,445, while Energy and Communication Services roughly doubled the original investment.
At the bottom were the sectors investors buy when they want excitement kept to a medically responsible level. Utilities produced $13,847, Consumer Staples reached $13,553, and Real Estate finished last at $11,729. Nobody lost money, but some sectors spent six years proving that positive returns and impressive returns are not the same thing.
Then the calendar turned to 2026 and the market changed the seating arrangement.
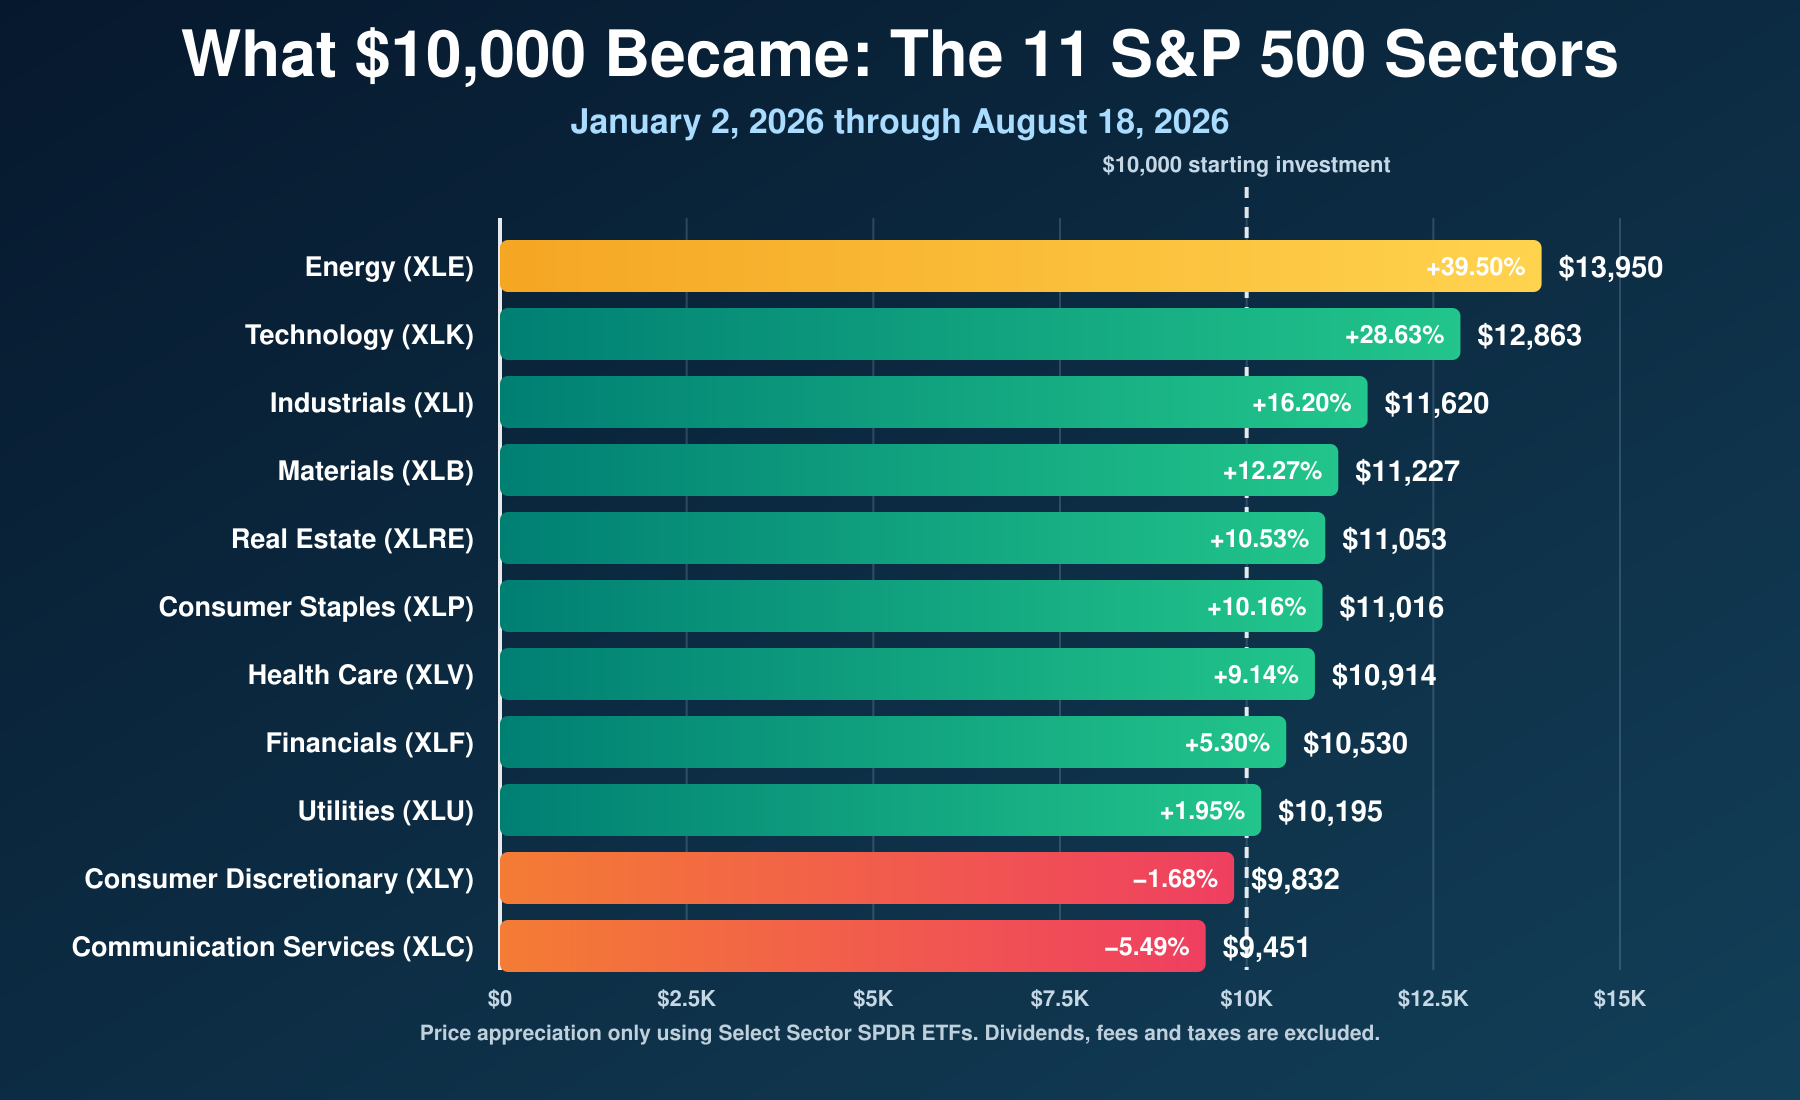
Energy surged 39.50%, turning $10,000 into $13,950 and taking first place. Technology remained powerful with a 28.63% gain, but it was no longer the unquestioned ruler. Industrials held third place at 16.20%, while Materials climbed 12.27%.
The most revealing changes occurred farther down the list. Real Estate, the worst performer over the longer period, jumped into fifth place with a 10.53% gain. Communication Services, which had more than doubled since 2020, fell to last place with a loss of 5.49%. Consumer Discretionary also slipped below the starting line, losing 1.68%.
This is sector rotation, Wall Street’s polite term for discovering that the thing everyone loved yesterday is no longer paying the bills. Capital moves. Leadership changes. Old laggards wake up, former champions slow down, and investors who remain loyal to a story discover that the market does not issue rewards for emotional commitment.
Great traders watch this shuffling because it reveals where money is moving now. They compare sectors across multiple time frames, measure relative strength and look for improving or deteriorating trends. The long-term chart tells you where wealth was created. The shorter-term chart tells you where the next opportunity may be forming.
Yesterday’s champion deserves respect. Today’s leader deserves your attention.
Great traders are students of performance, because markets have an inconvenient habit of rewarding strength longer than most people expect. Winners often keep winning, not because markets obey some permanent law, but because capital tends to migrate toward assets where earnings, momentum, liquidity and expectations are already improving. That is why the best traders are almost obsessive about two questions: What is working? And where is the money being made? Those questions force you to deal with the market that actually exists rather than the market you believe should exist. There will always be persuasive arguments for why an undervalued stock should rally, why an expensive market should fall, or why yesterday’s winner cannot possibly keep climbing. But price does not pay attention to elegant theories. Performance is evidence. Follow it closely enough, and it tells you where capital is moving, where leadership is emerging, and where opportunity exists right now.
The comparisons reveal how dramatically market leadership can change. Adjust the starting date, shorten the holding period or choose a different benchmark, and the fastest horse may suddenly appear quite ordinary. That is why traders watch momentum, relative strength and changing trends instead of relying exclusively on long-term reputations.
But every performance chart presented so far shares one assumption that is rarely questioned: the results are measured in dollars.
The dollar is treated as if it were a fixed yardstick. It is not. Its purchasing power changes as the supply of money expands, debt accumulates and the prices of scarce assets rise. If the ruler itself becomes shorter, the number being measured will increase even when little genuine progress has occurred.
That distinction sits at the center of the “number go up” economy. A portfolio rises, a house appreciates and a salary doubles, so we declare ourselves wealthier. But if housing, education, healthcare and retirement have become even more expensive, what exactly has been gained?
Price is not an absolute measurement. It is a ratio of exchange between an asset and the currency used to value it. Before deciding who won the race, therefore, we must examine the measuring stick. That brings us to August 15, 1971, when President Nixon severed the dollar’s final link to gold and America began a monetary experiment that continues 55 years later.
Once the dollar was no longer redeemable for a fixed quantity of gold, the monetary system had greater freedom to expand money and credit. Government debt could grow with fewer external constraints. Asset prices could rise to levels that would once have seemed extraordinary. Salaries could increase. Homes could become worth hundreds of thousands, then millions. The Dow could rise from roughly 900 to tens of thousands of points.
And thus began what might be called the “number go up” economy.
There is nothing wrong with numbers going up. The trouble begins when we confuse a larger number with greater wealth. If your portfolio rises from $1 million to $1.3 million while the purchasing power of the currency falls by a comparable amount, your brokerage statement looks more impressive without necessarily buying you much more.
Inflation therefore becomes the silent partner in every investment decision.
Consider the period since January 2020. Using the Consumer Price Index as the measuring stick, the cumulative increase in U.S. consumer prices has been roughly 30% through mid-2026. That means an investor who began with $100 of purchasing power needed approximately $130 simply to buy a similar basket of goods and services several years later. A portfolio that gained 20% may look successful on paper while losing ground in real purchasing power.
Inflation cannot be treated merely as an economic statistic released once a month. For anyone serious about building wealth, it is part of the hurdle rate. Your investments must first outrun the deterioration in purchasing power before genuine wealth creation begins. A 7% return in a world of 2% inflation is quite different from a 7% return in a world of 8% inflation. The brokerage statement may report the same gain. Your standard of living will not.
That leaves traders and investors with a deceptively simple responsibility: never confuse nominal wealth with real wealth.
Fifty-five years after Nixon closed the gold window, America has vastly larger stock indexes, larger salaries, larger home prices, larger government budgets and dramatically larger quantities of debt. The numbers have certainly gone up.
But that was never the most important question.
The question is how much more those numbers can actually buy.
The government does not have to miss a payment to default on a promise.
Treasury principal, Social Security benefits, pensions, annuities, bank deposits and insurance benefits are generally promised in dollars. And the government will deliver every one of those dollars, right on schedule, while quietly stripping away much of what they were supposed to buy.
The check arrives. The number is correct. The promise appears to have been honored.
But the grocery bill is higher. Housing costs more. Insurance costs more. Medical care costs more. The retirement income that once promised independence now requires compromise.
This is the fiat system’s most subtle form of default. There is no missed payment, bankruptcy filing or frightening announcement. The contract is honored numerically while being diminished economically.
You receive every dollar you were promised. You simply do not receive the life those dollars were supposed to provide.
Gold is not always the fastest horse. Sometimes it races. Sometimes it sleeps. But over long periods, gold performs another job: it grades the currency. When gold rises in dollars, two things may be happening. Gold may be gaining value, or the dollar may be losing purchasing power. Usually, it is some combination of both.
That is why the Dow/Gold ratio matters. When it rises, stocks are gaining ground against gold. When it falls, gold is gaining ground against stocks.
Gold is not the answer to every investment question. It is the ruler that exposes whether your answer is honest.
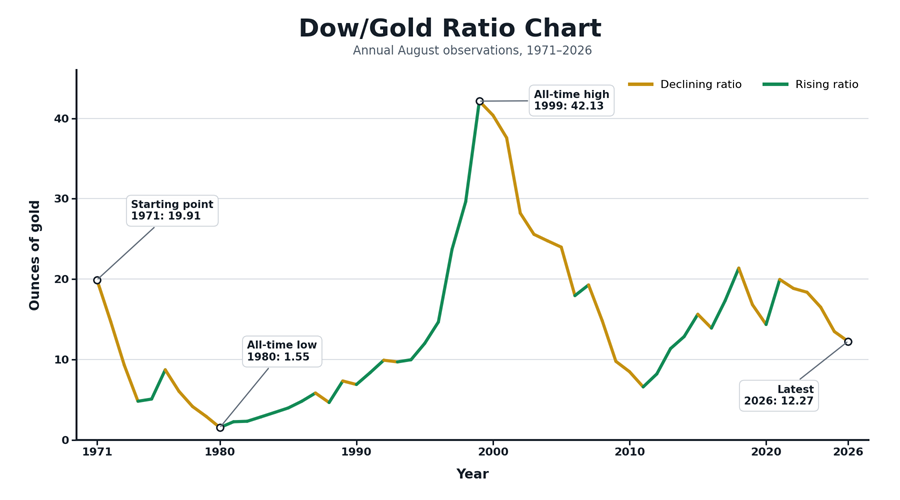
The Dow/Gold Ratio is a wonderfully simple scoreboard. It asks how many ounces of gold it takes to buy the Dow. When the green line is rising, stocks are winning the race. When the gold line is falling, gold is doing the better job of preserving wealth. And as the chart makes painfully clear, leadership can persist for years. Gold dominated the 1970s, stocks took command during the great bull market that followed, and since the 1999 peak, the contest has become considerably more complicated.
The lesson is not that stocks are better than gold or gold is better than stocks. That is like arguing whether you should own an umbrella or sunglasses. It depends on the weather. The important thing is to recognize where wealth is actually being created and preserved. In 1971, it took nearly 20 ounces of gold to equal the Dow. At the great stock-market peak in 1999, it took more than 42. Today it takes about 12. The numbers went up enormously over those 55 years, but this chart reminds us that what matters is what those numbers can buy.
According to the Federal Reserve’s own purchasing-power data, the U.S. dollar has lost approximately 88%of its value since Nixon closed the gold window. A dollar held in August 1971 now buys only about 12 cents’ worth of comparable goods and services. Meanwhile, the M2 money supply has expanded from $685.5 billion to more than $23.1 trillion, an increase of nearly 3,300 percent. Gold does not vote, make promises or hold press conferences. It simply records what governments do to money.
Trading has never been easy. But evaluating a financial decision in a world of persistent currency debasement and volatile interest rates is especially difficult because both the investment and the measuring stick are moving. A stock can rise while losing purchasing power. A bond can pay interest while declining sharply in market value. A portfolio can look larger on paper while supporting a smaller standard of living. The challenge is no longer simply finding an asset that goes up. It is determining what is rising, why it is rising and whether the trend is likely to continue.
The human mind was not designed for this assignment.
No trader can continuously track thousands of stocks, interest rates, commodities, currencies, global indexes and the relationships connecting them. We become tired. We grow attached to our opinions. We notice evidence that confirms what we already believe and dismiss evidence that threatens the story.
By the time the change becomes obvious, the market has often changed seasons and moved on without us.
VantagePoint’s patented Artificial intelligence is the most powerful analytical tool available to traders today because it can examine enormous amounts of market information with a speed, consistency and discipline no human being can match. It can identify patterns, compare relative strength, analyze intermarket relationships and monitor changes in momentum across many markets simultaneously. It can save hours of research, focus attention on the strongest opportunities and warn when a previously healthy trend begins to weaken. Most importantly, it can help traders evaluate what the market is doing instead of what they hope it will do.
Our Artificial intelligence gives traders an extraordinary opportunity to approach the markets with greater speed, clarity and confidence. It can organize immense amounts of information, uncover relationships the human eye may miss and replace unnecessary guesswork with objective evidence. Combined with sound judgment, position sizing and disciplined risk management, it becomes a powerful decision-making partner. The goal is not to predict every market move. It is to recognize stronger opportunities, respond more intelligently and make better-informed decisions with greater consistency.
That is precisely what VantagePoint AI was designed to help traders accomplish. By studying intermarket relationships and forecasting trend direction, momentum and expected price ranges, it helps identify which markets may be moving into spring or summer and which may be slipping toward fall or winter. It gives traders a disciplined framework for finding the right trend, evaluating the right moment and recognizing when the evidence has changed. You remain responsible for every decision, but you no longer have to make that decision armed only with yesterday’s news, a favorite narrative and a shrinking financial ruler.
If you are curious but cautious, that is exactly how you should approach this. Do not accept grand promises. Examine the process. Learn how the forecasts are created, how the indicators work together and how artificial intelligence can be incorporated into a disciplined trading plan. The markets will continue changing, interest rates will continue moving and yesterday’s fastest horse will not lead forever. The question is whether you will recognize the change early enough to act.
Our goal at VantagePoint is simple: keep you on the right side of the right trend at the right time, while managing risk when the evidence changes. If you’d like to see how traders are using predictive artificial intelligence to uncover opportunities, identify emerging trends, understand powerful intermarket relationships, and make more disciplined trading decisions, I invite you to join us for our FREE Learn To Trade With VantagePoint AI Live Online Masterclass.
It’s not magic.
It’s machine learning.
THERE IS A SUBSTANTIAL RISK OF LOSS ASSOCIATED WITH TRADING. ONLY RISK CAPITAL SHOULD BE USED TO TRADE. TRADING STOCKS, FUTURES, OPTIONS, FOREX, AND ETFs IS NOT SUITABLE FOR EVERYONE.IMPORTANT NOTICE!
DISCLAIMER: STOCKS, FUTURES, OPTIONS, ETFs AND CURRENCY TRADING ALL HAVE LARGE POTENTIAL REWARDS, BUT THEY ALSO HAVE LARGE POTENTIAL RISK. YOU MUST BE AWARE OF THE RISKS AND BE WILLING TO ACCEPT THEM IN ORDER TO INVEST IN THESE MARKETS. DON’T TRADE WITH MONEY YOU CAN’T AFFORD TO LOSE. THIS ARTICLE AND WEBSITE IS NEITHER A SOLICITATION NOR AN OFFER TO BUY/SELL FUTURES, OPTIONS, STOCKS, OR CURRENCIES. NO REPRESENTATION IS BEING MADE THAT ANY ACCOUNT WILL OR IS LIKELY TO ACHIEVE PROFITS OR LOSSES SIMILAR TO THOSE DISCUSSED ON THIS ARTICLE OR WEBSITE. THE PAST PERFORMANCE OF ANY TRADING SYSTEM OR METHODOLOGY IS NOT NECESSARILY INDICATIVE OF FUTURE RESULTS. CFTC RULE 4.41 – HYPOTHETICAL OR SIMULATED PERFORMANCE RESULTS HAVE CERTAIN LIMITATIONS. UNLIKE AN ACTUAL PERFORMANCE RECORD, SIMULATED RESULTS DO NOT REPRESENT ACTUAL TRADING. ALSO, SINCE THE TRADES HAVE NOT BEEN EXECUTED, THE RESULTS MAY HAVE UNDER-OR-OVER COMPENSATED FOR THE IMPACT, IF ANY, OF CERTAIN MARKET FACTORS, SUCH AS LACK OF LIQUIDITY. SIMULATED TRADING PROGRAMS IN GENERAL ARE ALSO SUBJECT TO THE FACT THAT THEY ARE DESIGNED WITH THE BENEFIT OF HINDSIGHT. NO REPRESENTATION IS BEING MADE THAT ANY ACCOUNT WILL OR IS LIKELY TO ACHIEVE PROFIT OR LOSSES SIMILAR TO THOSE SHOWN.


