


Welcome to the Artificial Intelligence Outlook for Forex trading.
VIDEO TRANSCRIPT
Okay. Hello everyone, and welcome back. My name is Greg Firman, and this is the Vantage Point AI Market Outlook for the week of April the 15th, 2024.
U.S. Dollar Index
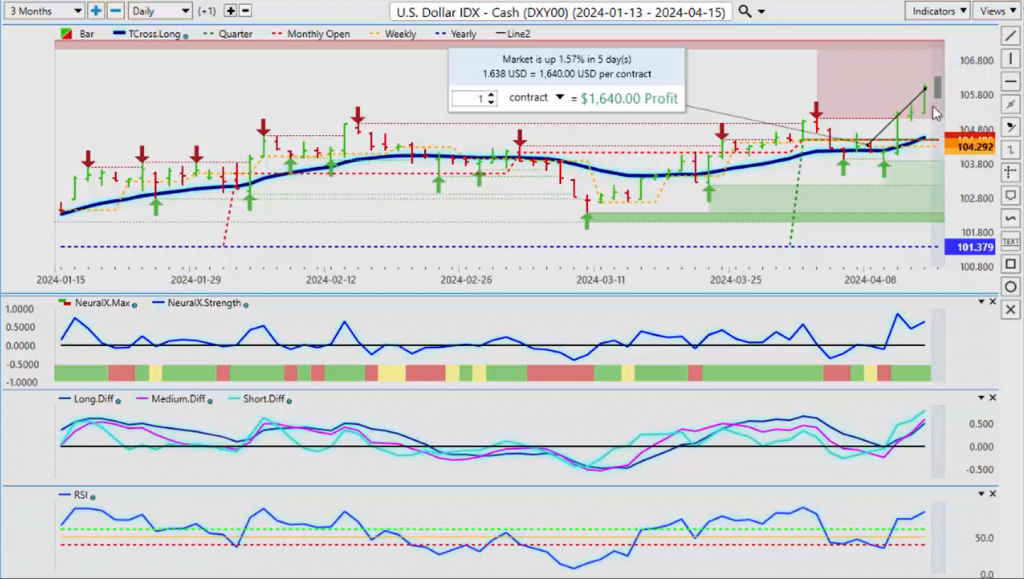
Now, to get started this week, we’ll begin with the Dollar Index. We can see the Dollar Index is up 1.57% on the week. Using an actual solid anchor point like our weekly opening price, we can measure the last 5 days’ performance—again, 1.5%, still more predominantly bullish, I would argue here. But again, the market reacting to a lagging CPI number, one tenth hotter—not really a big deal. We’ll see how this plays out next week. But again, in most cases, Gold is your stronger instrument in the month of April. But the indicators here from Vantage Point are still firm. We can assess here that again, the market came right down to our T Cross Long, our predicted moving average, which is based on the correlation of 31 other markets.
Now, when we look at those actual markets, we can see the inner markets that drive with an actual percentage. We have yearly correlations, quarterly correlations, and monthly correlations. This is all based on the neural nets with the artificial intelligence measuring those correlated markets and how strong they are. We can actually break this down to the top 10 positively correlated and the top 10 inversely correlated. This again tells us other things we can trade, also not just the Dollar Index. But again, 1.57% is a very important number, particularly when we measure it against the equity markets.
S&P 500 Index
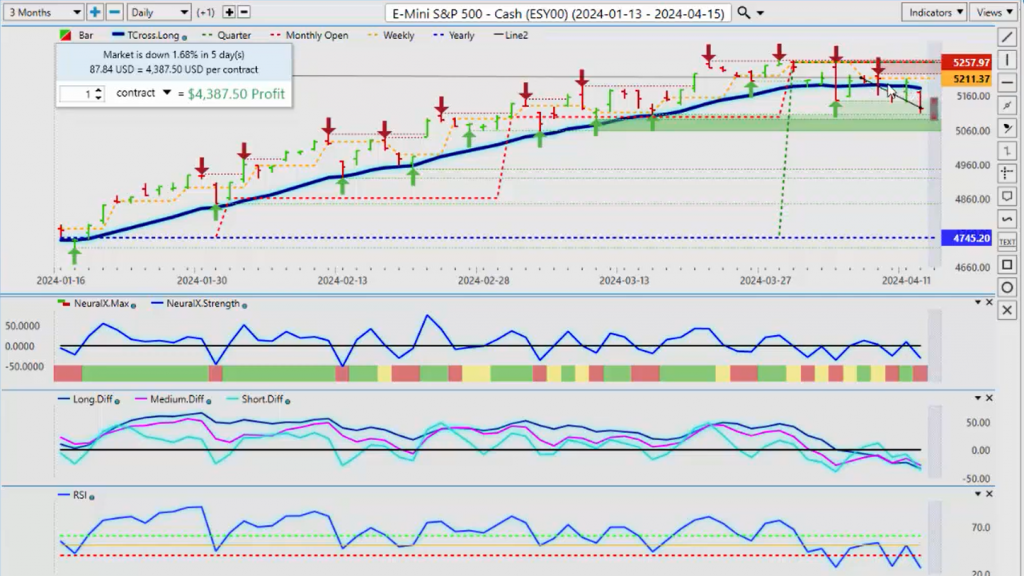
The equity markets were not up .70% last—this past week; they were down 1.68%. It’s very important that we’re using proper anchor points—the current yearly, monthly, quarterly, and weekly. And now starting a new quarter, negative. The equity markets are starting off negative.
DAX
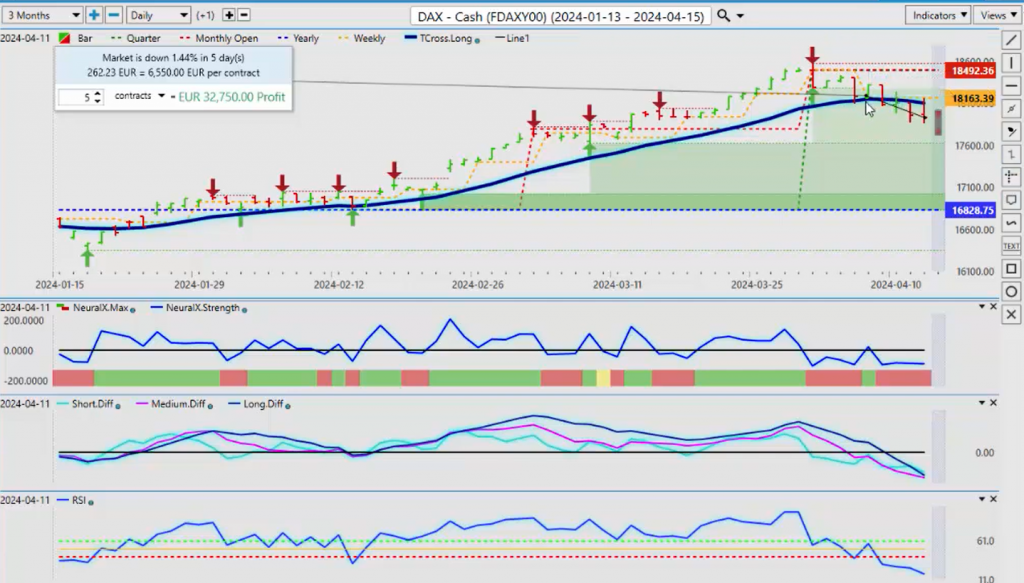
We can assess here that the Dax 30, the European equity markets, even with the ECB talking about rate cuts here in June, their equity markets mirror the S&P 500, both being down about 1.2%, while the Dollar Index again is up 1.5%. So, that inverse correlation between the equity markets and the dollar is starting to show itself again. The dollar and Gold prices pushing equities down. But again, if we’re looking—if we’re moving our anchor points using a rolling performance model, we’re always going to struggle to see what the market actually did in the previous week.
There is nothing subjective about this; this is objective. We use the opening price on Monday and the closing price on Friday—that equals a negative 1.68%, not a positive point 70%. We have to make sure we understand that and we’re measuring it properly, so we don’t get caught in these bull and bear traps. The equities remain positive on the year—the current yearly opening price 4725.
Volatility Index ($VIX)
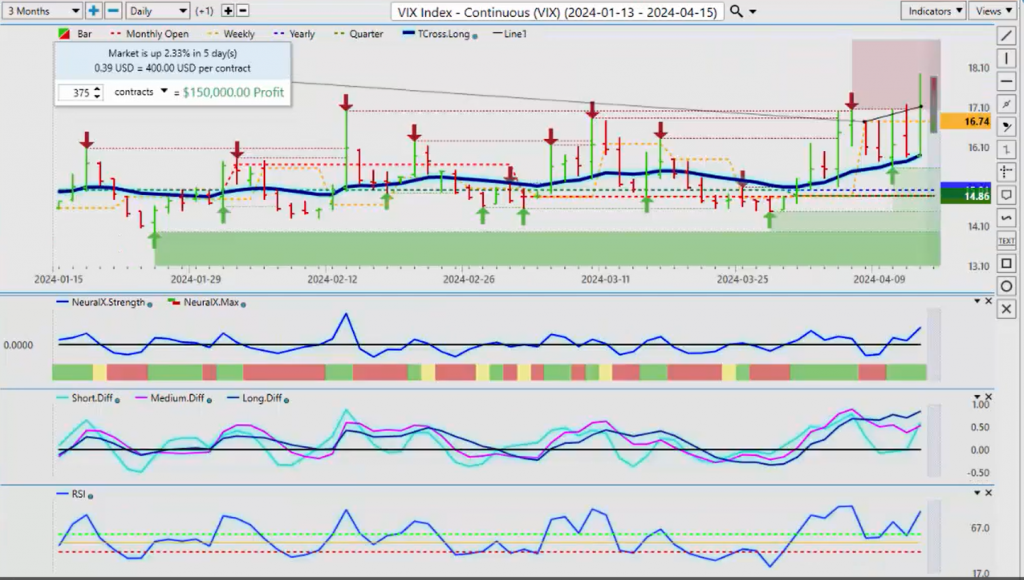
Everything looks quite good there. But when we do a comparative analysis to the VIX, we can see that the VIX is up 2.33%, showing that volatility now. In this past week, you can see that we came all the way down on the VIX, hit the Vantage Point T cross long to the number, and then rallied right back up again, even stronger. So when we look at that VIX and we do a comparative analysis using the artificial intelligence and the correlated markets, we can see what really is driving that VIX.
There’s a high correlation to our Silver, to Platinum ProShares Ultra Silver, First Solar—all of these are driving factors of the actual VIX Index, which is an inverse correlation to the S&P, the Dow, the NASDAQ, the Russell. All of these other markets—so when we use advanced artificial intelligence to measure, first of all, define the correlated market and, secondly, what is the positive and inverse correlation on a percentage basis—70% correlated, 90% correlated, this is what we look for. And then we use the predicted moving average as a retracement point. We don’t use waves, bands, channels. Again, a solid blue line with the correlation of the markets that I just showed you—31 positively and inversely correlated.
GOLD
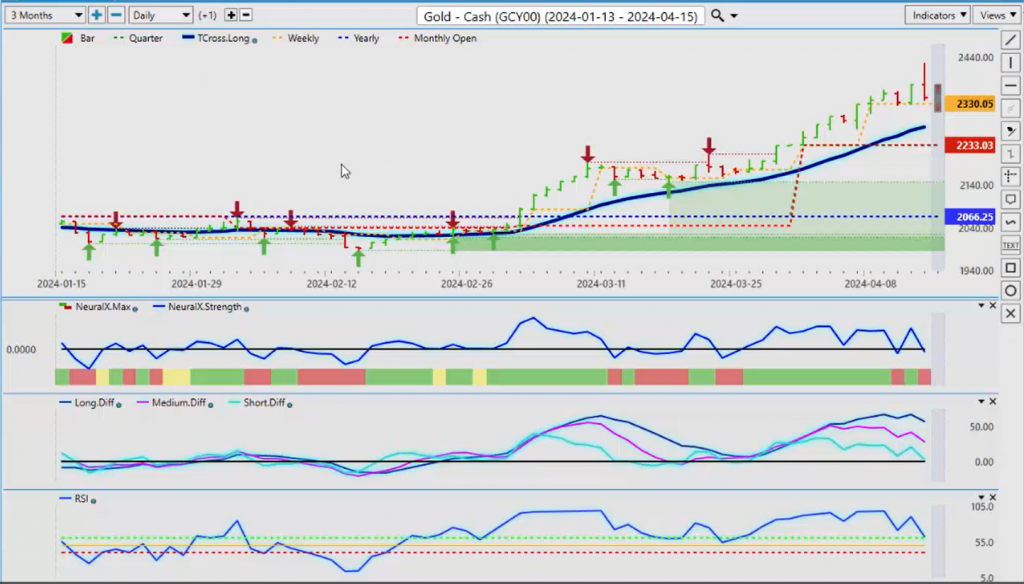
Now, when we look at Gold prices this past week, a lot of rumors of a possible war between Iran and Israel this weekend—we’ll see if that comes to fruition. That briefly sent Gold prices very high on Friday. But again, a classic bull trap up here, where then it immediately gave all of those gains back by the end of the trading session. What we want to be very cautious of, guys, is that when we see a big move like this in a single day, very seldomly is there going to be a lot of follow-through on that. “The retail traders try to jump in at the end of the rally and then they get caught long, and then down it goes. So, Gold does remain bullish—we’re in uncharted territory up here—but our T Cross Long, 2275, that’s our retracement point here, guys. Now, if we click on our F8 in our software, we can see the long predicted, which is another tool. This is the F8, or the long-term crossover without the black line on the VP software, and you can see that Gold hugs that line every single day. When we look at that line, that line takes the correlation of a number of different markets that you can see with an actual percentage. It can be broken down to the yearly correlations, quarterly correlations, and even monthly correlation with an exact percentage. So, when we look at this, the IShare Silver Trust, on either the quarterly or the year, the monthly, there’s, in this particular month, there’s in quarter, there’s a 97.25% positive correlation between these. So, if you don’t want to trade Gold, I’ll respectfully submit you can trade Silver, or you can maybe look for something value-priced like the Gold Miners Bull at $15 a share. Numerous different options we have when using artificial intelligence combined with neural networks. So again, Gold does remain bullish, but we need to hold above that T Cross Long now.”
Bitcoin
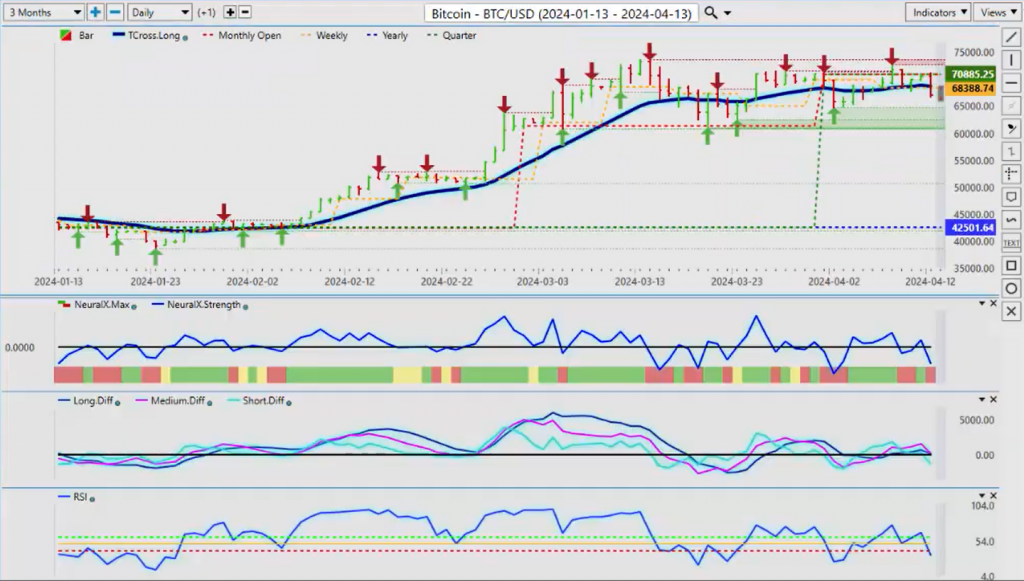
Now, Bitcoin again, taking a little bit of a pullback here, closing down around $67,000 for the week—bearish on the week with that strong dollar but look for a recovery in the days ahead with Bitcoin. Pretty solid buying up here. And again, if we’re looking at longer-term forecasts, many people have different viewpoints on this, but I still remain very bullish on Bitcoin. It’s just a timing issue.
Gold is in its sweet spot in April, one of the strongest months for gold, next to December. So, once the gold strength backs off a bit, Bitcoin will likely start to recover. But right now, our TCross long is at 68670. We need to get back up above that particular level, or we could see a deeper pullback. But again, even investing in Bitcoin over the last 10 years, say $200 a month, and taking a long-term approach to this particular asset class, has clearly been a winner. Continuously trying to day trade this or sell into rallies has been very difficult, but buying on a dip has been the better play, and I do see a pretty bright future for Bitcoin.
Crude Oil
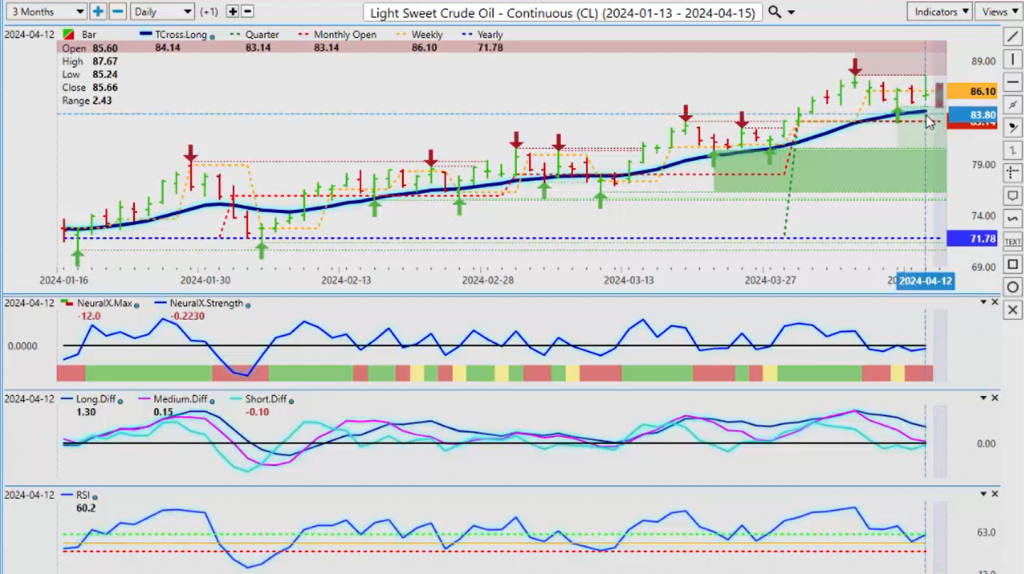
Now, when we look at Light Sweet Crude Oil, another main commodity, it’s still holding firm. The structural bias of this market, again the yearly opening price—current yearly opening price. No rolling performance models, guys. We don’t want to move the goalpost. We need to know how we’re doing in 2024, not in 2023. So, if I took a look at what we use seasonal patterns for—if I went back 365 days and measured that, then again, that would be a rolling performance. You can see that last year, oil took a tumble back into the $69 area and then rallied when it normally does at the beginning of the summer driving season. But in past years, usually around May, we start to see oil prices pick up. But for now, our T cross long, that’s coming in at 8414, we remain bullish while we’re above that. Our current monthly opening, again, we don’t want to go back 20, 30, 40, 50 random days. We want to set our anchor points at the beginning of April, the beginning of May, always at the start of the month, so we can measure what the performance is in the current month because that’s how we identify seasonal patterns using quantitative analysis, artificial intelligence, and neural networks. All of these things combine to tell us where we are. So in this case, our T cross long is above our monthly opening price, and we’re above our yearly opening price, so the quarterly opening price is a very important number for me in the second quarter, 8314. We want to hold above that to remain bullish on these particular oil contracts.
Euro versus U.S. Dollar
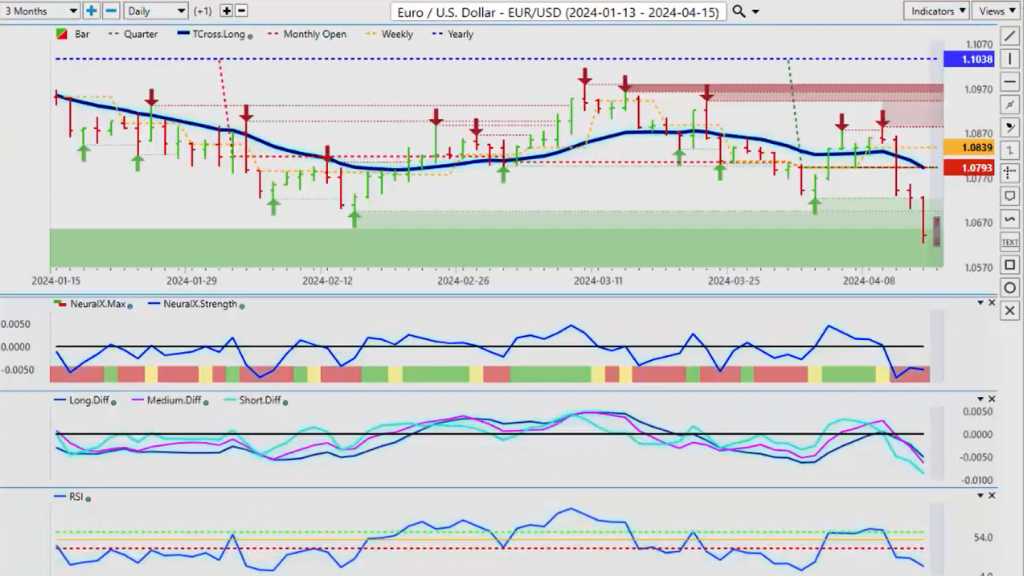
Now, when we look at some of our main Forex pairs here, the dollar is really putting some pressure on the Euro Currency. This has the highest inverse correlation to the Dollar Index. This particular pair would argue it’s about 99.29%—very, very strong inverse correlation, meaning the dollar up, the Euro down. So, the ECB certainly did nothing to help the Euro by suggesting they are gearing up for a rate cut in June. So that is likely to keep the Euro under pressure in the days and weeks ahead. But the Fed, I believe, will also start to talk about cuts as we get closer to May and June. I believe the CPI data is lagging, and it’s not worthy of putting all our eggs in one basket that inflation is hotter. We’ll have the retail sales out of the US, I believe, on Tuesday or Wednesday this coming week. That’ll shed more light into the economy. But for now, the Euro remains under pressure. We are getting a little out of fair value here, 16.7 on the predicted RSI, but that does not mean an overbought or oversold signal is something we ever want to trade off of. We want to trade off of momentum in the particular market. We can see with a split 60/40 split on the RSI that as soon as it broke the 40 level, the price accelerated, and there was follow-through here. Now, I believe we will retrace in our T cross long, 10794. Short survival as long as we’re below that particular level next week.
U.S. Dollar versus Swiss Franc
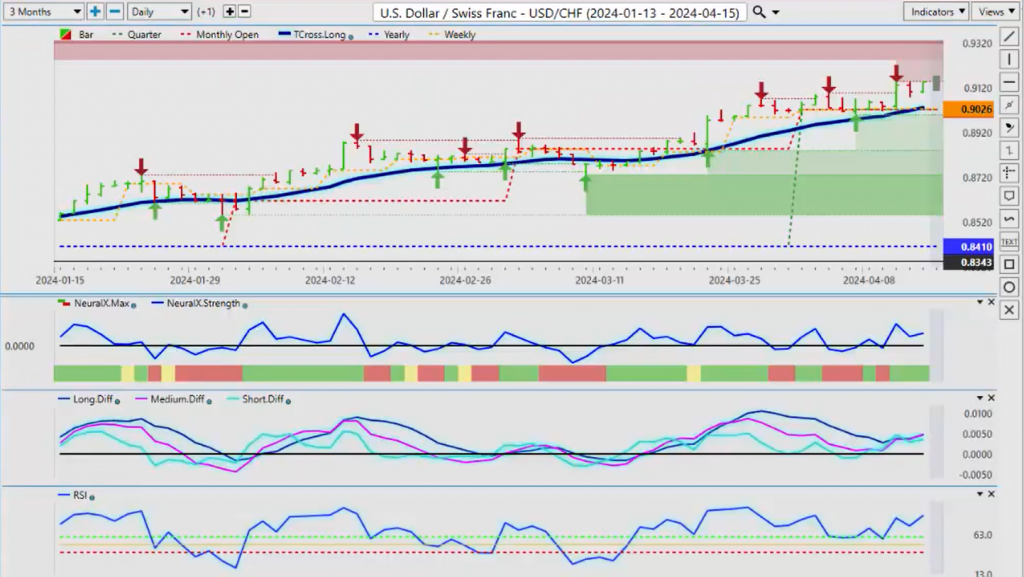
Now, the US-Swiss Franc, again, the Swiss Franc being one of the first banks to cut, that hurt them briefly. But as you can see, even with this significant dollar strength, this pair is stalling out at a newly formed, verified resistance high at 9148.
That’s the level we want to keep an eye on for next week. We are above our quarter, our current, our new quarterly opening price 9021. I would respectfully submit that we can set limit orders—sell limit orders—slightly below the 90 level, say 89.95. And when it breaks down below that, and we come into a period of dollar weakness, which I can almost guarantee you we will, in the months ahead, then once we trip below that quarter, the current quarterly opening, then that would tell us, okay, we’ve got shorts ready to go because ultimately the dollar is going to have periods of strength in 2024 and it’ll have significant periods of weakness. So, this is just yet another way to identify this. And the reason I’m saying that is the T cross long is at 9031, the quarterly opening at 9021—that’s where our key levels are, guys. So when it breaks down below those key levels, we’ve pre-identified them because again, this is an outlook, not a recap of something that happened in the past trading week. We’re looking forwards, not backwards. So again, a breakdown of the quarterly opening and the TCross long would tell me that we would have a very good short trade.
British Pound versus U.S. Dollar
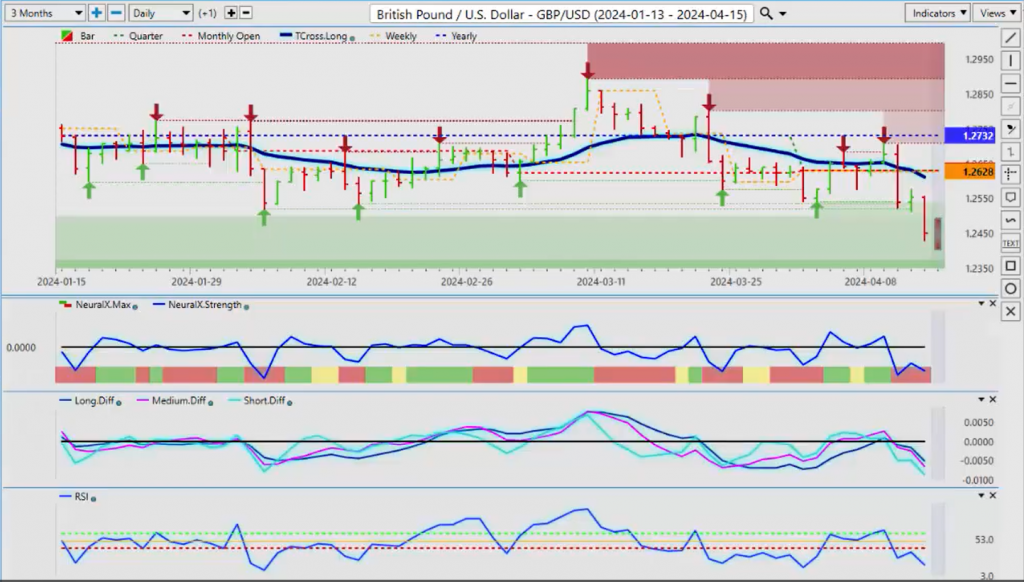
Now, the British Pound, again taking a hit with the Euro this week on that dollar strength. But like all things, there was a more or less a perfect storm last week—we’ve had the hotter CPI, slightly hawkish Fed, and Iran and Israeli conflict which is a risk-off scenario. Sinks the equity markets boost the dollar, boost Gold. So if nothing really transpires there, then traders or investors will be quick to leave the US dollar and go back into other asset classes—Bitcoin, they could stay in Gold, they would go back into some of your stocks and equity markets. So those are things we’ll keep an eye on. But the further we move away from the Vantage Point predicted moving average at 12613, the more likely it is we’re going to retrace to it. It has absolutely nothing to do with overbought Fibonacci bands, any of these things. This is a natural mean revision theory. This particular mean revision theory is very powerful because the quarterly opening price and the T cross long are virtually at the same level, 12631. So yes, if we get back above 12631, we will absolutely have a long trade that could be as early as Wednesday or Thursday of this week.
U.S. Dollar versus Japanese Yen
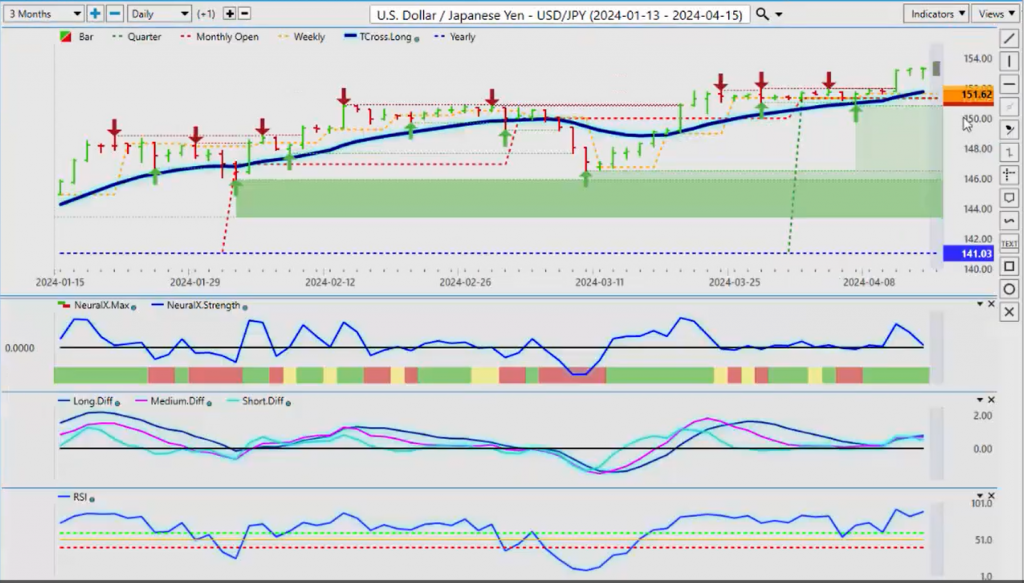
Now, the Dollar Yen, again, no love here for the Yen whatsoever, and the Bank of Japan really has created a mess for themselves this time because there’s just nobody willing to buy the Yen. The interest rate differential may not change now between the US interest rates, the Fed rates, and the Bank of Japan rates even though they broke ranks and hiked in the Bank of Japan, but not meaningful enough to change anything. So the carry trade, at least for now, is still on. But in most cases, when Gold strengthens significantly, there are two other currencies that also tend to strengthen: the Swiss Franc and the Japanese Yen. So be very cautious—it does look very bullish in this trade setup, but this reverse checkmark, the neural index strength, it shows green but inside the neural index it shows something very different, that it’s losing momentum in the last three trading days of last week. So if we put a draw a line right across the top of these three bars and we look at that neural index strength, it is picking up on that the inner markets that drive this pair, there could be a problem. So again, when we look at AI technology with neural networks, we can identify what the positive correlations are, but if the Yen sinks, then these inverse correlations will be the ones that will shine, they will start to move higher. So again, positive correlation of course is the Dollar Index, there’s an 83.8% positive correlation between the Dollar Yen and the Dollar Index. So if the Dollar Index sinks, Dollar Yen could go down with it.
We can see a number of other Forex pairs here also, but a point to look at here too is Cummin CPI 82.84% positively correlated to the Dollar Index as is Viper Energy Partners at 82, but at the top of that list, Singapore Yen Japanese Dollar 96.8%. So again, guys, when we look at a science-based type of trading with using intermarkets to gauge—well maybe I don’t want to trade the Dollar Yen, maybe I’ll go trade one of those other pairs, maybe I’ll trade a stock instead. That is the primary basis of intermarket technical analysis because again, standard technical analysis has not changed much in a hundred years; intermarket technical analysis using what I’ve shown you here today, intermarket correlations, positive inverse correlations—this is the science of what’s really behind the scenes where the institutional money is looking to buy and sell things.
U.S. Dollar versus Canadian Dollar
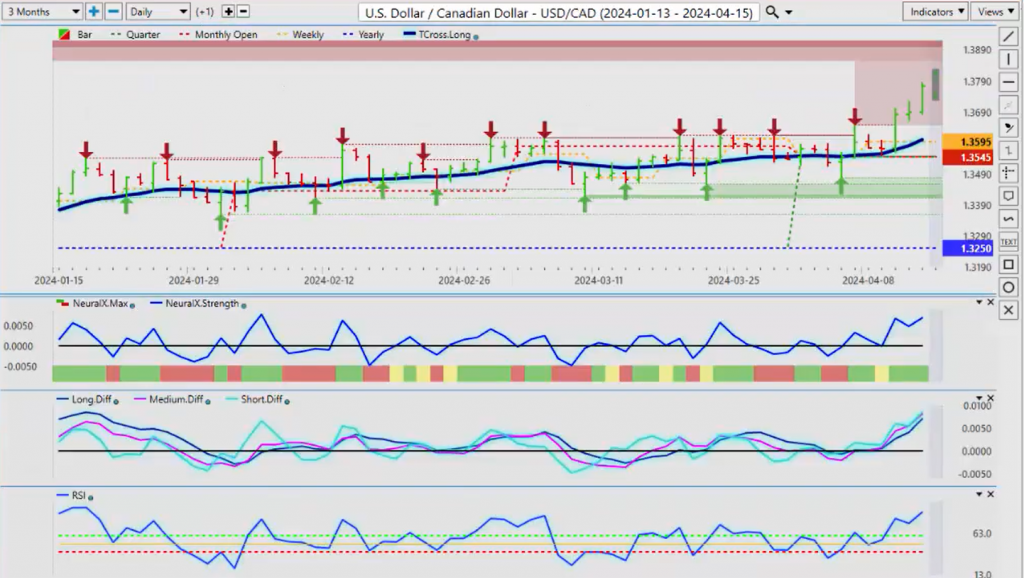
So, very powerful tools when we look at the US-Canadian pair again, in a risk-off scenario with Equity Market sinking, the correlate—there’s a very strong positive correlation between the equity markets and the Canadian dollar, not just oil. And as the equity markets sank, the Canadian dollar did also, and the US dollar strengthened, pushing this higher. I believe we will have a good short on this pair coming up in the not-too-distant future, but we need the equity markets recovering. Our retracement point here, quarterly opening price 13545. I can see us retracing back to that level in the next two or three weeks, but maybe sooner if everything between Iran and Israel and Palestine starts to calm down. The equity market, people move out of the VIX back into the equity markets; that would trigger shorts on here, guys, and most technical indicators will not pick that up—the intermarkets will drive this. So watch your oil prices, watch your S&P 500; if they are recovering and moving up, then US-Canada will be moving down. I could make the same argument here for the Aussie and the New Zealand.
Australian Dollar versus U.S. Dollar
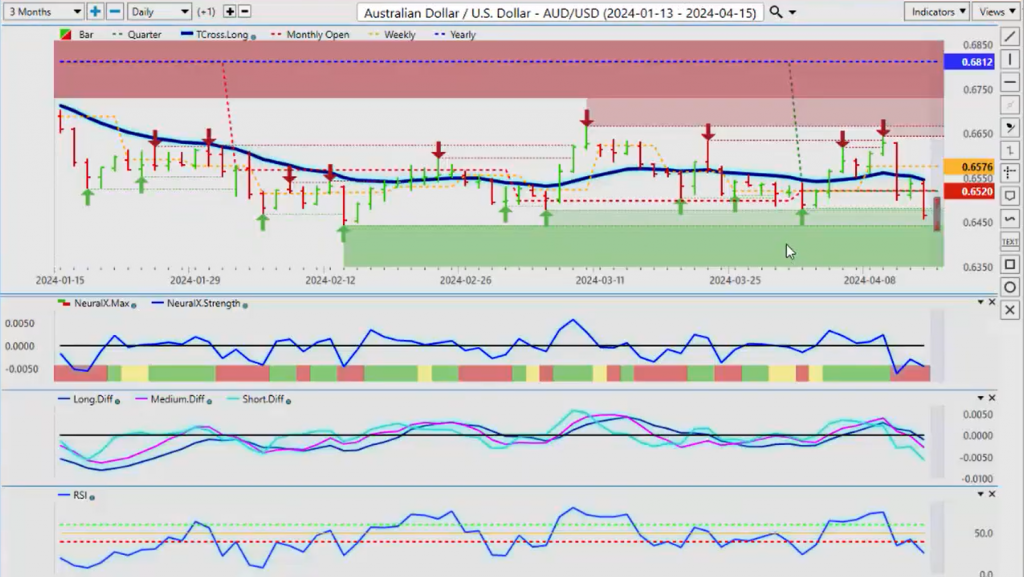
Now, the Aussie is surprisingly, every time it tries to recover towards this 6650 area, it immediately something drives it lower. But structurally speaking, we’re below the yearly opening price; our new quarterly opening price 6520, critical area, guys. We have to get above this level and stay above this level. When we do that, we’re going to have a good long trade back up to the 68 level, but we’re just not there yet. We need things to settle down in the Middle East a little bit, gold prices in the dollar calming down a little bit; that’s likely towards the end of April.
New Zealand Dollar versus U.S. Dollar
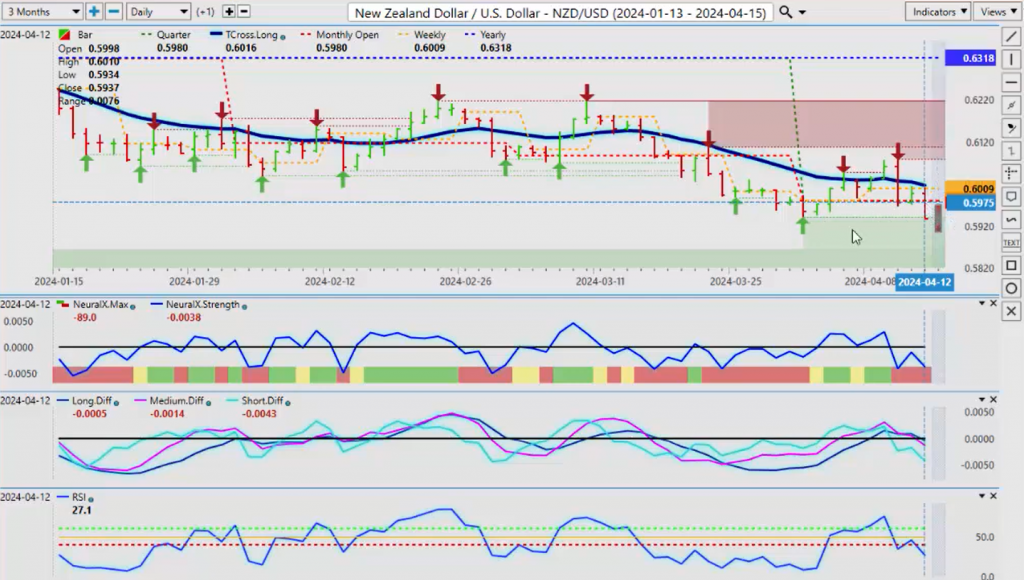
So again, keep an eye out for potential longs, and the New Zealand is no different. You can see structurally it’s not very sound here at all, but we do have a verified support low, and that’s coming in at 5940. So watch this level; we basically closed on that on Friday, 5937. So be careful of a bear trap here, is what I would suggest because if things settle and the S&P, the NASDAQ, the Dow Jones, Nikkei, DAX 30—if they start all rebounding higher, then the Aussie, the New Zealand, and the CAD will follow that rebound very quickly. So expect another choppy week, but with this choppiness, there is opportunity. So, with that said, this is the Vantage Point AI Market Outlook for the week of April the 15th, 2024.


