


VantagePoint AI Market Outlook for the Week of April 5, 2021
VIDEO TRANSCRIPT
U.S. Dollar Index
Hello, everyone, and welcome back. My name is Greg Firman, and this is the VantagePoint AI Market Outlook for the week of April the 5th, 2021. Now, to get started this week, we’re going to begin where we always do with that very important U.S. Dollar index. Now, what we’re looking at here for the dollar, a quick review I think is required here, going back to what I’ve stated into the very beginning of January, that we’re looking for dollar strength that predominantly, that’s what we’re getting in 2021. There’s a number of different reasons for that.
We’ve got the COVID is starting to back off a little bit in the U.S. with the vaccines, et cetera, but essentially, when we look at this, we can see that the dollar is for the most part moving higher. We’ve had 37 up days versus 27 down days. You can see we’ve been below the yearly opening price for a mere four days, but above the yearly opening price for 61 days, so when we’re talking about equity curves, things of this nature, we need to understand what that terminology actually means. When we look at a basic chart, using things, some of the conventional tools, stochastics, Elliott Wave, this kind of things, they very often don’t tell the trader what they need to see. Now, when we look at the dollar from the yearly opening price back on January the 5th, January the 6th, the dollar’s up about 3.85%.

For a currency, that’s excellent. That’s a very strong move. On a single currency contract, that’s $3,460 on the future side. Now, if we look a little bit closer on that and we actually look at the real equity curve of what’s been going on, as I’ve stated very clearly from January 1st, that there’s a cycle that happens in this dollar more often than not, but predominantly, the dollar is its strongest in the first quarter. We can see the dollar goes up at the beginning of the month, then after the nonfarm payroll, it goes down, so this is actually a very smooth equity curve compared to say the S&P 500. If we look at the S&P 500, there’s been some very choppy, volatile moves above the yearly opening price, but what we need to understand in our trading.
By the way, if we look at this, following what I had suggested, that we’re buying into the end of the month into the first week of the new month, then the dollar sells off, then it goes back up again, then it sells off, it follows a very clear pattern, but even if we just look at the standard predicted moving average, it continues to make new highs, so again, the dollar is predominantly bullish and it has predominantly gone up so far in this calendar year, but even just a single contract, buying that on January 1st, we’re going from the, basically the yearly opening price around 89.90, all the way up to the high of 93.27. 93.47 this past week. A very, very strong move, but we also have reference points here, guys. To understand equity curves, as I’ve stated very clearly from day one, nothing goes straight up and nothing goes straight down, but by defining the predominant move and when that’s happening, that’s how we determine these types of curves. Again, the dollar has come back to its yearly opening price five times, thanks to the fed, trying to kill the dollars, saying they’re not going to raise interest rates.
I had stated then that the market is unlikely to believe what the fed is saying, that they’re not going to raise rates until 2023. There’s clear inflation signs already showing. Using that yearly opening price, again, as a reference point, then this is what’s called buying on a dip, guys. It’s pretty straightforward. When the market comes down, we’re holding above the yearly opening price, and again, we’ve been above this for 61 days. We’ve only been below the yearly opening price for four days, and that was in the very first week of trading, so again, when I say that the dollar is pretty much just gone up, for the most part, that’s entirely accurate.
It can be spun different ways, looking at conventional standard charts like Elliott Wave, but the trader often can’t see what’s actually happening in the market, and that is a very important thing to monitor, because again, it’s indisputable, something has happened. There’s been a number of papers written on this, going to we’ve got countries settling their trade balances, we’ve got institutional funds that are required to buy dollars for pension funds. There’s a number of different reasons, guys, but the main thing is we identify the patterns, and then we use it, the yearly opening price as a reference point to guide us. Right now, as I had stated in last week’s weekly outlook, I clearly defined the problem areas, where the dollar is going to struggle, and that’s at the swing highs, the VantagePoint verified resistance. That’s coming in at 93.11.
You can see the dollar backing off away from this, so if we combine that resistance area with the actual equity curves that are going on here, when to buy the dollar and when to sell it, this again points towards dollar weakness. I had stated very, very clearly from January 1, technically, going back to January 1 10 years ago, I’d been talking about this, that after the nonfarm payroll number, no matter how good that number is, usually within a matter of days after that, on the Tuesday or the Wednesday, the dollar’s selling off again, because real dollar demand of those institutions requiring to buy dollars, it dries up. We can see the dollar is struggling to hold above the level that was pre-identified last week, because again, this is an outlook, guys. This is not a five-minute trading video or on Monday, buy here, buy there. There’s no recommendation being made to buy or sell anything here, only identifying patterns in the market and how to implement the VantagePoint software indicators, both their trend indicators and their contrarian indicators.
The medium-term crossing the long-term predicted difference, you can see that it’s been a dominant factor here when the dollar is going to turn, whether it be on the upside or the downside. Highly accurate. Again, nothing is perfect here. It’s simply identified, again, using the predicted RSI also and the neural index. We’re losing momentum around this verified resistance level, and again, coming in at or about the 93.11 mark, so when we look at this a little bit closer, understanding what the VantagePoint software, the market is predominantly bullish, well above the T cross long.
That T cross long is 92.37. I would absolutely anticipate we will come down and get close and test that level next week because this is the pattern we’ve seen. We’ve had a blowout payroll number. I think 900 and some odd thousand jobs, a very good number, but I’ve seen numbers even better than that, and the dollar’s still tanked after the, within 48 hours of that, the Monday, Tuesday, Wednesday of the following week after the payroll number. We’ve also got the fed minutes coming up next week.
That’s going to be another very, very interesting minutes to see, because again, the fed often says one thing in the announcement, and then the minutes often state something very different. Now, when we click on our F8, we can see that we’re starting to challenge this long predicted. This long predicted tells me again, whether the market is primarily in the shorter period time frame, whether it’s bullish or bearish, so we’re struggling to hold above this level, that level coming in at 92.86. Once we break down below that level, that will confirm the actual dollar cycle that it’s likely going to come under selling pressure. It doesn’t mean that the overall uptrend is over.
Nobody’s saying that. What we’re saying is, is that nothing goes straight up and nothing goes straight down, and when real dollar demand dries up, usually it slips lower. It may only be for a couple of, probably will be for a couple of weeks, sideways chop to a downward bias. Then, at the end of April, it starts the same thing all over again. It starts to strengthen near the end of the month when those institutions need to buy, so hopefully it clarifies that.
Gold

Now, when we look at that and do a comparative analysis to gold, the gold also tells us that the dollar has predominantly been very strong in 2021. Gold, the yearly opening price there, 1904. We are unable to break above this VantagePoint T cross long. I had mentioned last week, in last week’s weekly outlook, that I don’t think that this is going to go on much longer because it’s too easy of a trade selling into this level every single year. The main reason we’re selling into this level is because the dollar is strong.
You’ve got that inverse correlation between gold and the dollar index. Now, gold could get a little bit of a bump next week if we’re correct and that institutional money dries up and they’re no longer willing to buy or need to buy dollars, so then, gold could get a little bit of a boost, but I still think that that’s very, very unlikely. Bitcoin is gold’s nemesis, as I said last week. That’s the one you have to watch. Money is going, fighting inflation, not with gold, but with Bitcoin. The charts are clearly showing us that.
Now, that key level now is 1731. We want to watch that very carefully to see if we can get a little bit of a boost, but I’m still not a long-term, or even a medium-term buyer of gold, only pretty much a seller. Now, again, if we look at the S&P 500, we just draw a little bit of a line here. We go down here around … I think at the yearly opening price just for fun, we’ll look at that here too, because it’s a good compare when we start talking about equity curves and these kinds of things.
S&P 500 Index

The S&P 500 is mainly like, not as the same as the dollar, but we know that there’s a correlation there. The S&P 500, this is a very nasty, little pullbacks, but that, again, is what’s called, referred to as a buy-on dip. Is the equity curve smooth? No, but does that mean we don’t buy it? Of course not.
Of course, we buy this, because the S&P has been very, very strong in, basically for the last, well, more years than I care to mention, but particularly strong the last two or three. 2021 is very different. Not any different, excuse me. We’re still making all these new highs, yes. We have a snap pullback.
The one thing you want to understand that very seldomly in any market, do you have a nice, smooth, calm equity curve? Trading doesn’t work that way, guys. This is what you have in the major markets with the dollar index, with gold, the S&P 500.
Bitcoin
Bitcoin has been chopping all over the place, but it’s still predominantly gone up, so we’re looking for this to buy on dips. Places to buy on dips for next week, 3939.

That’s our T cross long. We’re long, well above that particular level. If we click on our F8, we look at that key pivot area, and we’ve got 3973. Now, there was a lot of April fools jokes going around this week. I thought it was kind of funny, that S&P 500, 4,000, but I guess it wasn’t an April fools joke, was it?
It took a big snap higher, so again, I don’t know if we’re going to have a lot of upside potential here, but once again, when we look at that medium-term crossing the long-term predicted difference, measuring two different trends at the same time, we can clearly see, and again, using that predicted moving average as a pivot area, very, very nice move to the upside, but whether we’re going to continue to move up this aggressively, looking forward, again as an outlook for the entire week, this is a five-day outlook, not a one-day outlook, okay, so when we talk about we’ve got a signal here, we’ve got a signal progressing, that’s called trade analysis here, guys. What it means is that we’re understanding where the key levels are and how to respond to them if we come to them. Right now, longs are clearly favored here, but even at this level, you can expect some more of this choppiness because the higher it goes, the deeper the pullbacks are going to be, so again, watch that level, 3973. Now, as we look at, again, one of my favorites here, which is, of course, Bitcoin and anything related to Bitcoin, really is making a lot of money. Bitcoin investment trust, I’ve talked about that one over the weeks.
Very good one, but most anything related to stocks, and that is coming off of Bitcoin versus the U.S. Dollar. Now, the one thing I’ve found very interesting last week, confirming gold’s weakness is the U.S. Dollar strengthened last week and wiped up with the field. Bitcoin ignored that U.S. Dollar strength, that continued to hold its gains. Once again, when we look at that medium-term crossing the long-term predicted difference, the same thing that would put us into a trade is the same thing that would take us out, so if the medium-term crosses down and we get a signal to sell, then that means we’re going to move into a corrective phase lower. Those bottom levels are 56521. We would look for that area to hold.
Once again, if we click on our F8, you can see all the market is just hugging this every single day. It bounces off this blue line. Every one of these days is a long trade, using that blue line as a pivot area, the long predicted moving average. Again, for next week, the same thing could be said, if it cannot hold onto these gains, because again, this outlook is being done on a Saturday. The markets are closed.
It’s a predictive outlook, so if I look at this, I can say, “Well, if Bitcoin is going to hold its gains, it needs to continue to close above 58,000.” If we start closing below this blue line two days in a row, we get our medium-term cross, then we could see a deeper corrective move on Bitcoin, but that doesn’t mean we don’t buy it. You can see the choppiness here on this thing too, but again, there’s very seldomly. I can’t think of any market where it’s just a nice, smooth curve where something just goes straight up or straight down. That’s non-existent.
Crude Oil

Part of trading is understanding the volatility and where that volatility is coming from, and more specifically, when is that volatility coming? Now, again, if we look at, continuing on with our outlook, looking at the major markets, we would also have a quick look at oil to monitor that, because once again, oil is still a major player. When we look at oil going into next week, we’re trying to get a little bump above that VantagePoint T cross long. We do have a verified resistance that’s formed here, but I think that if the equity markets continue to advance, then oil could also, but we must continue to close above the T cross long if a new long trend is forming, but again, if we look at our verified support level, that’s coming in right now, down at 57.25. We’ve got our medium-term crossing our long-term predicted difference, which is taking us higher, but then, we identify the problem area, which is 61.16, so for next week, we’re looking to hold above that particular level if this has any chance of advancing higher.
Euro Versus U.S. Dollar

Now, with our main Forex pairs, once again, Euro/U.S., you can see that if we take our yearly opening price and we draw that onto our screen also, we understand whether something is truly bullish or truly bearish, so this particular high right here, 1.2243 is approximately the yearly opening price. Again, the Euro, which represents this is the highest correlation to the dollar index, is the Euro makes up the bulk of the dollar index, so if we understand what the dollar index is doing and when it’s doing it, we know exactly when to buy and sell Euro/U.S. and when not to. Right now, we do have a verified support low, forming down here at 1.1704. They’re going to try and run this probably at the beginning of the week to create the illusion that the dollar is still very strong, but in fact, it’s highly likely that institutional buying has dried up, or it’s getting very close to drying up, so that would tell us that the Euro is going to correct higher. We have confirmation of that, the medium-term crossing the long-term predicted difference.
We pushed a little bit lower in holiday thin markets, but again, I would anticipate we will come back up and check, at least test the 1.1843 area. Now, if we click on our F8, we look at … This level here is very important because it gets us closer to price, 1.1767. If we can hold above this level next week, guys, a long trade is clear, clearly coming here. It’s not a long-term necessarily a trade because this isn’t a long-term outlook.
It’s a five-day outlook, so let’s not confuse that. If we can close above this level, we close above it for two days in a row, then we’re likely heading back towards that 1.1850, 1.19 level. That’s a strong possibility. The fed minutes will probably further cool off the dollar, so again, looking at these indicators, we don’t have a lot of upward momentum here, but if you’re trading this pair, you’re watching gold contracts for strength and you’re watching the dollar index contracts for weakness. That’s how we play this.
British Pound Versus U.S. Dollar
Now, with the Pound/Dollar for next week, once again, if we’re looking at places of value to sell U.S. Dollars next week based around that cycle, then the Pound/Dollar would still be one of those places.

Once again, as I mentioned in last week’s weekly outlook, we’ve got our medium-term crossing our long-term predicted difference, suggesting that the Pound is getting ready to move higher. We just have to get through these obstacles right here around the 1.3829 area, and we should be good to go. Now, again, if we click on our F8, you can see that this signal actually started back here. In my view, this is the real signal, back here. I don’t care about the market going up and down.
That is not an equity curve by any stretch of the imagination. That’s just normal day-to-day chop with the Bank of England, with the announcements coming out of the U.S.. It’s just chopping back and forth, but it’s during a period of known dollar strength, right? Next week is not a period of known dollar strength, it’s a buy … Again, if we come back and look at this chart, we can see it’s actually a period of known dollar weakness, so we would look at that and say, “Okay. Well, if we look at our key pivot area, that key pivot area, that’s coming in at or about the 1.3811 area,” so if we can hold above that level or if we’re staying above this level by Tuesday or Wednesday, because remember, Monday is a bank holiday in a lot of countries, in the U.K. and in Canada, I believe in the U.S., so we …
Most price reverses from Monday to Tuesday, so Tuesday next week is the new Monday. Wednesday, we’re going to see our real price. If we’re holding above 1.3811, then clearly longs are favored here as our RSI is in a good position, suggesting we’ve got momentum building predicted differences, moving above the zero line and a positive neural index. That’s what we’re looking for. Now, during the last several months, I’ve also talked about the places where we buy dollars and the higher percentage places to buy dollars and sell them.
You’ve got a group A and a group B currency.
U.S. Dollar Versus Japanese Yen
The group A currency is going to be Dollar/Yen. U.S./Swiss Franc and shorting Euro/U.S.. These are high-value places to buy dollars, where the other equity-based currencies, the Aussie, New Zealand and CAD are not the best place at, really, at any time, if the S&P 500 is going up, so when we look much closer at this, we’re a fair distance from our T cross long, 109.24. Usually, the further we move away from that level, the more likely it is we’re going to retrace to it, so when I look at that, I bring in my F8 to help guide me through this or get my key level, 110.19.

We’re still long, well above that area, but as you can see, that pink line is crossing the blue line, the medium-term crossing the long-term predicted difference. If we get the neural index turning red, then this could be a place of value during a known period of dollar weakness to actually short the dollar here, but I still say the Yen is weaker, but the Yen will strengthen if gold contracts break through that [17.40 00:20:46] level, so keep a close eye on gold here too, because another way I could say this, guys, is you have three currencies that have a high correlation to gold, the Swiss Franc, the Yen and the Euro. If gold does push higher, it’s going to take those currencies with them, so keep that in mind. Now, when we look at the Canadian Dollar going to next week, once again, this is an equity-based currency. The Canadian Dollar is like the Aussie and the New Zealand.
U.S. Dollar Versus Canadian Dollar
It really is following the S&P 500, so shorts next week are favored with the Canadian Dollar, our T cross long, 1.2568. You can see we’ve got this week, this past week form, the medium-term crossing the long-term predicted difference, just above a previous verified resistance zone or a swing high, so this points to weakness in the U.S. Dollar against the Canadian, so shorts carry the edge clearly for next week. A starting point, 1.2570, but we need to hold below here. My only concern to start the week is this reverse check mark or the fact that the RSI failed exactly on the 40 level, so I’m looking for a breakdown below 40 to confirm this. Case and point, right here.
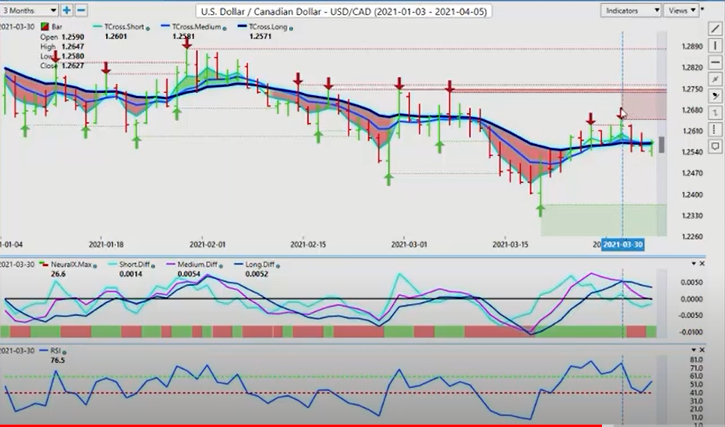
Last month, you can see, or at the beginning of … Well, yeah, that’s last month, sorry. You break down, right here, below the predicted moving average. There’s two-day rule is met. We’ve broken below here two days in a row.
Our medium-term crossing our long-term predicted difference. That sends it lower, but again, the same thing that had us go short then had us turn around and start buying this, the medium-term crossing the long-term to the upside. All we’re doing, when you’re talking about how markets move, market profiles, this is what you look for, is these contrarian signals to get into the market earlier based around known periods of dollar strength and weakness. This is how we piece this market together, right? When we look at longer term charts, Elliott Wave, some of these different indicators, they’re very misleading in a lot of cases. They tell the trader part of the picture, not the whole picture, and the smaller moves aren’t that small.
They usually go on for five, six, seven, eight days, all usually more or less than one direction, so if the S&P continues to advance, the U.S./Canadian pair will move lower. Same thing will happen with the Aussie. The Aussie will move higher. You can see once again, we’ve got a signal here, and you’ll remember what I’ve repeatedly said on these outlooks. The worst thing about the medium-term crossing the long-term predicted difference is that it’s always early, but so if nothing else, it’s warning us not to sell down here in this lower area. There’s false breaks all over the place here, so try and keep that into perspective here.
Australian Dollar Versus Canadian Dollar
For now, we’re looking for the Aussie to potentially reverse higher next week because this is what this pair does. We need stocks moving higher. The same thing would apply to New Zealand. It’s virtually the same currency. We’ve got heavy support buildings, so the first thing we do is we identify support.

New Zealand Versus U.S. Dollar
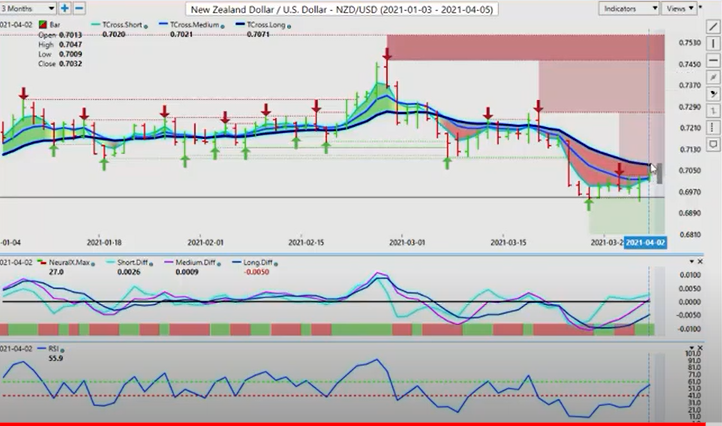
The low is 0.6943. We’re long well above that level. We’ve got our medium-term crossing our long-term predicted difference to the upside, which is contrarian to the signal here because we’re below the T cross long, so if nothing else here, guys, we are likely to move towards 0.7071. Then, once we get to this predicted moving average, we make the decision whether we want to stay long or whether we want to close out and go short, but that could be days from now, because again, this is a five-day outlook. It’s not a five-minute trading video or buy on this here, sell there.
It’s a scope of what is likely going to happen for a five-day period, and then we stop and do it all over again next Saturday. With that said, this is the VantagePoint AI Market Outlook for the week of April the 5th, 2021.
Are you using A.I. yet?


