Welcome to the Artificial Intelligence Outlook for Forex trading.
VIDEO TRANSCRIPT
Okay, hello everyone, and welcome back. My name is Greg Firman, and this is the Vantage Point AI Market Outlook for the week of April the 8th, 2024.
U.S. Dollar Index
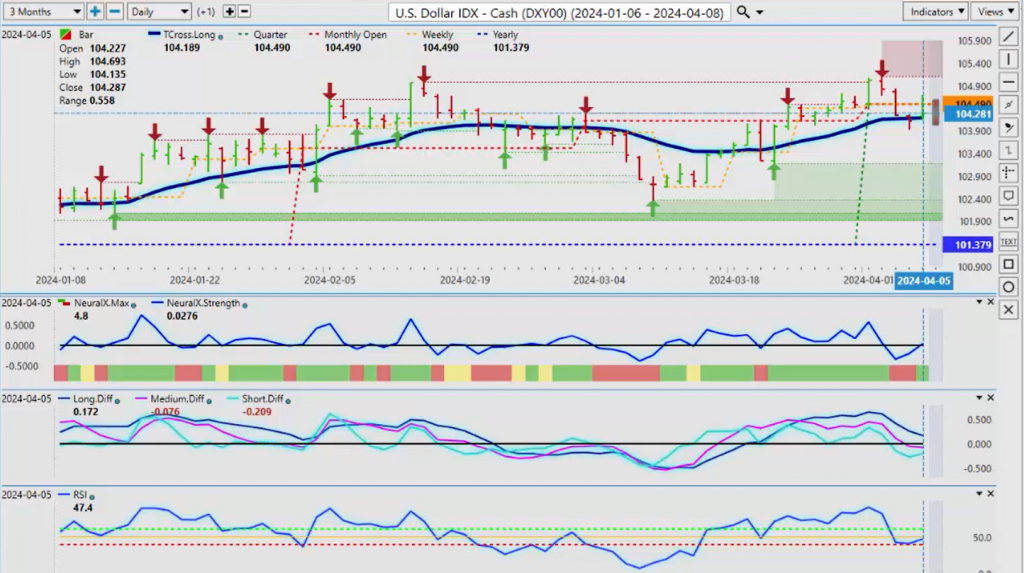
Now, to get started this week, we’ll begin with the Dollar Index. Now, the Dollar has recovered to some degree, but we are starting a new quarter. We want to make sure we’re watching that quarterly opening price very, very closely, 104.49. Again, we need to get back up above that for the Dollar to remain strong. Now, the indicators here are very mixed. We do have a medium-term crossover to the downside, the long-term predicted difference is pointing down, but the position of the predicted RSI is basically bouncing off the 40 level, so it’s not showing a lot of immediate downside pressure. But, I will say, the unemployment data out of the US is highly questionable. Again, the U6 number moving higher, there’s a number of components, the number of government jobs, so questionable how strong that labor report really is. But for now, we can see we do have some strength, but I would be very cautious around Tuesday, Wednesday of next week because, in most cases, the Dollar sells off the week after the non-farm payroll number, regardless of what that number is.
S&P 500 Index
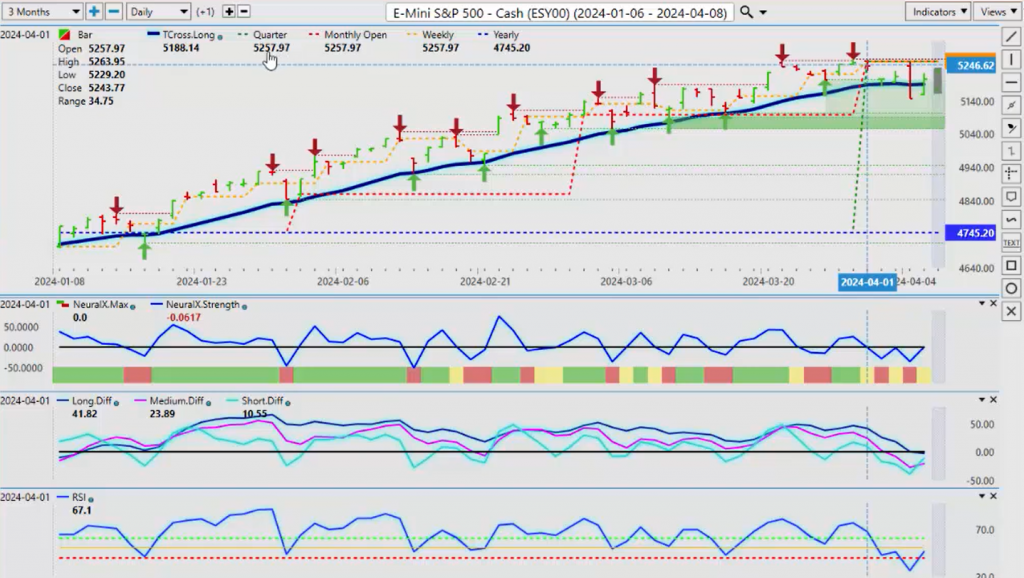
Now, when we look at stocks, we can see our new quarterly opening price that’s going to come in at 5257. For stocks to remain bullish, we have to get back up above this level to maintain this upside momentum. The indicators here are mixed, but there is some sign of life here in the stock market that the rally is not over yet. Watch for a push to the downside on Sunday and early Monday, and a reversal back to the upside on potentially Tuesday or Wednesday. But these levels are well defined: our T Cross Long 5198, we must stay above that to keep the pressure on the upside, and inevitably, we need to break above 5257 to confirm that there’s further upside in the stock market.
DAX
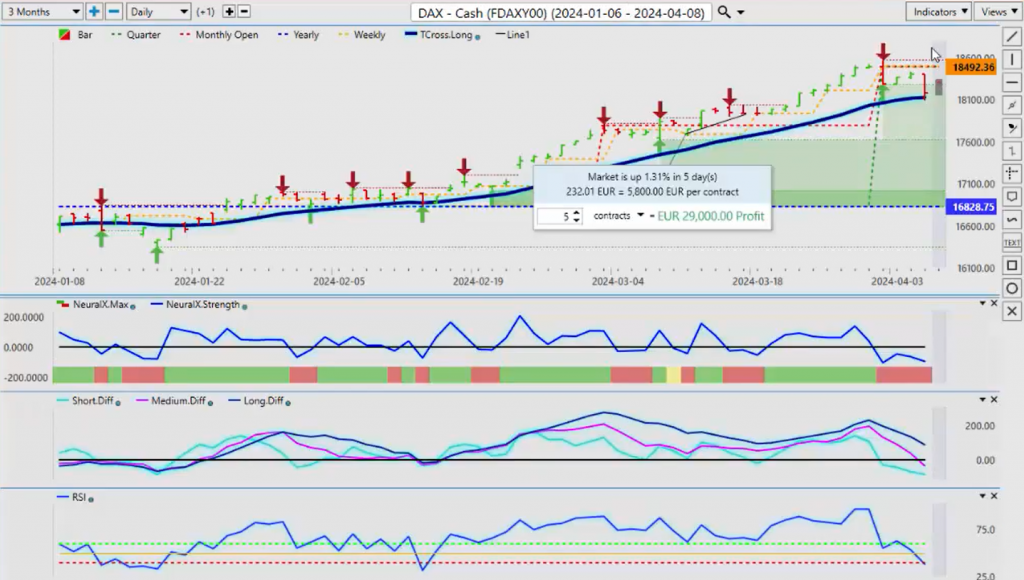
Now, if we look at the European Equity markets, once again, we can see here, excuse me, let’s just remove that, once again following the S&P 500, the new quarterly opening price on the DAX is coming in at 18,492.36. So, we’ve got to get back up above this level. I don’t think we’re going to get above it immediately, but for now, our T Cross Long 18,1125, indicators are definitely bearish. Now, this one looks like we’ve got momentum building to the downside. This would indirectly point towards the potential for Euro strength because, in most cases, either the country’s stock market is strong or their currency is strong. So, this tells me that again, the Euro, the Dollar is nowhere near as strong as what it appears to be, and the Euro could be getting ready for a rally.
Gold
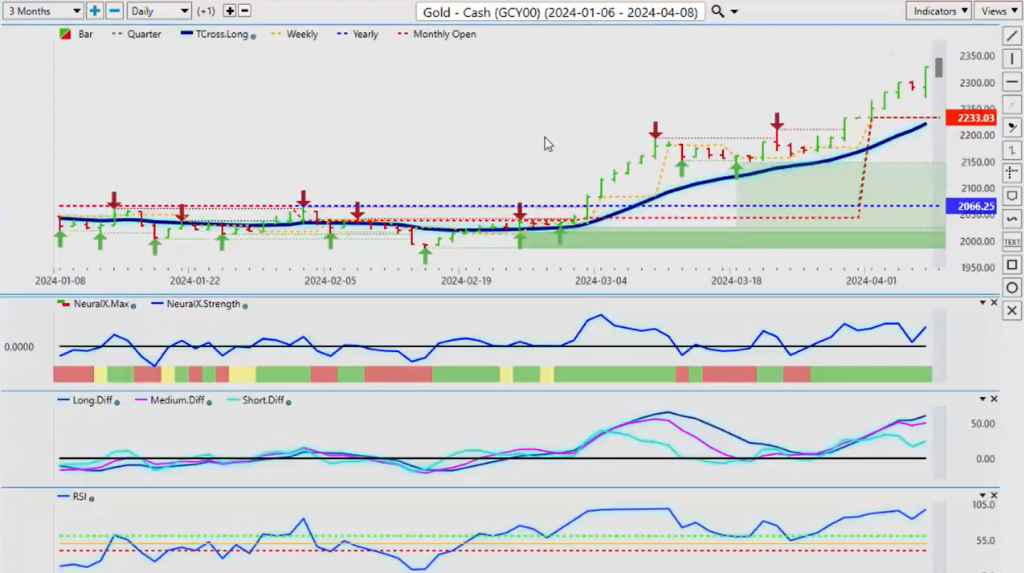
Now, gold prices, again, making all-time new highs here, but the further up we move, the more likely it is going to be for a retracement. The retracement point here, the T Cross Long 2221, is our T Cross Long, and 2233 our quarterly opening price. These are critical support levels for gold. But ultimately, probably by the end of April, gold will start pushing lower as we come out of this seasonal pattern. But again, we’ll monitor things from a week-to-week basis. There are signs of weakness on the predicted differences.
But in most cases, gold is strong in the month of April, and this continues to point to further strength, but it’s still interest rate based. The market believes that the Fed is going to cut, but the Fed is not really saying that, so we want to be cautious with longs up here because it could be short-lived. Because in most cases, gold basically caps at the end of April, mid-May. So again, I would be very, very cautious with longs up at this particular level.
Light Sweet Crude Oil
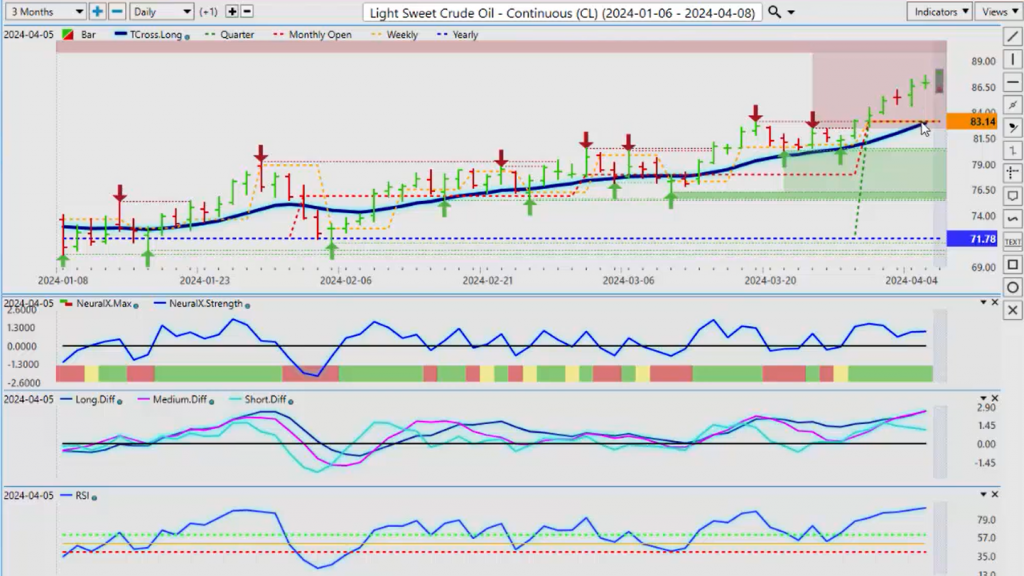
Now, light sweet crude oil, starting off the second quarter here, pretty bullish. We’re above our T Cross Long, but the T Cross Long is intersecting with the quarterly opening price at 83.14, so that’s our retracement point. Not Fibonacci or bands or channels, we’re looking at hard anchor points that we can see that are more objective than subjective. So, the T Cross Long, all our support is sitting there. A premium long would be down around that area. We’ve got a bit of a gap to fill, in my respectful opinion. If we click on our Vantage Point Long Predicted, then we can get an additional support level, and that would be coming in at 85.53.
Bitcoin
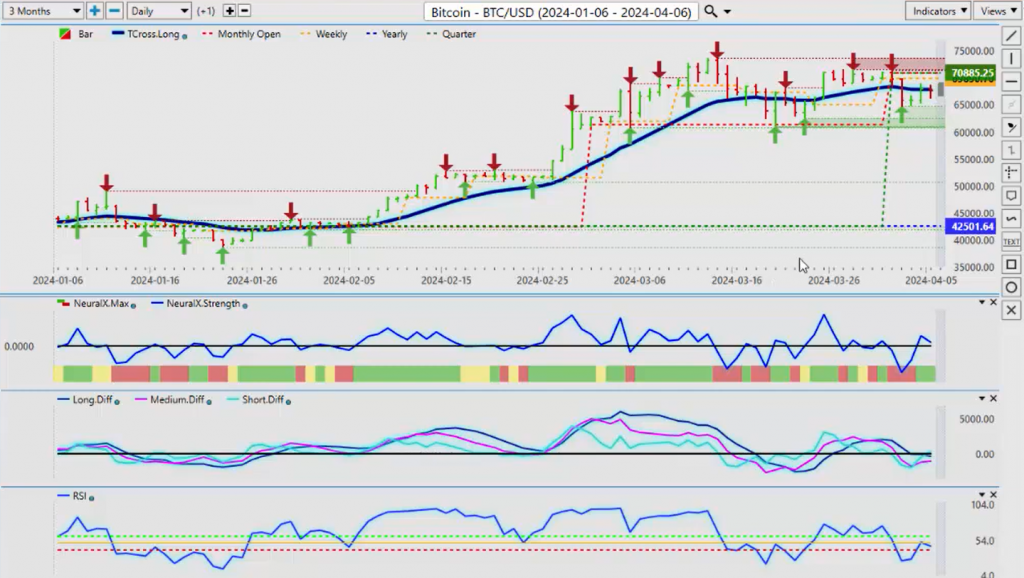
Now, when we look at Bitcoin, Bitcoin starting to recover yet again. We have a newly formed verified support low 64,644. That will be our immediate support, but as you can see, it’s blocked from moving higher because of the Vantage Point T Cross Long that’s coming in at 67,838. That’s the level we want to overtake, but I think it’s going to take a little bit of time here. I don’t think we’re going to see a massive selloff in Bitcoin, but we are likely to see some downside pressure until we get ready for the next leg up. But towards month-end, I anticipate Bitcoin will push through these resistance areas and start to move towards that 80,000-90,000 mark. But again, things can change very quickly in these markets, but if we’re going to get that kind of move in Bitcoin, we’re probably a few weeks away from it just yet.
Volatility Index ($VIX)
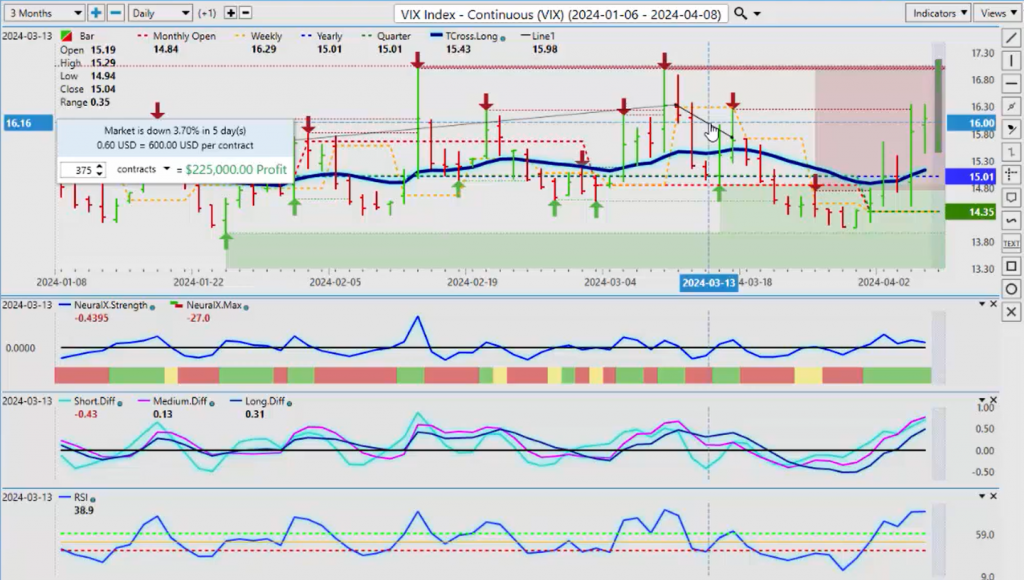
Now, when we look at the VIX, going into next week, the VIX is showing signs of life here. And once again, this was inevitable, in my respectful opinion, but the question is, can it maintain? Can the equities remain soft? So, the VIX, we’ve pushed through the yearly opening price, the quarterly opening price, this VIX is actually quite bullish. Our T Cross Long is now coming in at 15.13, that would be our buy area. But once again, be careful, we’re at 86.2 on the predicted RSI. That’s not overly concerning. What is concerning is this verified resistance high at 16.25 and this massive somewhat of a double top up here at $16.99. But right now, I think it’s inevitable that we’re going to hit that particular level, and it could be as early as Monday, Tuesday. So once again, the indicators do remain bullish here, but be cautious again, because I think the market may be misinterpreting some of the key components in that labor report, more specifically, that U6 number continues to be concerning because it’s not consistent with the U3 number or a number of other components inside that jobs report.
Euro versus U.S. Dollar
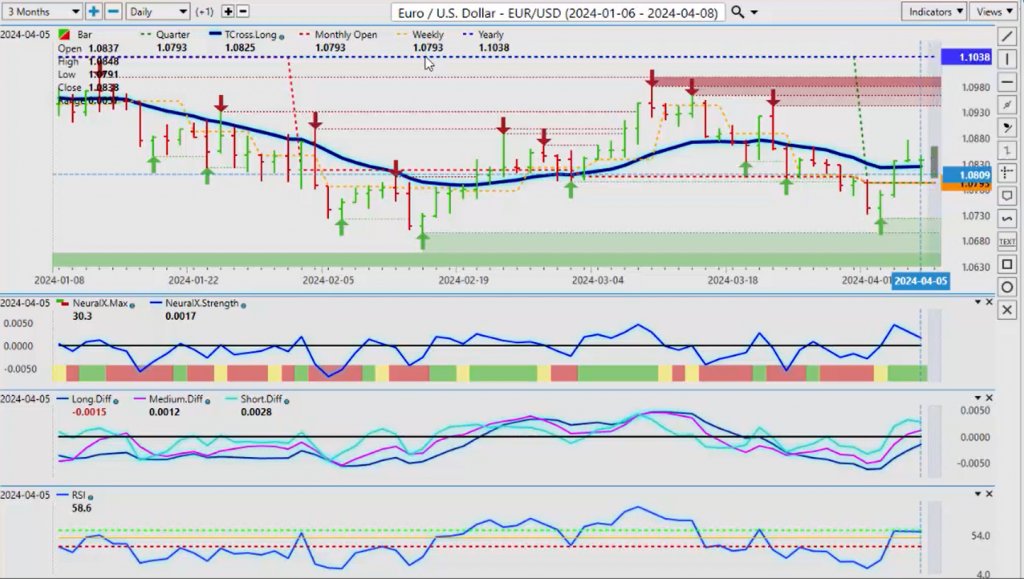
Now, as we go into some of our Forex pairs for next week, most eyes are going to be on Euro/USD. That’s your big pair. So, the Euro is starting the quarter off bullish. That quarterly opening price, that’s going to be at 1.0793. That’s our support. Then we’ve got our T Cross Long 1.0825. The indicators here are turning bullish, but you can see the predicted RSI using a 60/40 split, meaning that if we’ve got momentum, then it would look something like this over here. We fail at the 50 level, we break the 60, we’re above our T Cross Long, and at that time, also above the current monthly opening price, and we saw price accelerate to the upside. So, we’re in a very similar looking situation right now. Any losses the Euro/USD recover on Friday, so watch for a big push to the downside on Monday, and a recovery on Tuesday or Wednesday. But we must stay above 1.0793. We don’t want to be closing below that level more than two days in a row, or we’ve got a problem with longs.
U.S. Dollar versus Swiss Franc
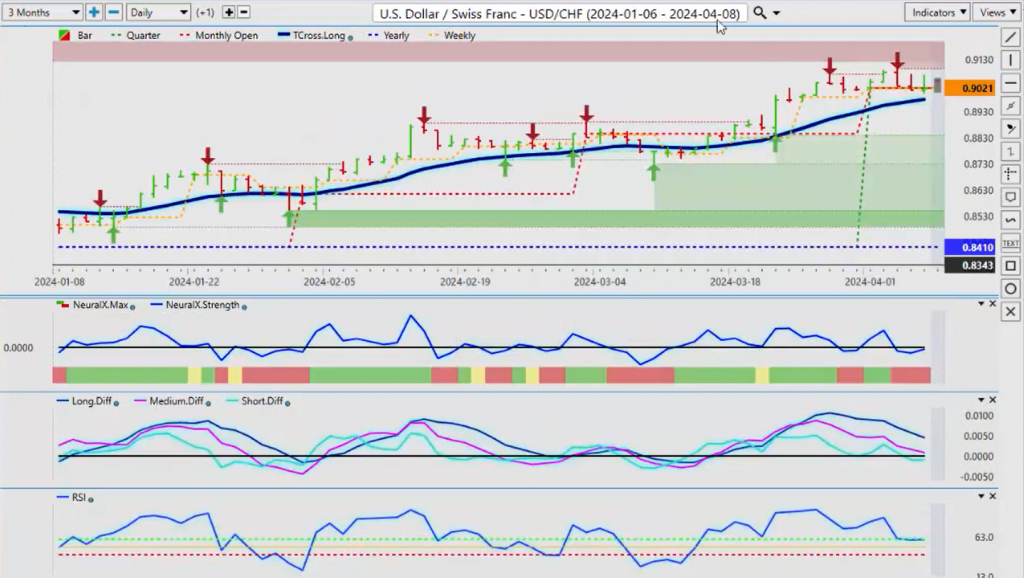
Now, USD/CHF, once again, a mixed bag here. Our new quarterly opening on this one will come in at 0.9021. That’s the area to keep your eyes on, guys. And if we lose our T Cross Long at 0.8977, we’ll confirm the Dollar weakness that we’re looking for in this particular calendar month and into May. So again, watch your main support level. A breakdown and close below 0.8977, we should see some further downside. But the indicators are sideways right now. So again, be cautious with this one. But again, it is going to come down to what the next move on the Dollar Index is. Can the Dollar Index break above the level discussed, around that 1.0450? If it can, then USD/CHF will likely move higher, but my optimism remains guarded because, again, I’m not convinced that labor report is as strong as what they’re suggesting.
British Pound versus U.S. Dollar
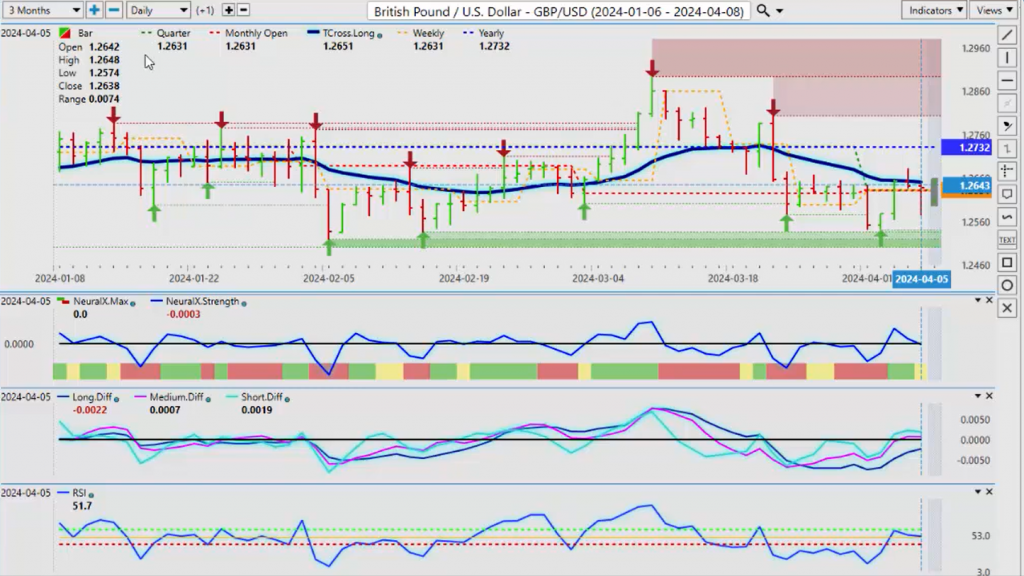
Now, the GBP/USD, once again, our new quarterly opening price 1.2631. I can’t stress enough how important this level is in the start of the second quarter because a Trend is going to develop here, guys. So, we leverage the position of the market in relationship to the quarterly opening. Above it, long; below it, short. So, we’re looking for a consistent close above 1.2631 so we can target 1.2732, which ultimately, I believe, we can break above. But that’s also going to depend on the Bank of England because they’re starting to get a little dovish again. So, we’ll monitor these things, but right now, we do have a short- and medium-term crossover to the upside. We’re just lacking momentum. So, we’re going to be looking for a Trgger point. I’m more than confident that’s going to come from some Fed statement. The problem is, it could send it higher or lower, so be cautious in the next whenever the Fed is speaking over the coming days and weeks.
U.S. Dollar versus Japanese Yen
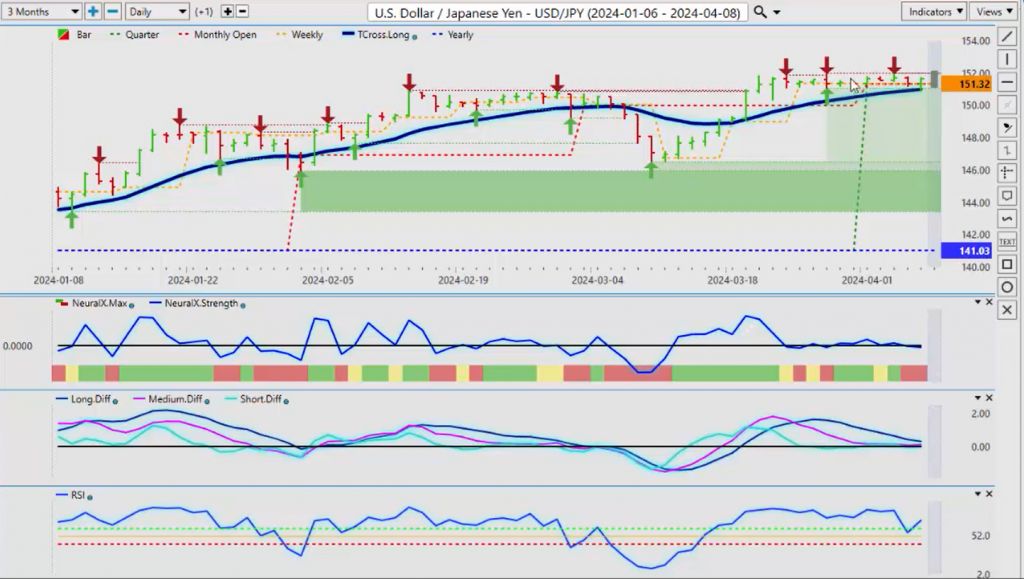
Now, as we look at the USD/JPY, The USD/JPY remains on everybody’s radar, but again, I’m not personally a buyer up here because I believe the Bank of Japan is going to pull something sooner rather than later. So, our quarterly opening here, 151.32, we need to hold above this if we’re going to remain bullish on this particular pair. But I see very limited upside here because I anticipate some kind of intervention from the Bank of Japan. The indicators are very mixed; you can see we can’t quite get a crossover in the medium term. We’re lacking downside momentum. So, once again, we’ll monitor this, but the two main levels are again our T Cross Long at 159.0 and our quarterly opening at 151.32.
U.S. Dollar versus Canadian Dollar
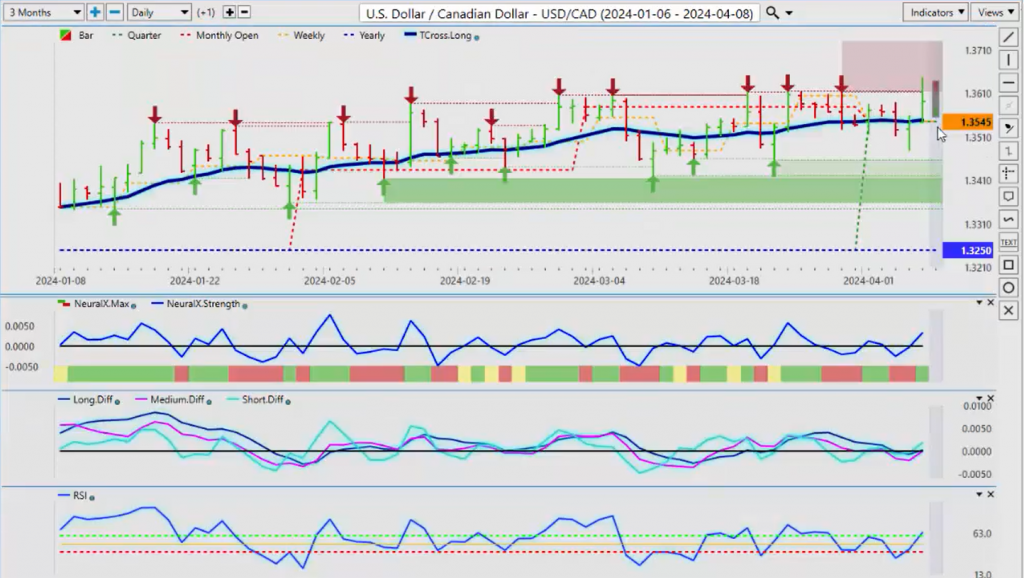
Now, the USD/CAD, another miserable jobs number out of there on Friday out of Canada. Canada, I think, is more likely than not to move into a recession. Carbon tax taking hold; that’s the real inflation in Canada is the carbon tax. So again, are they going to put a pause on it? Probably not. This is going to cause problems for the potentially for the Canadian dollar, in my respectful opinion. But right now, the indicators are bullish, but don’t forget, guys, in most cases, the dollar, the Dollar, is weak right after the non-farm payroll by the Tuesday or the Wednesday. So, this could reverse quickly, and what I was looking for on Friday was a close above the 1.364 high, these verified zones up here, and I didn’t get it. We got a push above it and then closed below it, so a false break above there. If we can’t get above that, guys, we are going to rechallenge the current quarterly opening 1.3545 is inevitable next week. Can we break down below the T Cross Long at 1.3549? If we do, then that will open the door to likely a very quick move down to 1.3456 where we can then reassess. But again, I will be watching this one very closely. The indicators are mildly bullish here, but again, not able to break above and stay above 1.36. Until this pair can do that, there is a slight downward bias.
Australian Dollar versus U.S. Dollar
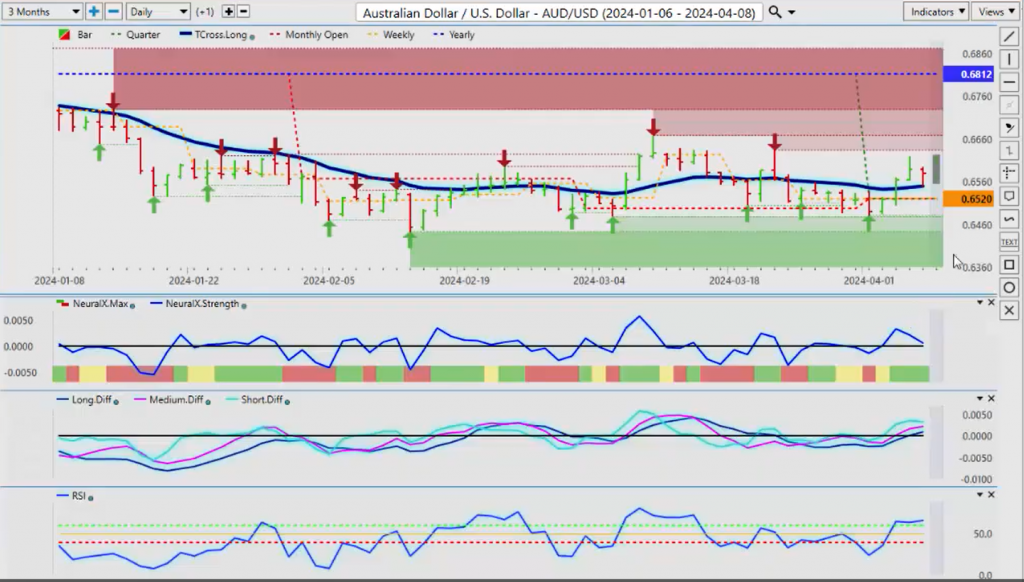
Now, when we look at the AUD/USD and NZD/USD, one could argue there is fantastic value down here, but we’re still very negative on the year. We’ve never actually been positive on this pair or on NZD/USD this entire calendar year. 0.6812 is our yearly opening price. Right now, we’re positioning nicely above the current quarterly opening; we’re above our T Cross Long coming in at 0.6549, so we want to look at this very closely. And sometimes, going back a year can actually show us a lot. We can see that we didn’t really have any significant rally. We did have a significant rally, I would argue, at the end of April here last year, and then we had it again at the beginning of June. But we’re making a series of lower highs. I’m not overly concerned; ultimately, I believe it’s the Dollar that will fall against the AUD. We just have to be patient; we’re probably a little bit away from that, but right now, it is setting up for a long.
New Zealand Dollar versus U.S. Dollar
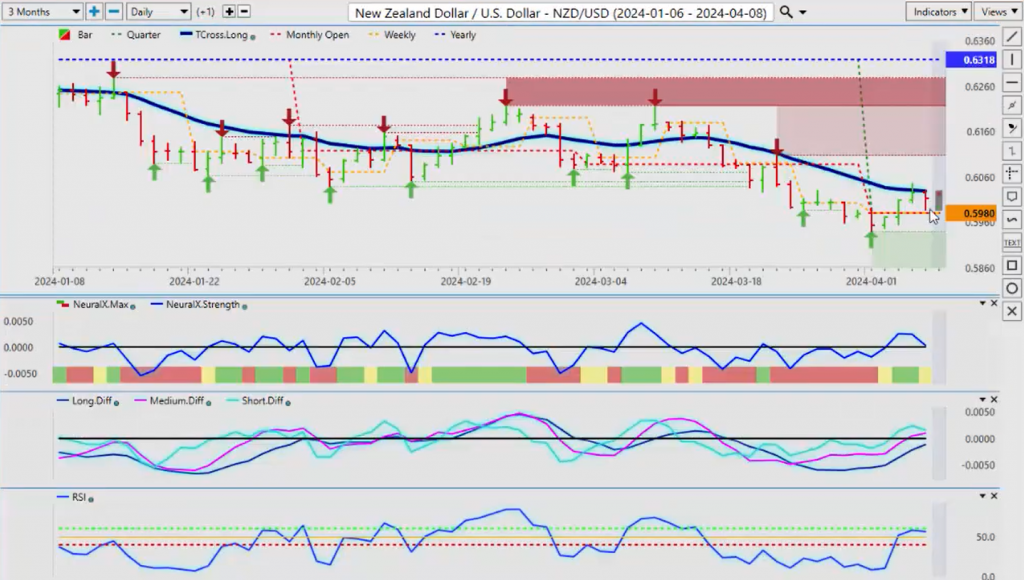
NZD/USD, you can see the same thing here, we’re holding above our quarterly opening, but the structural bias of this market, we’re below our T Cross Long. When we look at the AUD pair, we’re above it. So, if we cross-reference this to something like AUD/NZD, then we want to understand where the how can the AUD be strong and the NZD is not, and this is your answer over here, guys. The AUD/NZD pair, above the current yearly opening price, above our T Cross Long, and above our quarterly opening. All of these, you can see, we’re basically running right along the current quarterly opening. As I advise every week, we don’t want to be moving these anchor points to a random the last random 30 days, the last random five days. We want the current weekly opening, the current monthly, the current quarterly, and the current yearly opening price. We don’t want to move the anchor points because if we do, we’re moving them all year long. We need objective anchor points that we can trade from. So, this explains the strength in AUD/NZD; they have to buy AUD/USD and sell NZD/USD to buy AUD/NZD. It helps explain where maybe this is a better place to be than AUD/USD or NZD/USD, but my bias here would be to buy AUD/NZD and buy AUD/USD. From a hypothetical standpoint, that trade would make absolute sense.
So, with that said, this is the Vantage Point AI Market Outlook for the week of April the 8th, 2024.