


Welcome to the Artificial Intelligence Outlook for Forex trading.
VIDEO TRANSCRIPT
Okay, hello everyone and welcome back. My name is Greg Firman and this is the VantagePoint A.I. Market Outlook for the week of May the 5th, 2025.
Now, to get started this week, we’re going to do things a little bit differently here—removing some of our futures and using some ETFs to help all markets: the stock market, commodity market, and of course, the foreign exchange market.
SPDR $SPY ETF
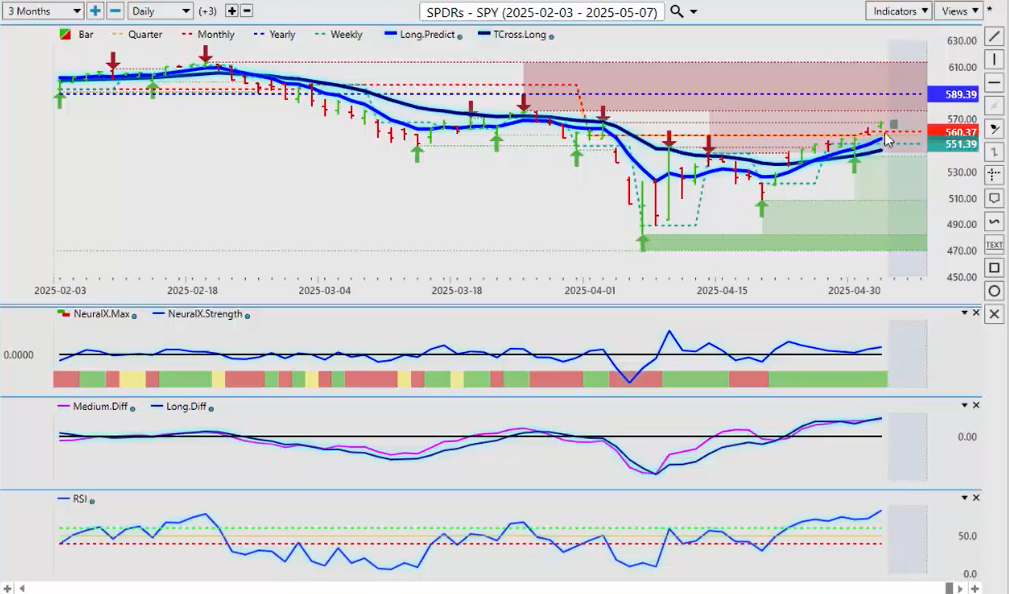
So, we’ll start with the SPY, and when we look at this right now, things are looking much better for the equity markets, but we still remain below that very important calendar yearly opening price that’s coming in at 589.39. But we are holding above the new monthly opening price that will come in at 560.37. We are above our TCross long, and our long predicted support levels now come in at 555.19 and 546.33. MA Diff cross is still holding up. The predicted RSI is a little bit into overbought territory but not too concerning. We can see that the neural index is green, but the neural index strength has been warning of volatility—now it’s recovering and starting to point up.
So, going into next week, still a lot of volatility with everything that’s going on with the current Trump administration, with the tariffs. But I think things will start to hopefully calm down somewhat.
US Dollar
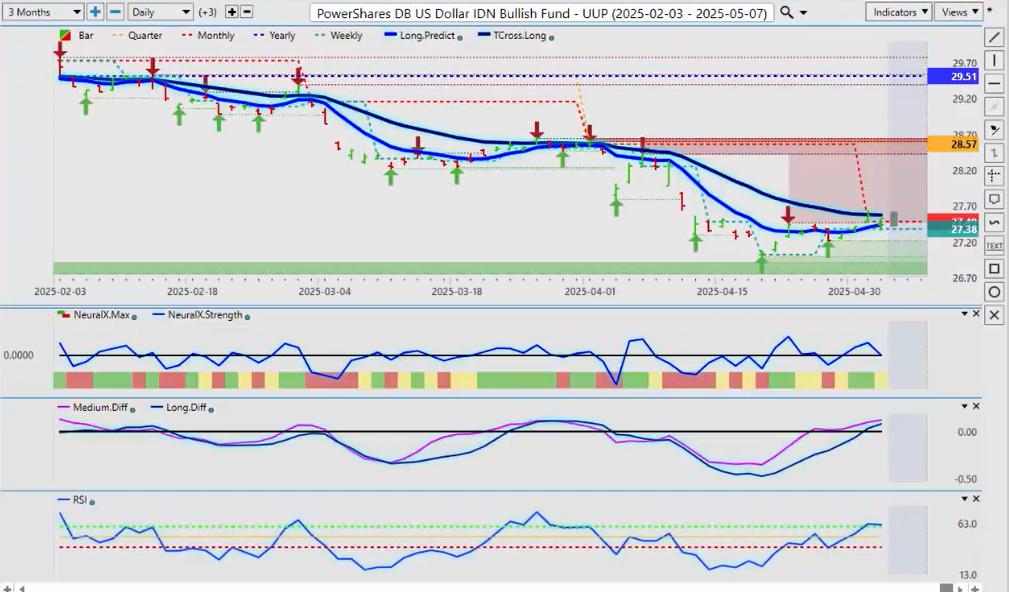
Now, when we look at the US Dollar, what I’m going to use now is the Dollar Index Bull Fund ETF and the Bear Fund, and we can look at both sides of this. Now, the bull argument here is that we’re not above our current TCross long that’s coming in at 27.57. It looks like an MA Diff cross is getting ready to form—that’s a contrarian indicator, but also a good trending indicator too. So, right now we would have to clear 27.57 for the dollar to turn bullish.
Now, we do have the Fed coming up this coming week, and I believe he’s going to be on hold. Looking at the labor report on Friday—it was much better. Still some things in there that could be better, but it’s going the right way. So, when we look at that, it may help the dollar leading up to the Fed. But once the Fed speaks on Wednesday, I believe that’s likely when we’re going to see the dollar turn. So, we want to hear what the Fed’s plan is going forward—if he even has one.
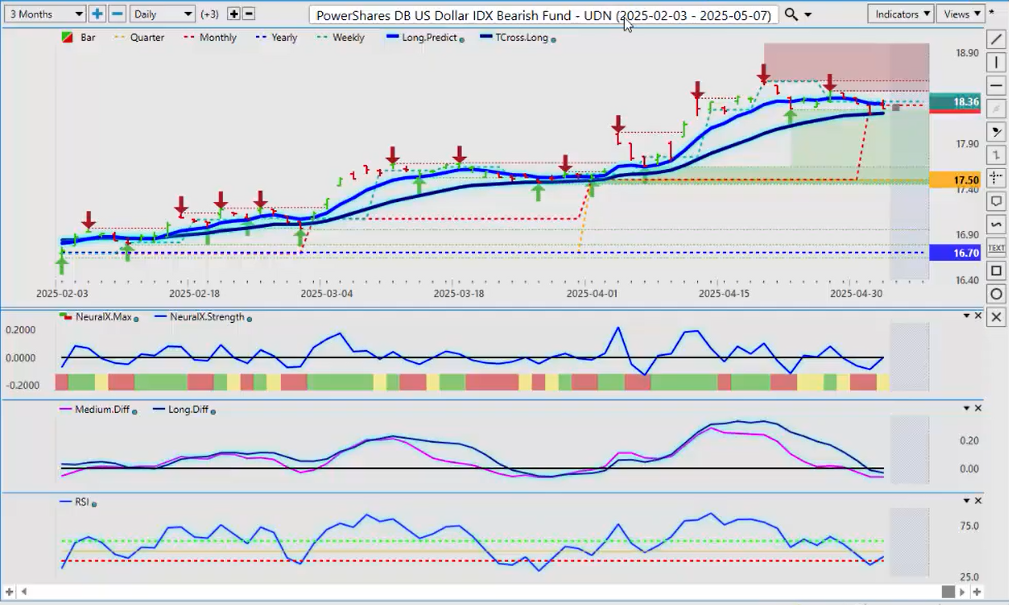
Now, when we look at the other side of this argument—the Dollar Index Bear Fund, the UDN—we can assess that we are above the TCross long at 18.23. So, I believe that this one has value versus the Bull Fund after we get past the Fed. But right now, the predicted differences are warning that we’ve got more downside. I believe that is likely, but we would have to break through 18.23 before we started worrying about the dollar becoming excessively strong.
As in most cases, the dollar actually doesn’t do very well in the month of May—only at the beginning of the month. That dollar cycle that we’ve just seen, where there’s real dollar buying at the beginning of the month. So again, we need to get above the monthly opening price here on the Bear Fund—that would confirm that the Bear Fund is going higher and the Bull Fund is moving lower. That translates into dollar buying and dollar selling. And I’ll speak more to that in a moment with EUR/USD.
Gold
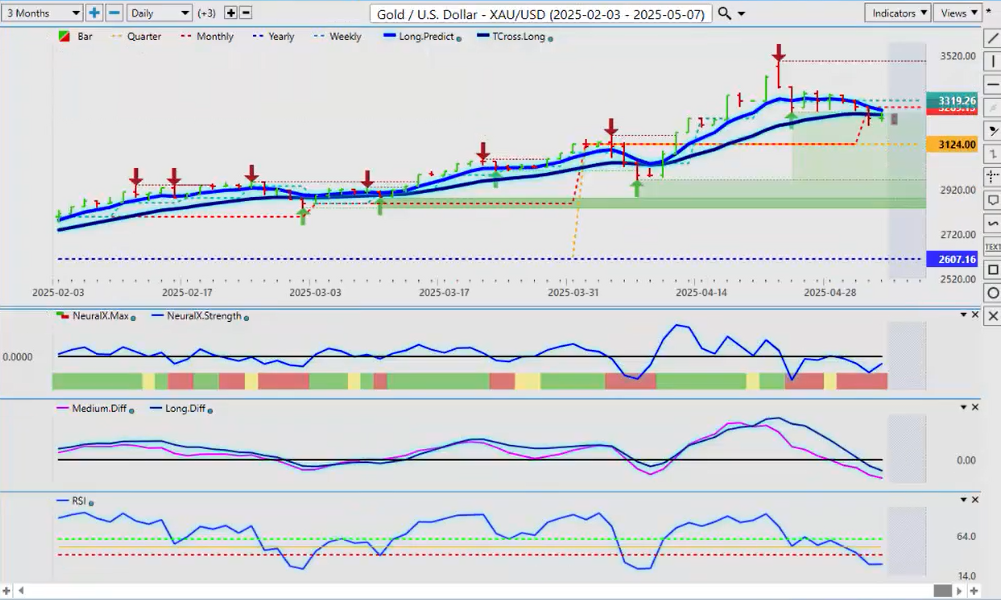
Now, when we look at gold prices, I’m going to use XAU/USD, which is basically the cash price of gold. That’s one of the main contracts I use anyway versus the futures. So, when we look at gold, it’s really trying to recover here. What I really like is the neural index strength has got a reverse checkmark, potentially starting to point back up. We’re flattening out on the predicted RSI, but the predicted differences are still showing a little bit of weakness.
Now, I believe that gold also will recover after the Fed on Thursday and Friday of this coming week. So, while we’re holding above the current quarterly opening price—3124—if you are buying gold, just make sure your stops are below. In most cases in this particular quarter, gold does fairly well. But again, it’s going to come down to whether the Fed takes the position that he’s not going to cut—that would put additional downward pressure on gold. So, just be mindful of that, guys.
Crude Oil
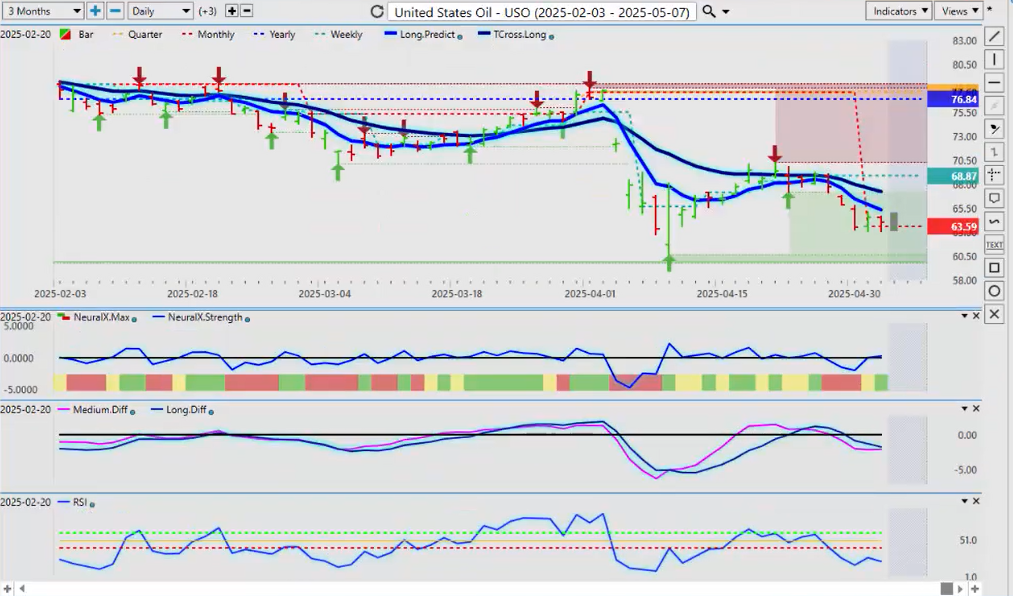
Okay, now for oil contracts—going forward, I’ll vary this from week to week, but we’re going to look at the United States Oil Fund, the USO. So right now, I can assess here that we are coming into a known period of oil strength. We have no visible selling below this particular level on this fund at 63.09. The selloff and subsequent move higher here on oil occurred on oil futures and USO on the exact same day, guys—same trade.
So right now, I would argue that in most cases that seasonal pattern kicks in, and your oil stocks, oil in general, will start doing better as we move past the Fed. Letting us know potentially—I expect him to make a comment on whether the U.S. is going into recession or not. So, either way, in most cases oil rises in May and June. So, watch that one. Everything still looks pretty good.
Bitcoin
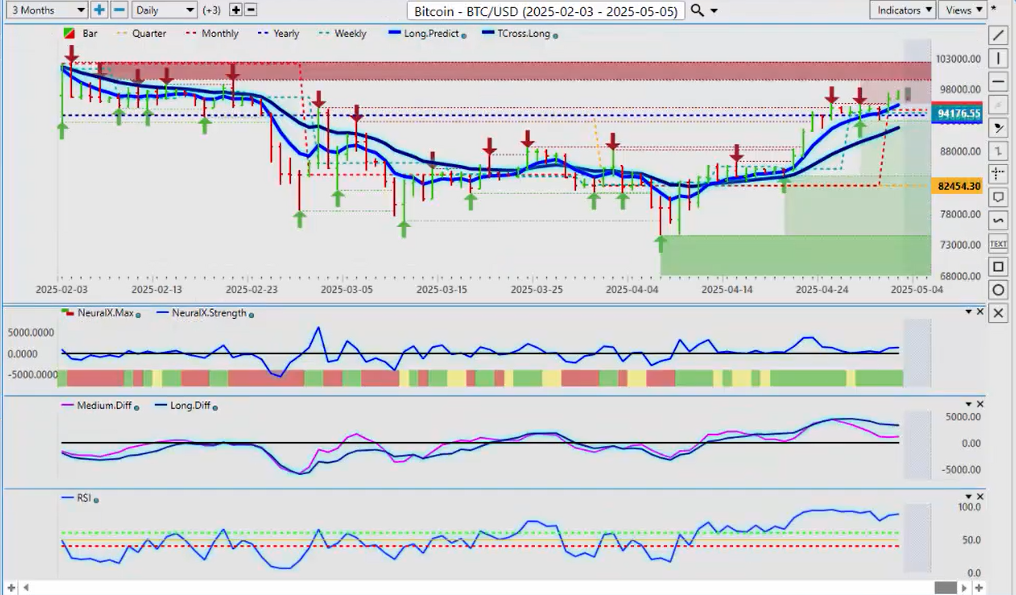
Now, for Bitcoin, I will use Bitcoin/USD. Right now, this is a critical level. The Bitcoin/USD has moved above its calendar yearly opening price—that was critical to retake this level. Bitcoin is positive on the year again. So, the yearly opening price—93804—that’s the level to keep your eye on. We’ve got our long predicted at 94794 and our TCross long at 91208. Those are key levels, but I believe either way Bitcoin will remain above 82454—the quarterly opening price.
Now, we did have an MA Diff cross which put a little bit of pressure—the pink line crossing the blue line—putting a little bit of downward pressure on Bitcoin, but it easily recovered back up.
Now, what I will point out on a side note: Bitcoin follows a three-year pattern, guys. Three years up, one year down. We are in the third year of a three-year rally, which suggests that Bitcoin potentially could move lower at the end of the year or next year. But the main rally in Bitcoin, in my respectful opinion, only will occur again like it has repeatedly over the last several years—too many to count. September through early November is usually your main big spike in Bitcoin. So, I don’t think anything has changed. But again, I would prefer that we stay above 9182.2 if we’re going to continue to buy.
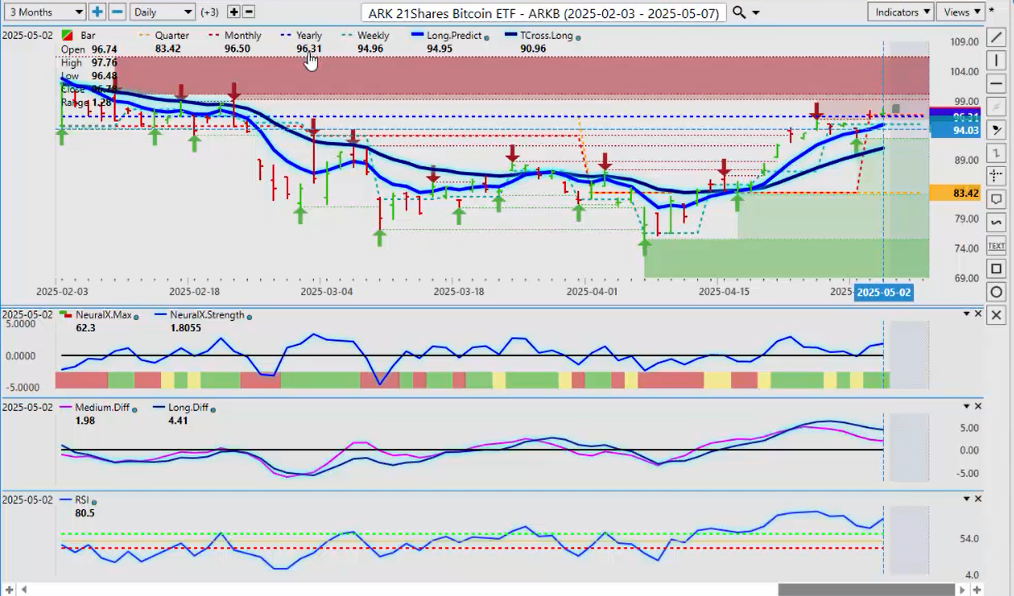
And again, for the stock traders on here, this is a great alternative. You can see that the ARKB Fund is moving above its yearly opening price also—that price coming in at 96.31. So again, when you go back and look over the last 10 years or so—5, 7, 8, 9 years—very interesting how well this fund has done. But make no mistake, it tracks the price of Bitcoin. So, another potential market to look at if you want to get some exposure in your portfolio to Bitcoin.
Euro versus US Dollar
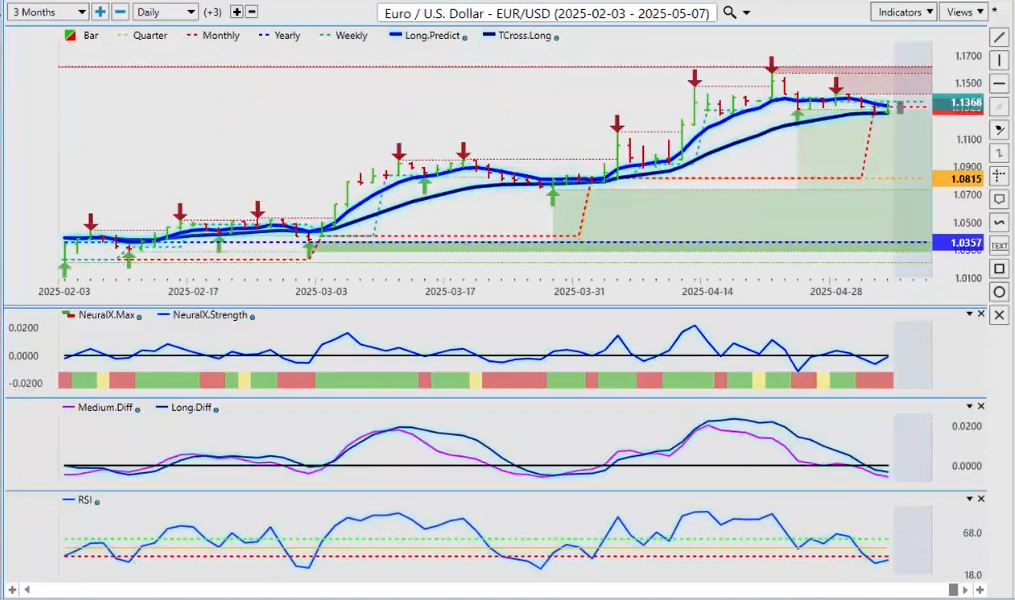
Now, as we go into some of our main forex pairs, the EUR/USD, guys—while I’m not showing the Dollar Index Futures contract, that’s okay. The EUR/USD Forex pair is 99.9999% inversely correlated to the Dollar Index. So in theory, we are looking at the Dollar Index here. The euro is holding above its TCross long at 1.1284—pretty heavy support down into about the 1.1150 zone. Between 1.11 and 1.12, I would argue, is going to be the buy zone.
When we look at the euro from a structural standpoint—we’re above the yearly opening price, we’re above the quarterly opening price. The new monthly opening price is 1.1329. If we can hold above this, then the euro will advance. But a corrective move prior to the Fed is more than reasonable. And if the Fed does make comments that he’s not going to cut and he’s holding firm the rates where they are—well, I believe he will only get away with that for another month or two. So it could put some downward pressure on the euro.
The indicators in VP are warning of that, but again, that predicted RSI is trying to turn back up. And when we look at the euro, this is usually what happens. When we count back five days, as you can see, last Monday we couldn’t break above the Monday bar high—we broke the Monday bar low, and the euro went down. But that TCross long provided the support we needed to say, “Look, I don’t know that the euro is done quite yet.” But we would need to break that.
Now, for more aggressive traders, the TCross long is coming in at 1.1284—you could put a sell stop below about 1.1270. And if it breaks down below that level, you probably will have a short here. But again, this is an outlook, guys—not a recap of something that’s already happened. So we want to make sure we have a strategy we can use to potentially catch that if there’s a sudden spike to the downside. Very possible that could occur on Monday, but be careful on Tuesday and Wednesday.
Okay—but remember the EUR/USD is 99.99% inversely correlated to the Dollar Index, so we are looking indirectly at that Dollar Index.
U.S. Dollar versus Swiss Franc
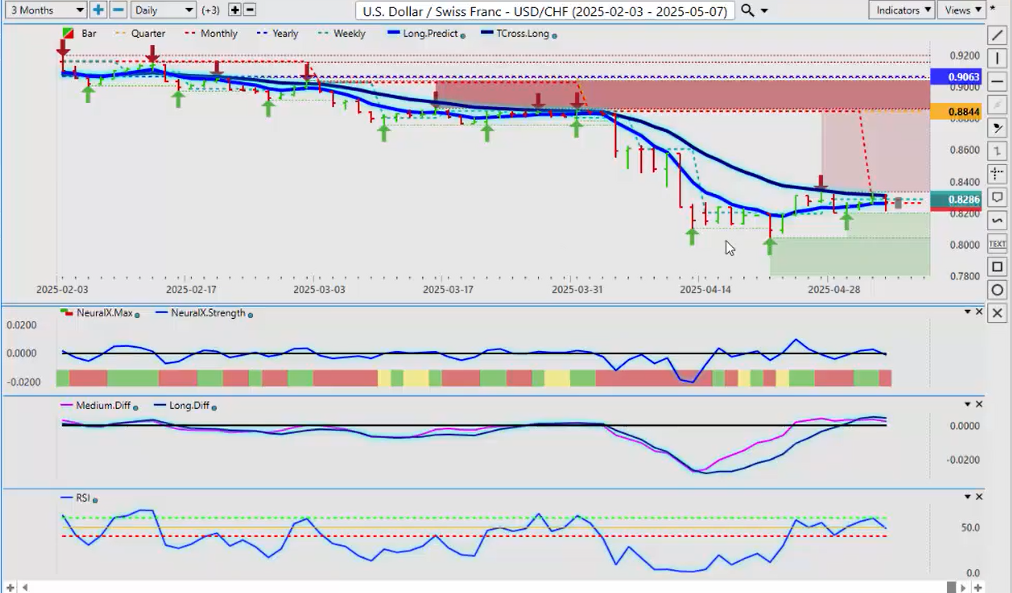
Now the USD/CHF (U.S. Dollar/Swiss Franc)—once again, it’s trying to push through the VP TCross long. Even on a stronger payroll number, the market was unwilling to continue to buy this pair. Now that TCross long at 0.8307—that’s the key level. If we can break this level, we can move higher, but my optimism on that remains heavily guarded because we have an MA Diff cross right here—pink line over the blue line—that is warning this is only a corrective move.
But again, we can straddle that TCross long—sell at 0.8307—and if we break higher, say around 0.8340, we can immediately cut our shorts and go long. That trade should work into the Fed announcement on Wednesday. That would be a reasonable play.
British Pound versus U.S. Dollar
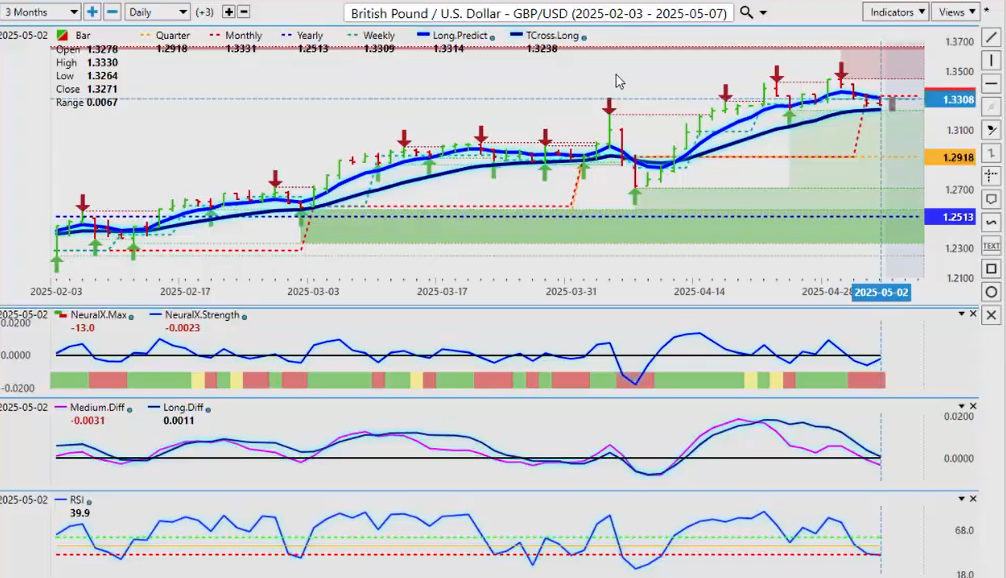
Now, with the GBP/USD, again, structurally looking at this, the pound is above its yearly opening price at 1.2513, quarterly opening at 1.2918. And again, we’ve got some volatility, but right now the pound is trapped between the TCross long at 1.3238 and the new monthly opening price at 1.3331. So that’s what you’re dealing with, guys, for next week on what is probably the most volatile of the G7 U.S. Dollar-based forex pairs.
This is your most volatile. So if it snaps below the TCross long, then you can pretty much take it to the bank—the euro is going to follow it down. But if they both hold, then that will confirm we’re past our period of known U.S. Dollar strength—which I believe, again, will hold until about Wednesday and then we go the other way. So watch for a potential buying opportunity on both of those pairs, because I think there is a trade there.
U.S. Dollar versus Japanese Yen
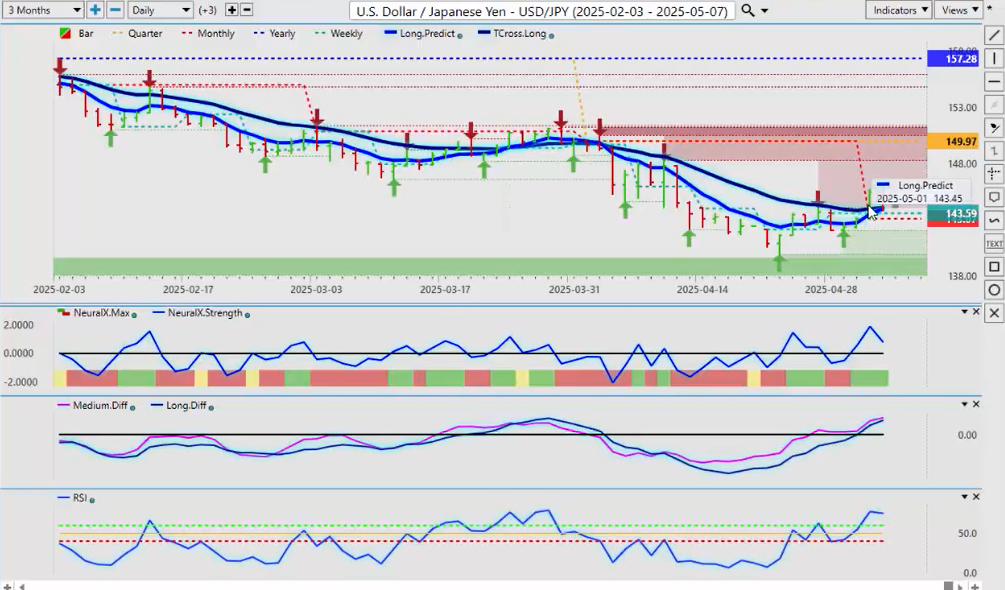
Now, when we look at the USD/JPY, the Dollar/Yen has made a big push up on Thursday right off the current monthly opening price. The new calendar monthly opening price—once again, we don’t want to get into a rolling performance model here, guys, where we’re not looking at the start of the month on the first day and using that as a pivot level, if you will, to get into trades. If I have a random five days, random fifteen days, then I’m moving the goalpost here—and it makes it difficult to score if you move the goalpost, right?
So let’s try and keep this locked to that level, and we can use that new monthly opening price—1.4307—that is our key level to watch next week. Can we hold above that?
Now, structurally speaking, the yearly opening price is 1.5728, quarterly is 1.49. This pair is bearish, but it’s going to come down to the carry trade. If the Fed is suggesting he has no interest in cutting rates, that carry trade could be reignited—meaning buying dollars, selling the yen—high-yielding currency vs. low-yielding currency. So keep an eye on that.
But I do think I would still stay to the short side on this. The indicators in VP are very mixed. The neural index strength is pointing down while the neural index itself is green. And that’s why it’s very important to use both of these two together—because inside the neural index, it’s actually saying structurally it’s not strong. So we’ll monitor this one. But again, our key level—1.4393—is the level to watch next week.
U.S. Dollar versus Canadian Dollar
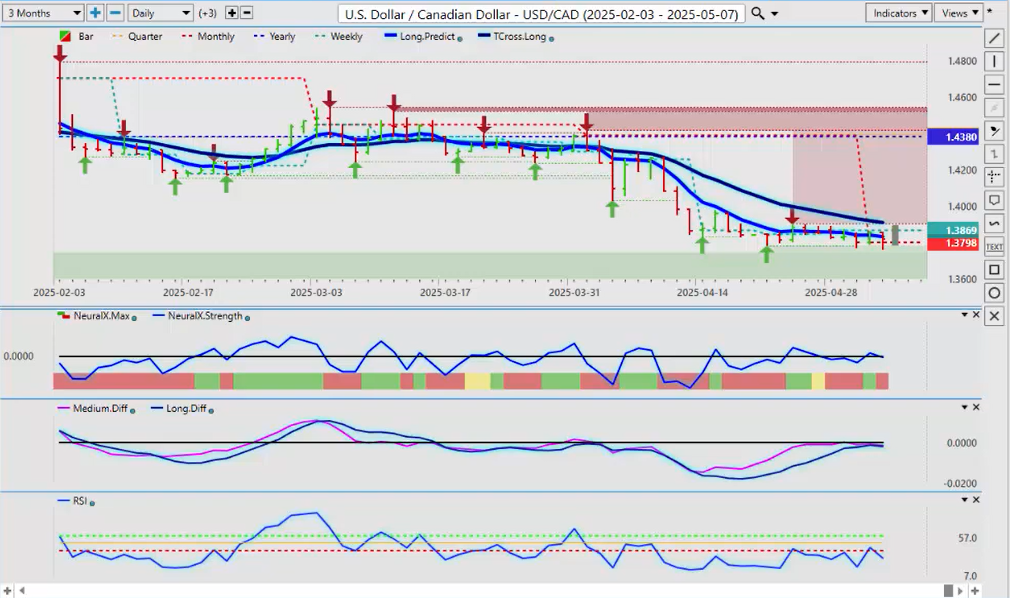
Now, the Canadian Dollar—the election is over, so we’ll be seeing new policies from the new Prime Minister. We’ll see where this goes, but they’re already talking about big budgets—I think in the neighborhood of 135 billion. That is not likely going to be good for the Canadian Dollar.
So again, I will monitor this, but I will concede—we’re negative on the year. So, 1.4380—we are bearish on the year. Staying with that primary trend, in most cases, can be good. We have a verified support low that’s coming in at 1.3782. So, that’s the level we’re going to keep our eye on for next week to see if we can push above that and start moving higher.
But if the equity markets—the NASDAQ, the S\&P 500—move higher, in most cases then oil is likely moving higher also. When we look at oil once again, I’m not seeing any selling where oil on the U.S. Oil Fund is now. So, the Canadian Dollar has a very high correlation to oil. If oil moves higher, then USD/CAD is likely going lower because of that strong positive correlation between the Canadian Dollar, oil, and even RBOB Gasoline contracts.
And we’ve got that summer-winter-summer gas switch-over here also, fueling potentially Canadian Dollar buying. The question is how long will that last. But for now, slight bias to the downside on this. If we can stay below 1.3832—our long predicted—and the TCross long at 1.3910.
Australian Dollar versus U.S. Dollar
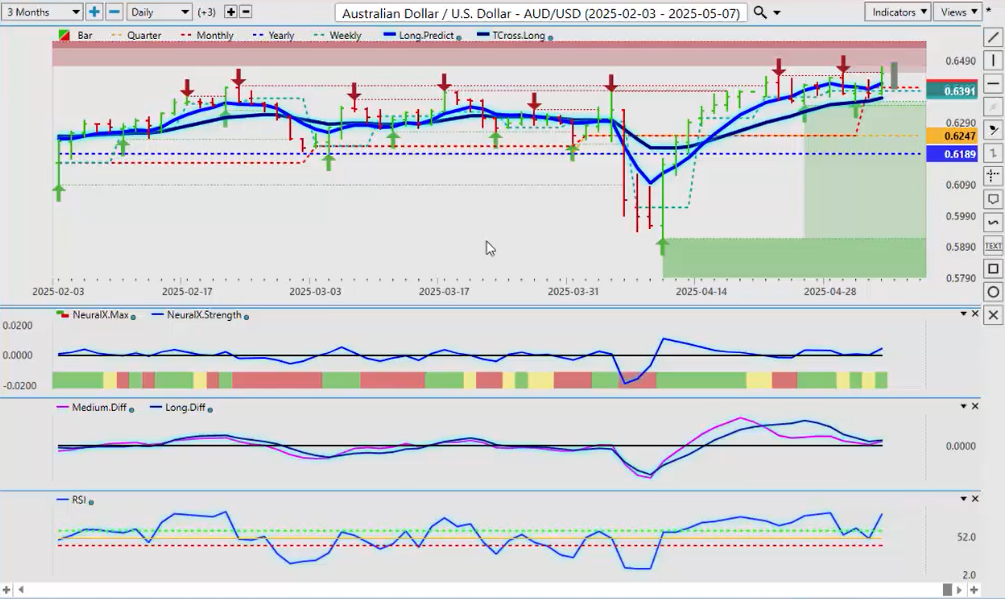
Now, the Aussie Dollar again was a good one last week. You can see that we’re coming right off of that TCross long, and that’s a critical pivot level—big move off of that on Friday, even with a pretty solid jobs number. So, our TCross long—0.6369—that’s the key level we want to watch. The indicators in VP are suggesting we’re going higher.
The Aussie, much like the CAD, has a very, very high correlation to the stock market. So, if the S\&P continues to advance, currencies we look to buy include the Canadian Dollar, New Zealand Dollar, and Aussie Dollar. Currencies we look to sell include the Swiss Franc and Japanese Yen. That’s how it usually works from an intermarket analysis standpoint. So again, that key level—if it can hold—then this pair can advance.
New Zealand Dollar versus U.S. Dollar
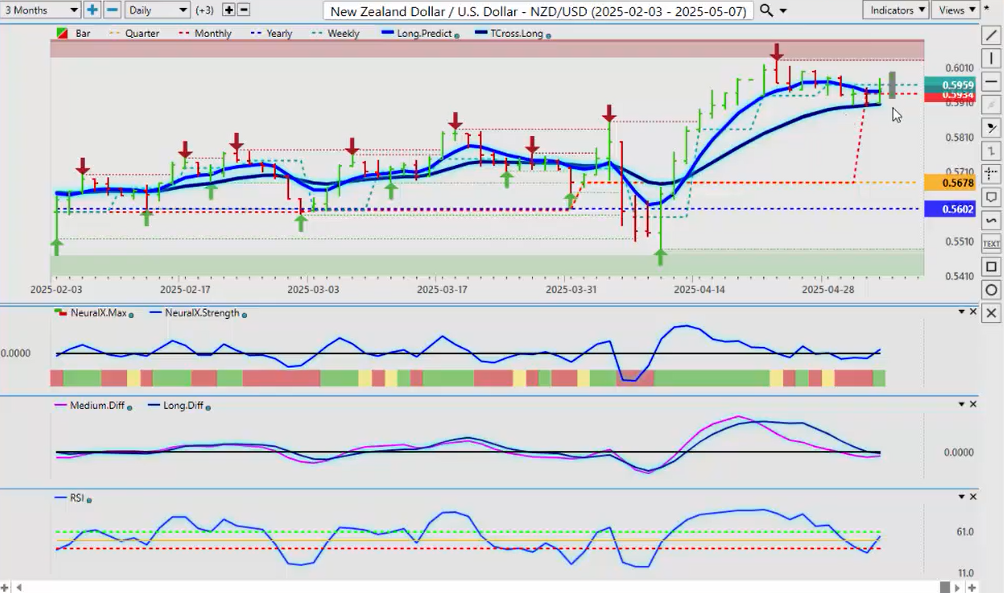
And the exact same thing would apply to the Kiwi. You can see three solid attempts to break that TCross long last week. That creates a major pivot level for us—0.5903. That’s the level you want to keep your eye on if you want to stay long. The VP indicators are looking pretty good here—an MA Diff cross back to the upside, neural index. I love that position of the neural index strength and a failure to hold below the 40 level on the predicted RSI.
So again, I think we will have some opportunity next week—we’ve just got to get past that major economic announcement. Not so much what the Fed is going to do—I believe he’s going to hold—it’s the press conference you want to listen to very, very closely as to what is his plan going forward for interest rates.
So with that said, this is the VantagePoint A.I. Market Outlook for the week of May the 5th, 2025.


