









Welcome to the Artificial Intelligence Outlook for Forex trading.
VIDEO TRANSCRIPT
VantagePoint A.I. Market Outlook
Okay, hello everyone. Welcome back. My name is Greg Firman and this is the VantagePoint AI Market Outlook for the week of August the 10th, 2026.
US Dollar
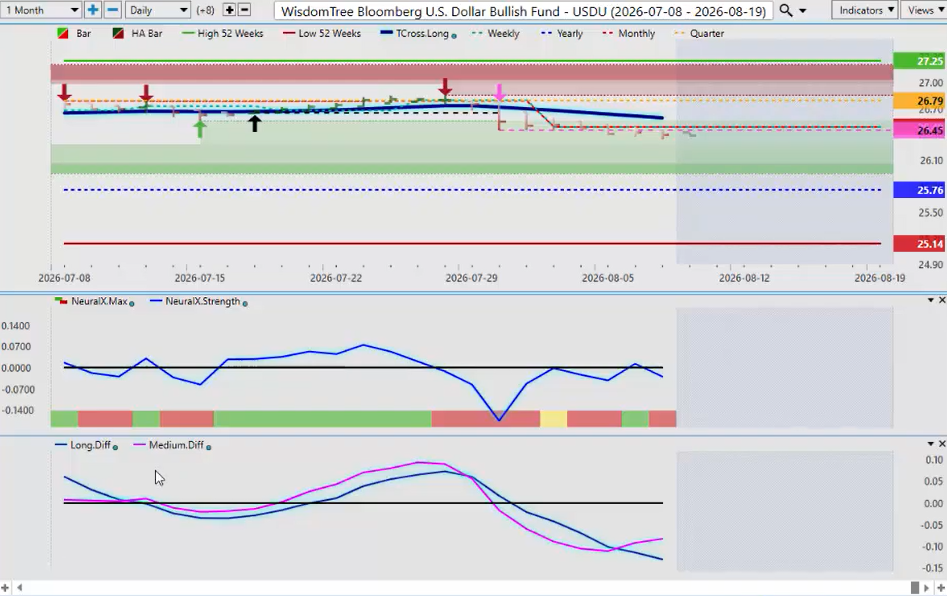
Now, to get started this week, we will begin where we always do with that very important US dollar. Now, the the the US coming off a very poor labor report. Uh, but I will point out that there were a lot of those job losses were government jobs. Uh so when we strip that out, the report in my respectful opinion only wasn’t quite as bad as what they what they’ve stated. And with that said, we can see we have an MA diff cross on the VP software. We are below the T-Cross Long. And once again, the USDU has proven to be a very powerful way to measure broader US dollar strength and weakness. and it remains in an uptrend above its calendar yearly opening price at 2576.
So again, our neural index is down, but that MA diff cross is warning that we could be moving higher on the dollar despite that labor report as it would appear very little is settled in uh the straight of Hamus. The the war between the US, Iran, and Israel not going away here. So uh I don’t think that dollar strength is necessarily going away either. So again, be careful uh this coming week with that.
Gold ($XAU/USD)
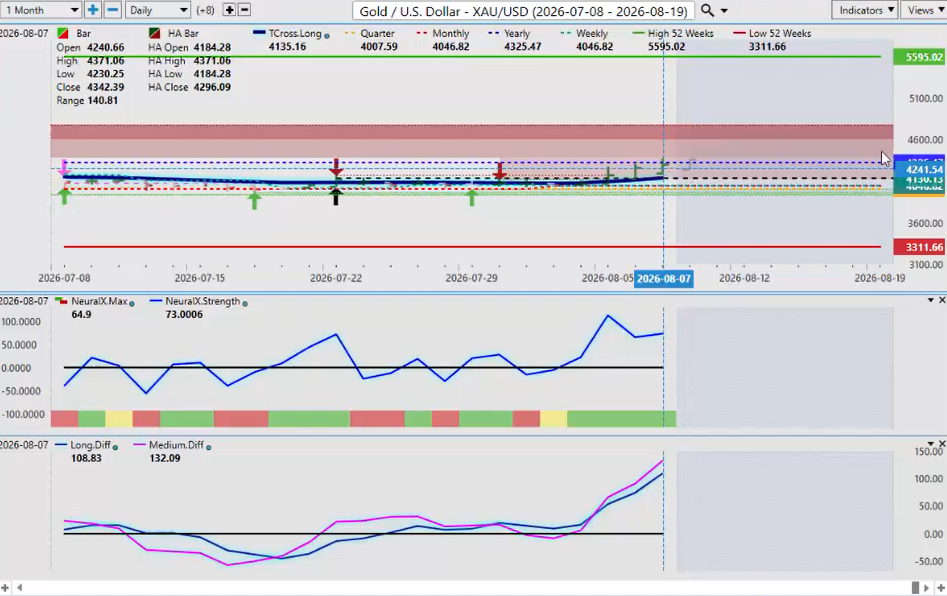
Now when we do a comparative analysis with gold, this one gets very interesting. Gold now pushing up against the calendar yearly opening price. That price is 4325.47 currently. We would need to clear this levels substantially for gold to start moving back up again significantly. But as we saw last week when uh when Trump had stated that everything is just about done, we’re pretty much settled. We saw equities, gold all spiked up as oil and the US dollar went lower. Now that could violently reverse as early as uh Monday.
So be careful with that again. But right now, gold is trapped between the T-Cross Long at 413516 and that very important year-to-ate opening price of 4325. And again, we need to push through that. So keep a very close eye on the dollar itself.
European Equities DAX
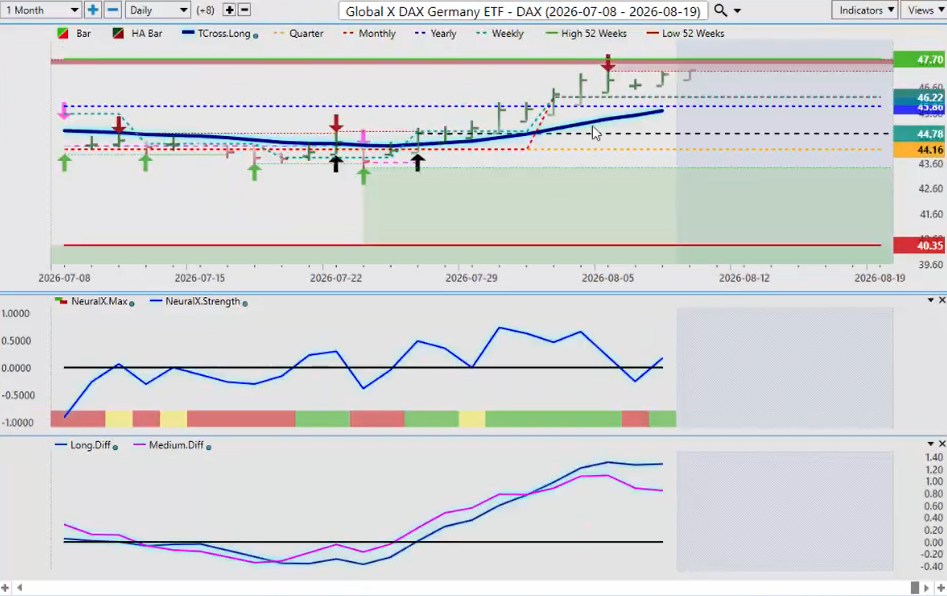
Now when we look at some of the main equities here, starting with the European, I’m seeing a very similar thing across your main equities or indices or ETFs following those indices and that’s that a ver a new verified zone is formed uh above slightly above the yearly opening price. So again, the equities got a very strong boost based on everything was settled with the US and Iran when in fact it is not or at least as at the time of this video Sunday morning at 9:05 a.m. it is not settled. In fact, Iran is saying the exact opposite. They’re not letting US or Israeli ships through. So once again, there is a strong risk for a reversal here.
Now looking at those VP indicators, you can see that our medium-term strength, the pink line measures the strength of the medium-term crossover, and we are losing momentum to the upside. So be very cautious up here.
But you have very heavy support right here at the T-Cross Long 4569. The yearly opening price 45.86. If I were to buy this, it would have to be at that level because I suspect that we will be pulling back in the first couple of days of the week or in the alternative. If we have a big rally up on Monday, you can expect a violent reversal on Tuesday and Wednesday.
Powershare QQQ ($QQQ)
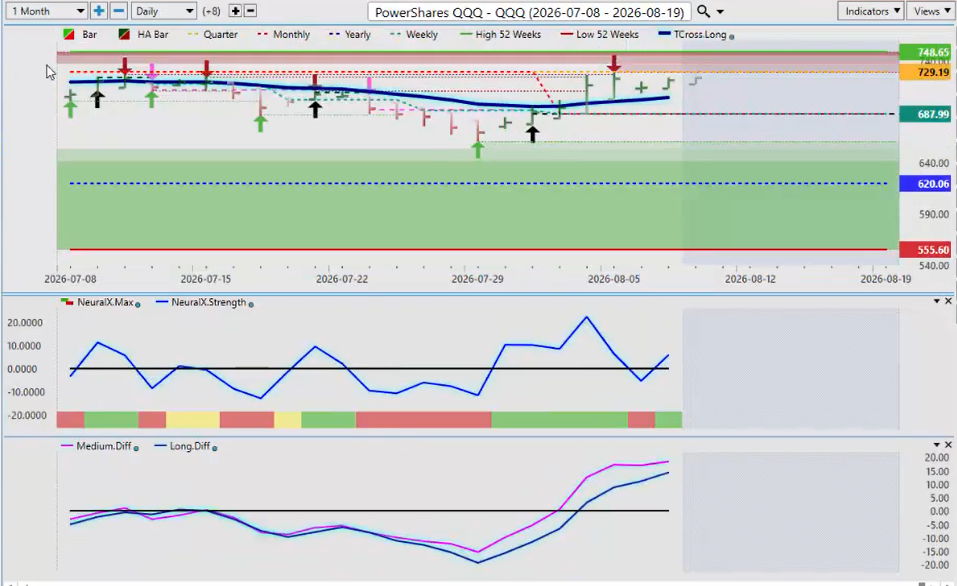
When we do a comparative analysis to the Q’s, you can see the same thing. We have now formed uh a new verified resistance high that is coming in at 72854. The indicators in VP are starting to flatten out. Still mildly bullish here.
But again, guys, remember if the dollar goes up, pretty much everything else goes down.
SPDR SPY ETF ($SPY)
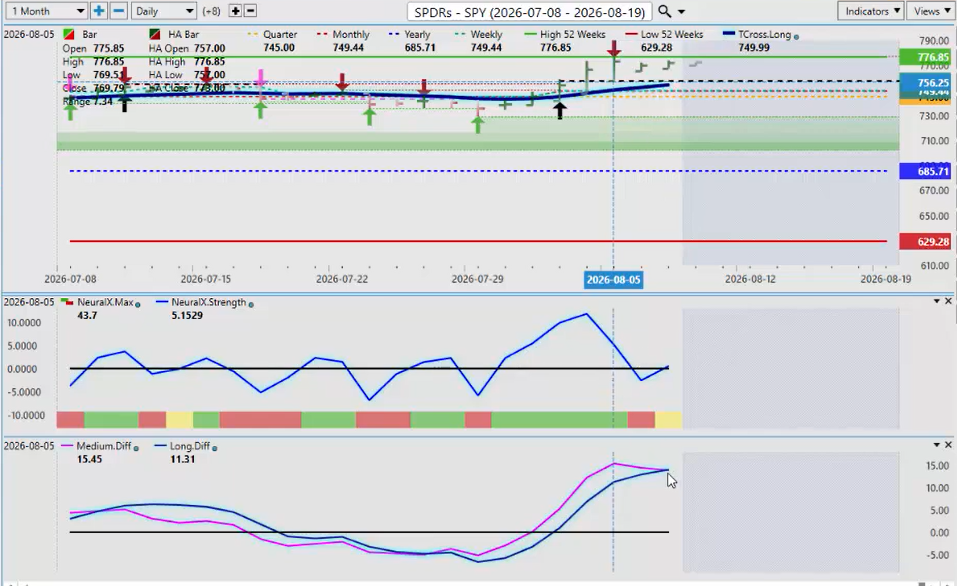
A further comparison to the spy’s. We can now see that we have the the global XDAX, the Q’s, and the spies have all formed a new not only a new 52-week high, but again a new verified resistance high. So, this level, be careful of a bull trap up here, guys. Above that level on any one of these three uh indices that I’ve discussed because in most cases, you’ve got something else coming.
Now, when I look closer at the spies, you can see that an MA diff cross is about to occur. That means we are going to have a corrective, not necessarily a trend change here, guys, but a corrective move back to the T-Cross Long. That level is 75405. We can reassess longs at that level next week. Should we come down to that?
Because once again here guys, always remember this is an outlook, not a recap of something that’s already happened.
Bitcoin
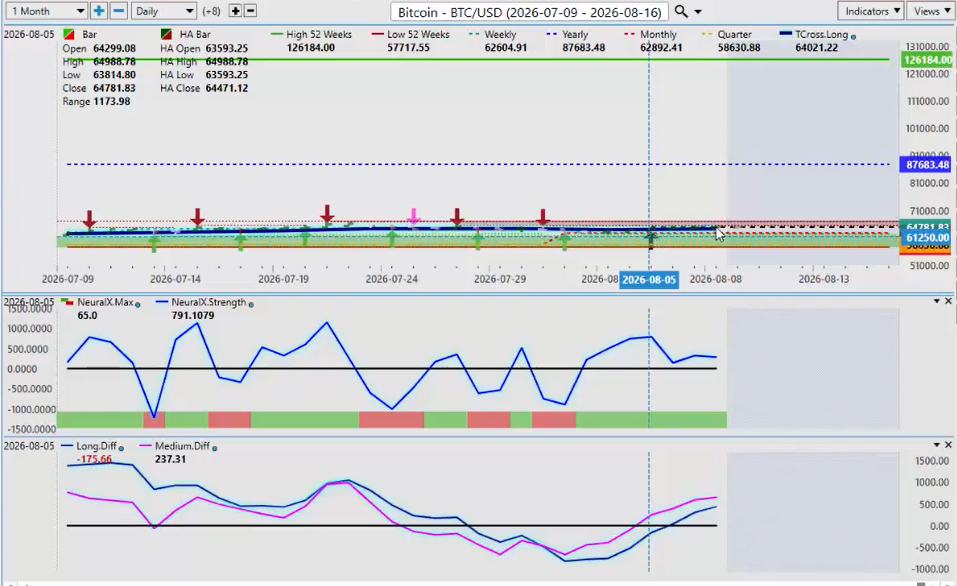
Now with Bitcoin, when we look at Bitcoin, we do have a Heiken-Ashi buy signal. But remember, the primary trend on Bitcoin in 2026 is indisputably indisputably down. We have remained below the calendar yearly opening price. If you bought Bitcoin on January 1, again, I get a lot of emails about this.
We look back, you can see here, if we go back 6 months, we really have struggled when we’ve approached that year-to-date opening price. We have failed each time.
Now, I again, I do feel that Bitcoin will extend higher, but that won’t be until midepptember into the end of the year and going forward into 2027. But there is there is certainly the possibility of more downside than upside on Bitcoin over the next u five five to seven weeks. So be careful with that.
But uh on the on the positive side for for Bitcoin bulls, we do have a medium and a long-term crossover. But again, we’re really running flat here, guys. So be very very cautious with this one for next week.
Euro versus US Dollar ($EUR/USD)
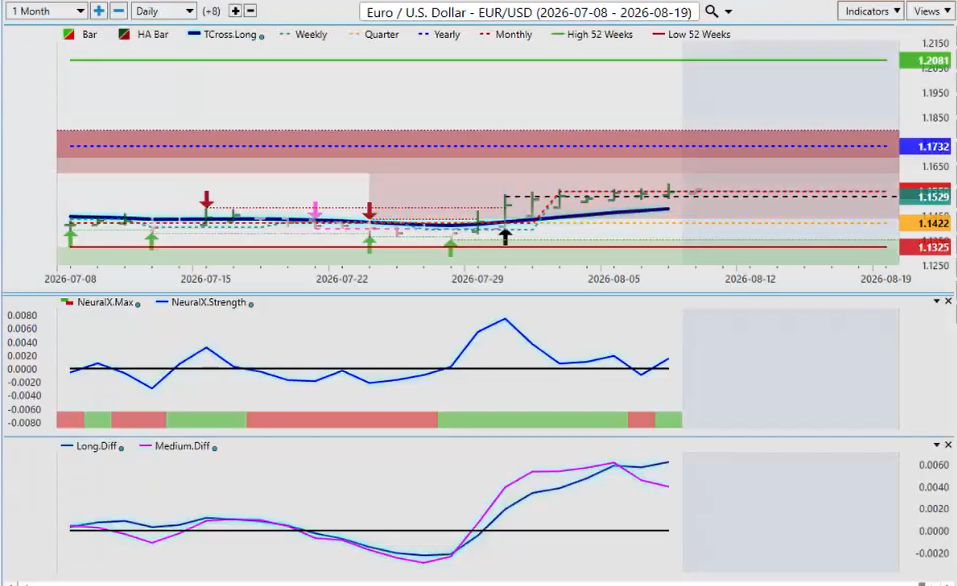
Now when we look at our four main forex pairs uh without getting redundant into all the US-based pairs we start with the euro. Now again we had a good signal last week but the euro is completely stalled out here. So again if those if the stock markets and gold and bitcoin move lower that will drag the euro down with it on that dollar strength.
So the calendar yearly opening price 11732 that’s the key level. Uh currently another way to play this uh for the bulls, the bulls can continue to target 11732. Uh but I would in my respectful opinion I would have buy limit orders above 11732 and be very cautious shorting this into this area because again we’re coming into a period of known US dollar strength in the month of September.
So be very cautious there. uh and again when we look at it for next week we can see we have an MA diff cross now what this means is that the likely retracement point will be 11477 that is the T-Cross Long like a moth to a flame the market will always come to this retrace back to this level it has absolutely nothing to do with u Fibonacci Ballinger bands anything of this nature it’s that predicted data in that predicted moving average that is attract is our main retracement point.
So again uh the euro if it goes flying higher on Monday guys chances are it’s going lower the rest of the week.
British Pound ($GBP/USD)
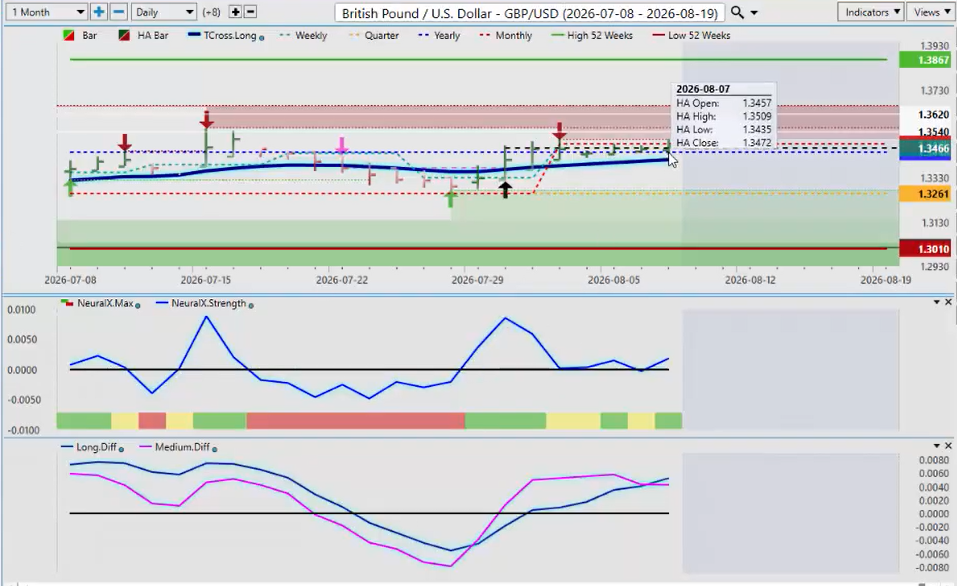
The pound dollar also pushing higher on that labor report but as you can see we’re struggling right along that yearly opening price 13448.
Now the British pound is a little bit stronger than the euro but that could also mean it has more room to fall. So again if we can hold above that very important T-Cross Long of 13414 and the yearly opening price of 13448 then we have a long trade. But if we can’t then we definitely have a short trade likely back down into the quarterly opening price at 13261.
So again watch this level very closely. Another way a savvy trader can play this is putting a sell stop order below 13414. So if we break down below that, chances are we have room to run.
Australian Dollar
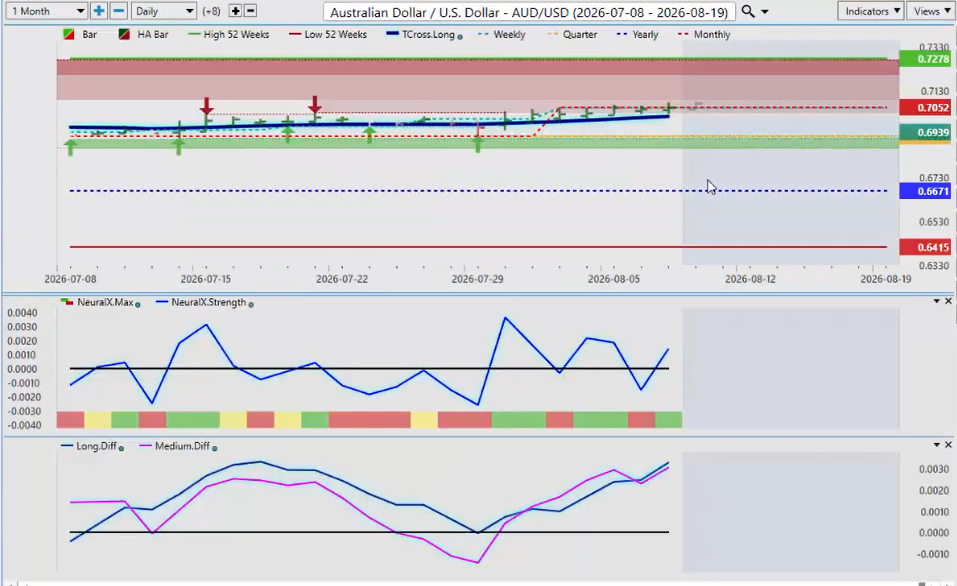
Now looking at the Aussie going into next week, once again, the Aussie is been one of the strongest currencies in 2026 along with the Kiwi, but the Aussie has been the stronger one. So we’re holding very slowly along that D cross long 7010. We need to hold about that and equity markets again will play a big part with that Aussie currency.
Uh so if those if the S&P or the Q’s the SPY the the the global Xstacks if they all tank that will pull the Aussie down regardless of data etc. the inner market correlation is very positive the Aussie to the equity markets very sensitive correlation so again that’s what we see in the VP software using those 31 inner markets uh to gauge the target market so again be very careful but the main thing is guys know your levels right.
Dollar/Yen
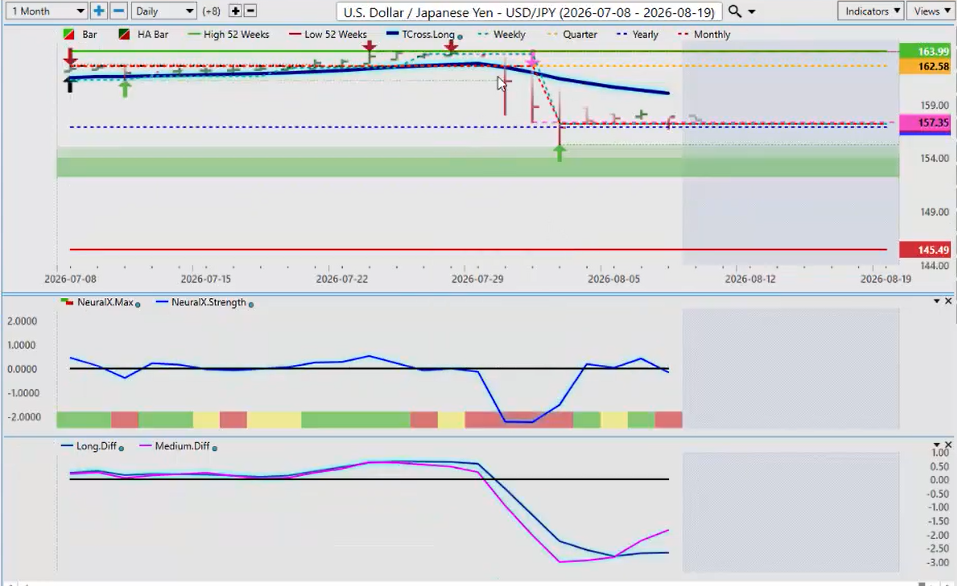
Now the dollar yen the dollar yen after their uh little intervention stunt once again it’s not working guys there is no sellers down here and you’ll notice exactly where the market is actually stopping. We have not closed below the calendar yearly opening price and you can quietly see buyers stepping in all along here last week.
So remember guys, the primary trend we try and use that we try and use the the calendar yearly opening price to determine that that’s 156.88. So our retracement point would be back to the T-Cross Long at 1609. But again, in my respectful opinion only, this is a mess that was created by the Bank of Japan when they verbally attempted to intervene uh back in 2020.
Pre COVID hits, the Fed starts hiking. Next thing you know, the Bank of Japan is in a checkmate position and that brought us all the way up back up to the 160 level on this pair and they are desperate to strengthen their currency. so much that they’re even have the US Fed trying to help them out by also verbally intervening. But as you can see uh the line in the sand is 15658 that calendar yearly opening price.
Watch that area very closely guys. If we cannot get through that we are going higher again.
Now bringing in a couple of stocks and ETFs into the weekly to get a very a more balanced uh AI weekly outlook. So, we look at some commodities, we look at some stocks, some currencies, ETFs.
SPDR Insurance S&P ETF ($KIE)
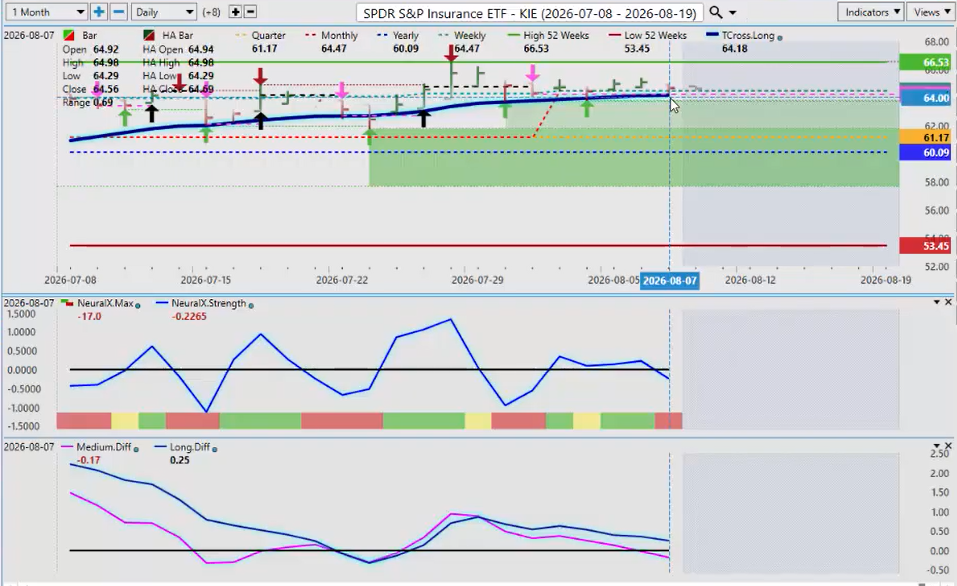
So, the S&P, the Spdr S&P ETF is looking pretty decent here. Uh, now what I’m seeing is we’re we’re we’re firmly above the yearly opening price. We’re sitting right on the T-Cross Long going into next week’s trading because once again here, guys, we’re this is an outlook, not a recap of something that’s already taken place.
We’re showing the power of the VP software. And again that T-Cross Long is a big level 6418. Now on this one here uh and again on this um particular ETF I believe we have a target on this for next week or this month for approximately 6772. So we need to hold above that T-Cross Long. the yearly opening price in my respectful opinion again only uh I would not want to be stopped out anywhere between the T-Cross Long and the $60 a share mark with a strong seasonal pattern that occurs in the month of uh August.
Now with some of these patterns, they can form more towards the end of the month, the middle of the month. But there is a signal forming here. And again, this is a corrective move lower from the hacken sheet with the predicted data back down to the T-Cross Long. But again, the primary trend is up, guys. We’re above the T-Cross Long. We’re above the yearly opening price. This is a corrective move lower.
So we can use that potentially to get into long trades for next week.
TJX Companies ($TJX)
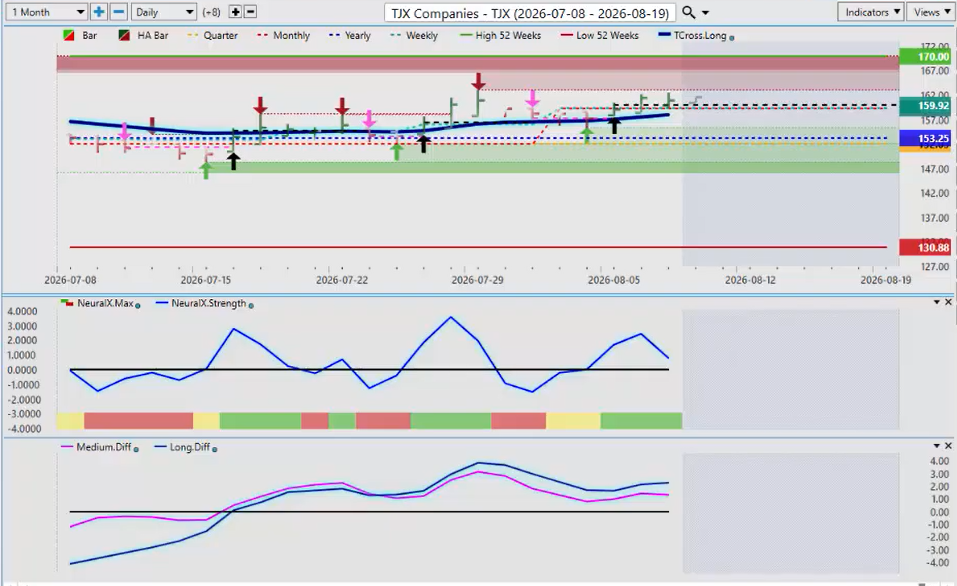
Now TJX companies a very very rocksolid company here a newly formed signal. You can see that we’ve closed above the T-Cross Long two days in a row. Then we have a hackenashi a predicted hackenashi candle is formed while the market is above the yearly opening price and the T-Cross Long.
This trade looks quite good going for this particular month with a potential target of 17708. So again, when we look at that, our predicted differences, we meaning we have a a medium and a long-term crossover to the upside. Neural index is still pretty good. Neural index strength is a little concerning, but it’s corrective in nature.
So we identify where a premium entry point would be with the VP software, and that would be the T-Cross Long at 15806. But again, we could see uh if things get better on the opening, we could see this thing move up quicker. Uh but it will still be affected by the uh by the indices.
And once again here, guys, when we’re looking at talking about stop-loss placement, we we we don’t want to put a stop anywhere between the current market price and the calendar yearly opening of 15325. So, not a bad looking trade for next week, and we’ll see how that one turns out.
Ascendis Pharma ($ASND)
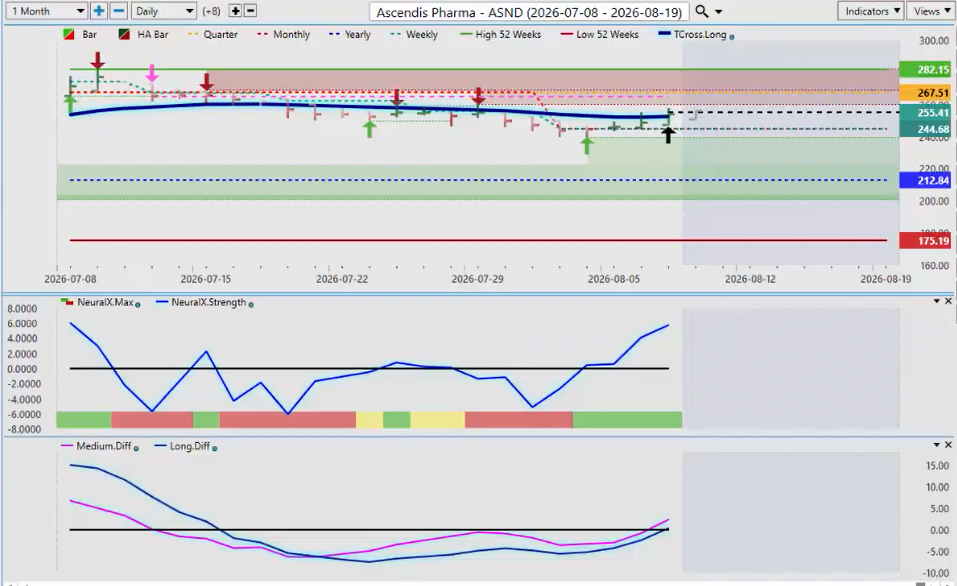
Now on a higher volatility stock. Now this one here ASND. This is a a very choppy uh stock but a newly formed signal as in the VP software has formed on Friday evening on the update. Now this is our first day crossing back above the T-Cross Long. We have a medium-term and a long-term crossover. We have the neural index and the neural index strength rising. We’re above the calendar yearly opening price at $212.84 and we have a potential target here of $294 per share by month end.
So again, these are this is a a premium potentially a premium uh setup here. But again, we’ll know if it’s going to work or not. We need to keep advancing and stay above that very important T-Cross Long of 25244.
So with that said, this is the VantagePoint AI Market Outlook for the week of August the 10th, 2026.


