


Hot Stock Snapshot was created for one purpose: to help traders quickly understand why a stock from our Hot Stocks Outlook is moving, what themes are driving it, and whether the trend deserves attention. In just a few charts and a few minutes, we isolate the essential story behind the price action. Not the noise. Not the endless opinions. Just the facts, the momentum, the capital flows, and the catalysts that matter. Every Snapshot is designed to answer the most important question in speculation: Who is winning, and why? Because in markets, opportunity rarely arrives with a formal invitation. It reveals itself first in performance.

There are comeback stories in the market, and then there are companies attempting financial open-heart surgery while traders watch in real time. Digital Turbine ($APPS) fits squarely into that second category.
The company operates in mobile advertising, app distribution, and mobile monetization. In plain English, Digital Turbine helps app developers, advertisers, wireless carriers, and smartphone makers get applications into consumers’ hands and monetize user activity. If you have ever opened a new smartphone and noticed preloaded apps, targeted app recommendations, or mobile advertising placements, you have already experienced pieces of their ecosystem.
What many traders may not realize is that three things make this company unusually interesting right now.
First, this is not a small speculative story anymore. Even after years of pressure, the company still generates hundreds of millions in annual revenue. Second, mobile advertising has quietly become a battleground where AI, personalization, and customer acquisition costs increasingly matter. Third, this stock has transformed into something Wall Street often loves: a deeply damaged former leader attempting a turnaround.
The revenue and earnings picture explains why this story is so controversial.
Revenue peaked near $747.6 million in 2022 before falling to $490.5 million in 2025. Earnings deterioration has been even more severe. Profits of $35.5 million in 2022 became losses of $420 million in 2024 and another $92 million loss in 2025. Projected 2026 revenue improvement toward $565 million suggests stabilization, but projected losses remain.
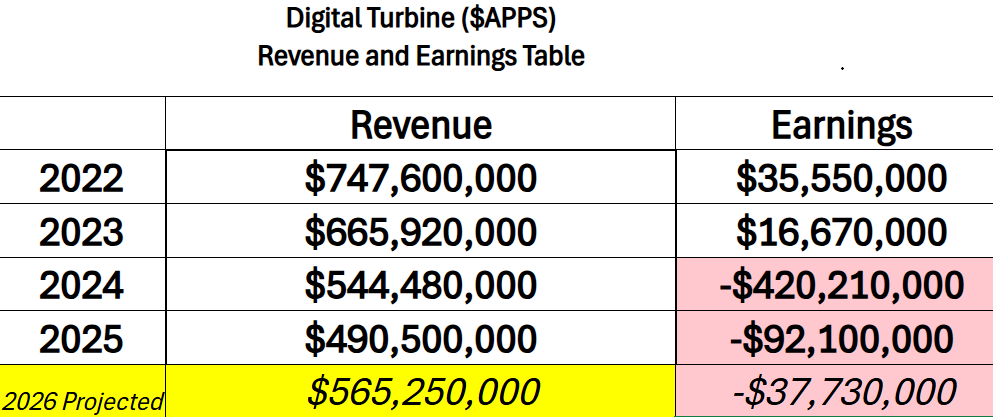
The important takeaway for traders is simple: this is not currently a healthy earnings story. It is a recovery story. Recovery stories can become some of the market’s largest winners because expectations start so low.
Performance versus the S&P 500 Index tells an even more dramatic story.
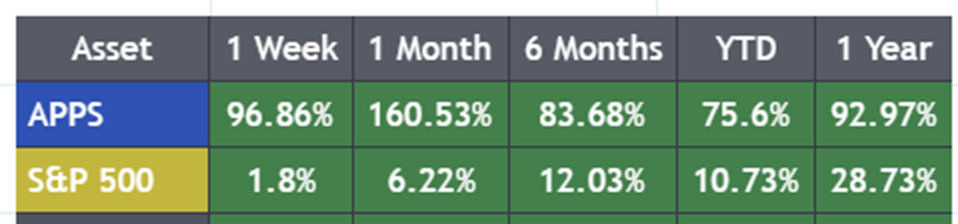
Over one week, $APPS gained nearly 97% versus 1.8% for the S&P 500 Index. One month performance exploded to 160.5% compared with 6.2% for the broader market. Year to date, $APPS has returned 75.6%, crushing the 10.7% gain in the S&P 500 Index.
This type of outperformance rarely occurs by accident.
Markets are forward looking. What traders appear to be pricing in is not today’s financial condition. They are pricing in a possible future where revenue bottoms, losses narrow, and the business becomes investable again. Whether that future arrives remains uncertain. What is clear is that institutions are treating this as a re-rating event.
The best-case scenario chart reveals why momentum traders are paying attention.
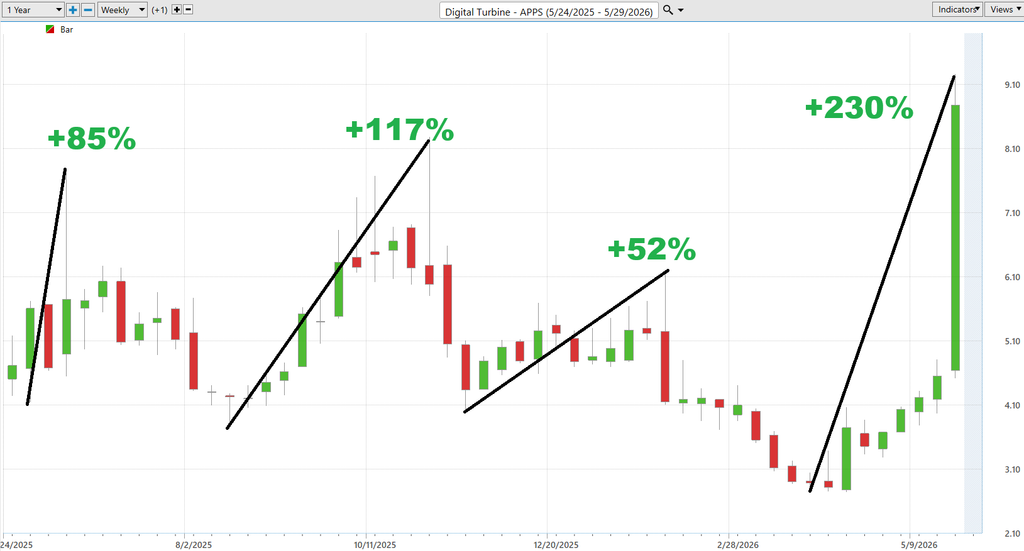
Historically, major upside runs in $APPS produced gains of approximately 85%, 117%, and 52%. The current move already stands near 230% from recent lows. That statistic cuts both ways.
On one hand, momentum this powerful can persist far longer than expected because short sellers become forced buyers and institutions chase performance. On the other hand, traders should recognize they are no longer buying an undiscovered stock. They are participating in an already crowded momentum move.
The unique insight here is psychological. Stocks moving this aggressively stop trading on fundamentals temporarily and begin trading on positioning.
The worst-case chart offers an equally important warning.
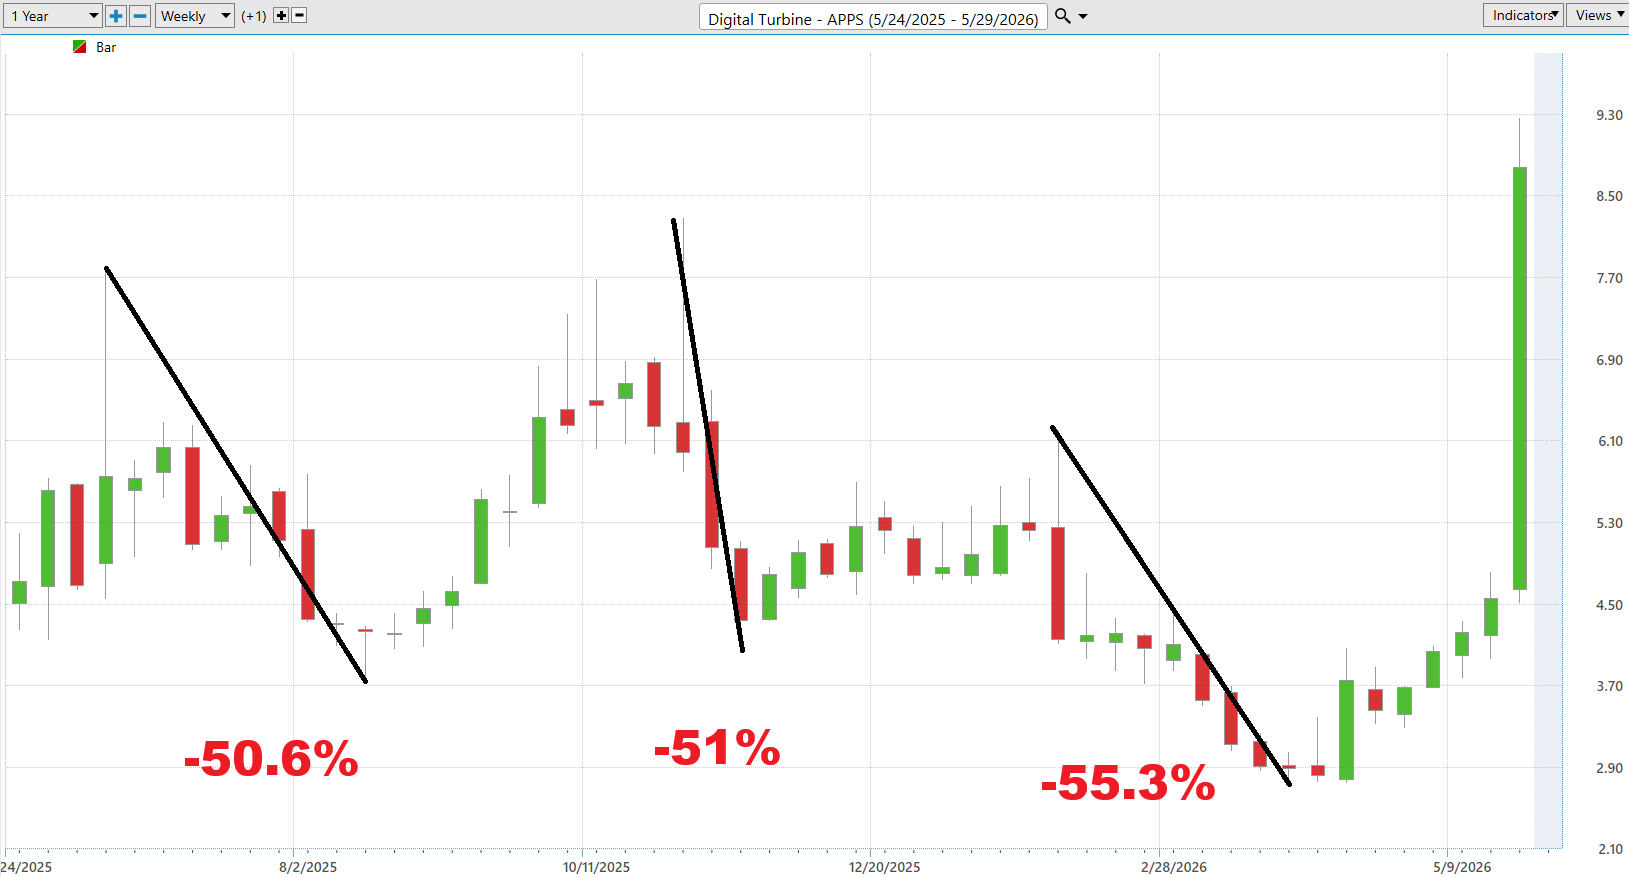
Prior downside phases produced declines of 50%, 51%, and 55%. That means history suggests this stock is entirely capable of extreme reversals.
This is why recovery stocks can create both fortunes and disasters.
The key risk is not simply earnings. It is expectations. Once expectations rise rapidly, disappointing results become expensive.
The predictive blue line analysis remains constructive.
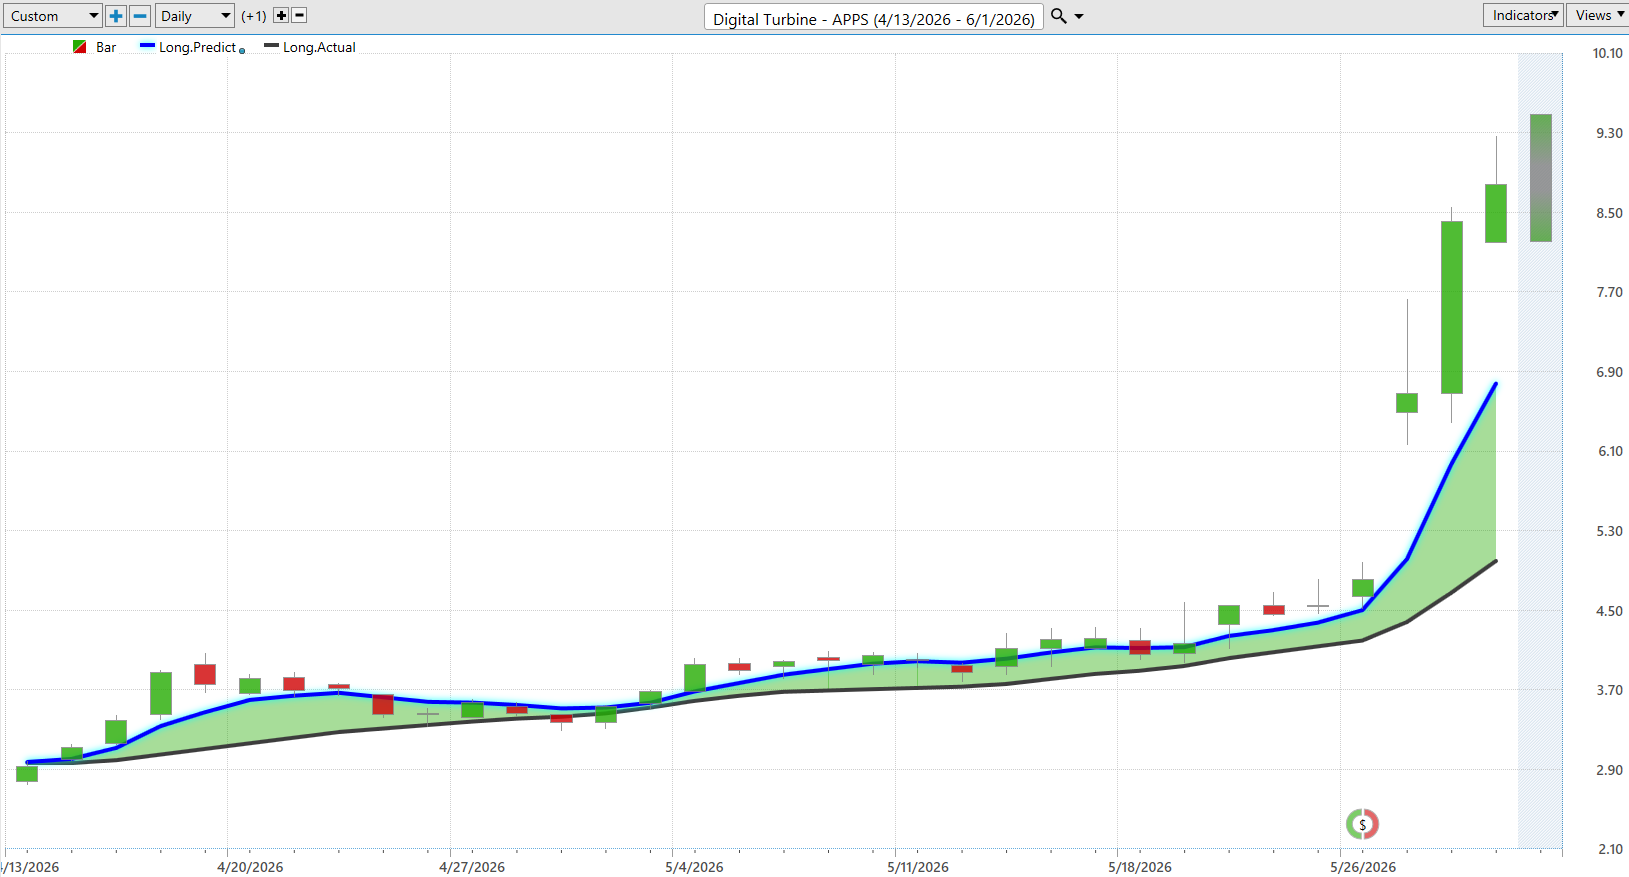
The forecast line continues rising sharply above actual price behavior, and the slope acceleration during recent sessions suggests momentum remains intact. More importantly, the separation between prediction and actual trend continues widening rather than compressing.
Big picture: predictive momentum still favors upside continuation.
The Neural Index reinforces that message.
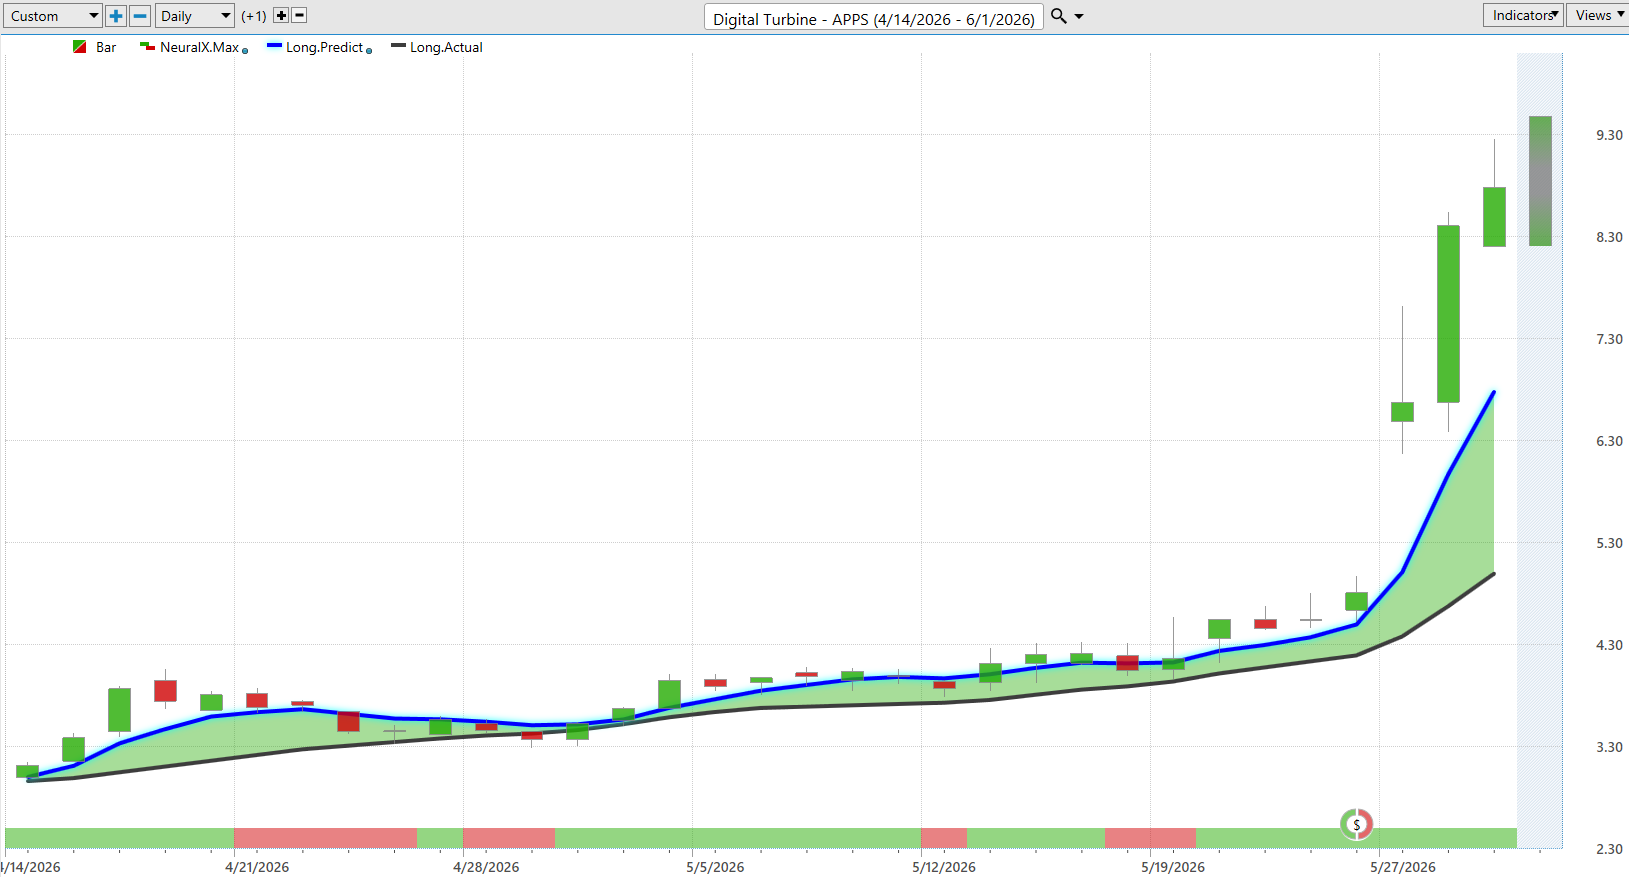
Recent readings remain overwhelmingly positive, with sustained green signals dominating the indicator. That tells traders that short-term market conditions continue favoring buyers rather than sellers.
No indicator predicts the future perfectly. But when predictive trend signals and momentum align, traders typically pay attention.
Putting everything together, $APPS represents one of the market’s more fascinating paradoxes.
Fundamentals remain damaged.
Profitability remains elusive.
Yet price behavior suggests institutions increasingly believe the worst may already be behind the company.
For traders, this becomes less about whether the company was successful yesterday and more about whether improvement continues tomorrow.
Ready to learn more about forecasting stocks and options days before anyone else with up to 87.4% proven accuracy? Attend a FREE LIVE CLASS.
Let’s Be Careful Out There.
It’s not magic.
It’s machine learning.
THERE IS A SUBSTANTIAL RISK OF LOSS ASSOCIATED WITH TRADING. ONLY RISK CAPITAL SHOULD BE USED TO TRADE. TRADING STOCKS, FUTURES, OPTIONS, FOREX, AND ETFs IS NOT SUITABLE FOR EVERYONE.IMPORTANT NOTICE!
DISCLAIMER: STOCKS, FUTURES, OPTIONS, ETFs AND CURRENCY TRADING ALL HAVE LARGE POTENTIAL REWARDS, BUT THEY ALSO HAVE LARGE POTENTIAL RISK. YOU MUST BE AWARE OF THE RISKS AND BE WILLING TO ACCEPT THEM IN ORDER TO INVEST IN THESE MARKETS. DON’T TRADE WITH MONEY YOU CAN’T AFFORD TO LOSE. THIS ARTICLE AND WEBSITE IS NEITHER A SOLICITATION NOR AN OFFER TO BUY/SELL FUTURES, OPTIONS, STOCKS, OR CURRENCIES. NO REPRESENTATION IS BEING MADE THAT ANY ACCOUNT WILL OR IS LIKELY TO ACHIEVE PROFITS OR LOSSES SIMILAR TO THOSE DISCUSSED ON THIS ARTICLE OR WEBSITE. THE PAST PERFORMANCE OF ANY TRADING SYSTEM OR METHODOLOGY IS NOT NECESSARILY INDICATIVE OF FUTURE RESULTS. CFTC RULE 4.41 – HYPOTHETICAL OR SIMULATED PERFORMANCE RESULTS HAVE CERTAIN LIMITATIONS. UNLIKE AN ACTUAL PERFORMANCE RECORD, SIMULATED RESULTS DO NOT REPRESENT ACTUAL TRADING. ALSO, SINCE THE TRADES HAVE NOT BEEN EXECUTED, THE RESULTS MAY HAVE UNDER-OR-OVER COMPENSATED FOR THE IMPACT, IF ANY, OF CERTAIN MARKET FACTORS, SUCH AS LACK OF LIQUIDITY. SIMULATED TRADING PROGRAMS IN GENERAL ARE ALSO SUBJECT TO THE FACT THAT THEY ARE DESIGNED WITH THE BENEFIT OF HINDSIGHT. NO REPRESENTATION IS BEING MADE THAT ANY ACCOUNT WILL OR IS LIKELY TO ACHIEVE PROFIT OR LOSSES SIMILAR TO THOSE SHOWN.


