




Welcome to the Artificial Intelligence Outlook for Forex trading.
VIDEO TRANSCRIPT
VantagePoint A.I. Market Outlook
Okay, hello everyone and welcome back.
My name is Greg Firman and this is the VantagePoint AI Market Outlook for the week of August the 17th, 2026.
WISDOMTREE U.S. DOLLAR BULL FUND ($USDU)
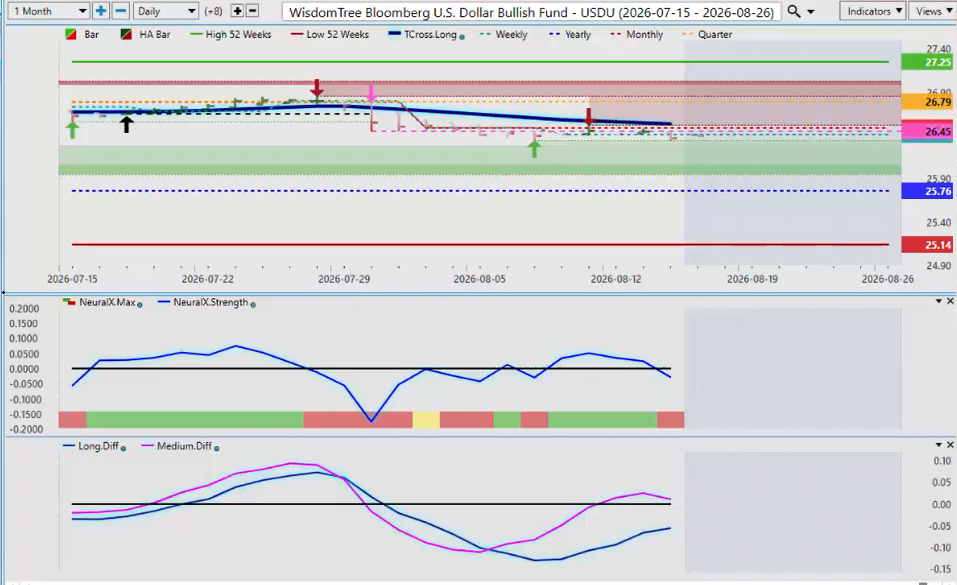
Now, as we approach the end of summer trading, we are going to likely see the dollar begin to strengthen towards the end of the month, but we’re not quite there yet.
So, beginning with the WisdomTree U.S. Dollar Bull Fund, USDU, I believe one of the better ways to gauge the broader U.S. dollar strength and weakness. We can see we’re still positive on the year above 25.76.
The VP indicators are mixed. We’ve had a corrective move higher but failing below that very important T-Cross Long coming in at 26.53.
So to start the week, we will likely start with the dollar weaker, but be careful near the end of the week as we could see the dollar start to turn around.
Now again, the Neural Index down. We have a medium-term crossover to the upside but not a long-term one. So again, for the dollar to regain its uptrend we need to get back up above the T-Cross Long at 26.53.
GOLD ($XAU/USD)
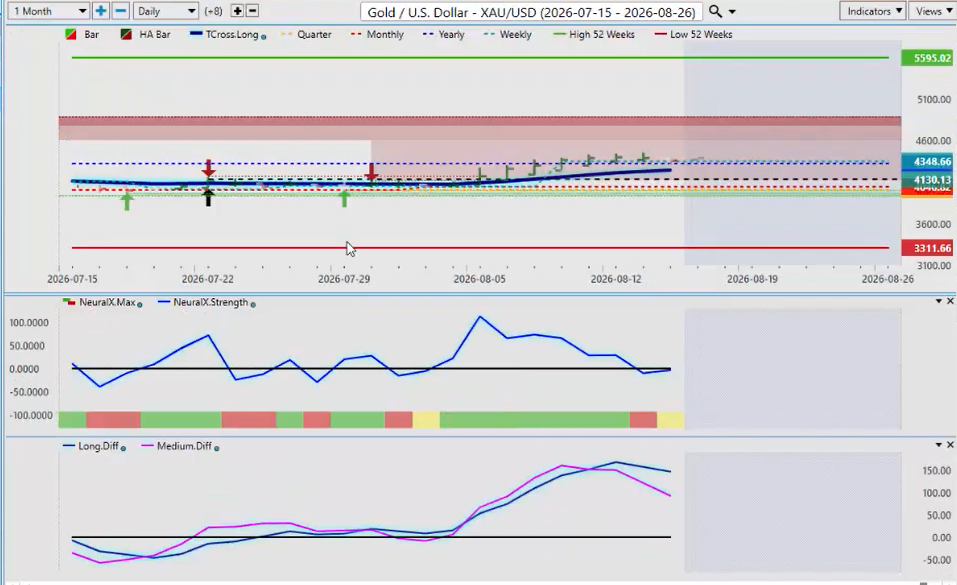
Now this has given a boost to gold, not surprisingly. We can see back here in July we got an early Heikin-Ashi signal using predictive data in that Heikin-Ashi signal.
Now the main difference with Heikin-Ashi versus Japanese candlesticks is that there’s only three in Heikin-Ashi: up, down and a doji.
So again, we are not getting a sell signal yet, but what’s very interesting here is that we are turning positive on the calendar year. So again, this is both a good thing and a bad thing. If we can’t hold above the yearly opening price at 4325, then we are going to turn lower.
Now historically gold has not done well in August or September. The main months to buy gold would be October through early January. Same as silver.
So again, I’m watching these VP indicators very closely. That MA Diff Cross is a big warning sign. If nothing else, we are going to correct lower to the T-Cross Long at 4243.
So again, seasonal patterns really matter here, guys. And the seasonal pattern in gold is not overly strong in August or September. So always keep that in mind.
But if we can’t stay positive on the calendar year, we are likely to move lower back down towards the monthly, quarterly opening price between 4,000 and 4,046.
GLOBAL X ($DAX)
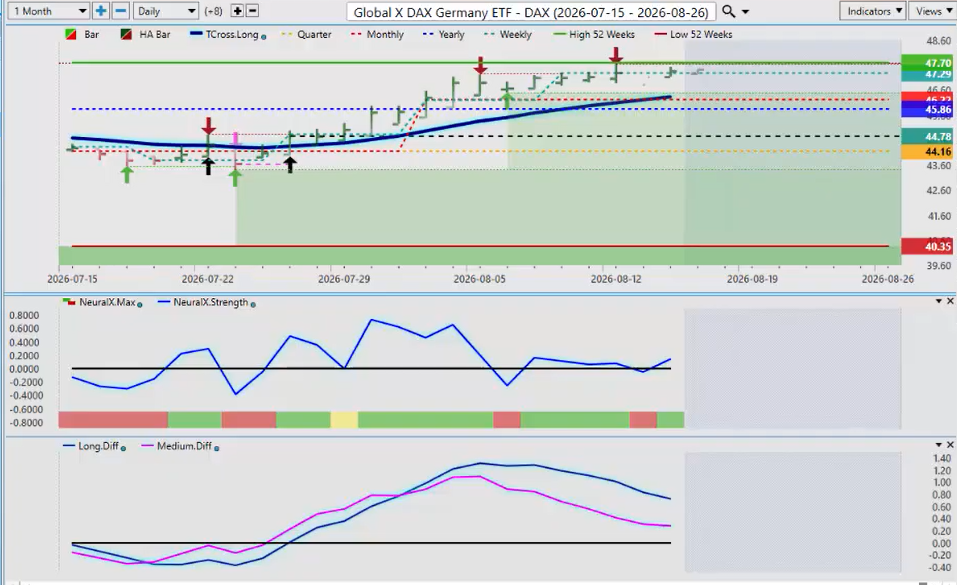
Now, looking at some of our main equities, starting with the Global X DAX. Now, we’ve made another 52-week high.
The DAX is following the Euro/U.S. pair higher, but there is a difference here. The DAX is positive on the calendar year. The Euro/U.S. pair is not. So it’s extremely likely that this is a false break higher.
And the probability of failing up here at this new 52-week high is, again, very, very likely. Nothing is 100%. But if nothing else, guys, I think we see a retracement back to our T-Cross Long at 46.34.
That is indirectly supported. Our Predicted Differences, meaning the strength of the medium-term and long-term crossover, are both pointing down.
Now, the Neural Index is still saying we have some strength to start the week, but if this is going to sell off, guys, it will be on Tuesday.
NASDAQ ($QQQ)
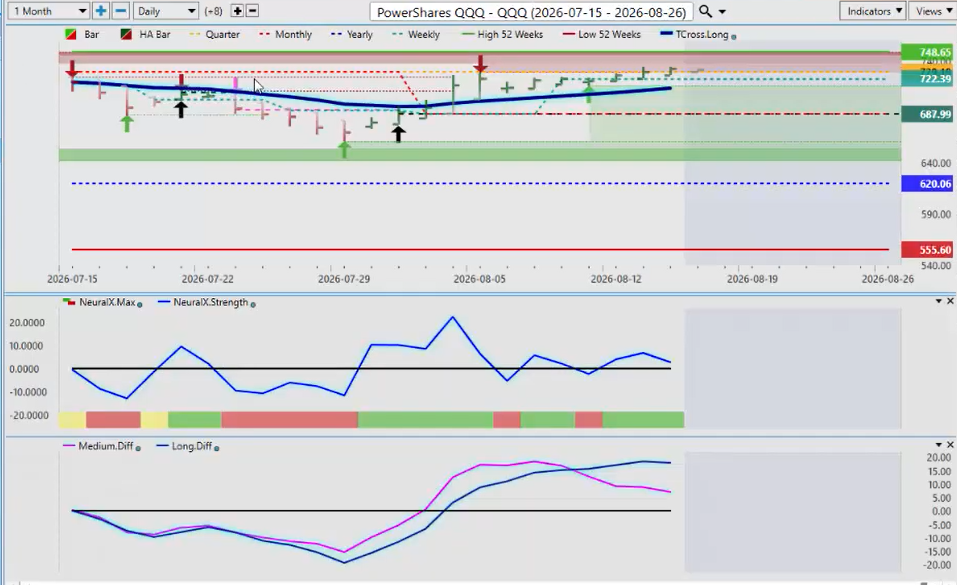
The same thing would apply to the Qs and the SPYs. They’re already showing signs of weakness here on Friday.
We’re extending higher. We’re above our T-Cross Long and our yearly opening price. But again, a little bit overextended.
And what is concerning here is this pink line crossing the blue line. That’s the medium-term strength against the longer-term strength. And that is weakening to the downside.
So that’s telling me the probability Tuesday, Wednesday, we come back to our T-Cross Long. That level coming in at 17,713.51 is very, very likely.
Now that would be a retracement. If we can hold above the T-Cross Long, then we can look for longs again. But if we can’t, then we are likely coming lower because again, September is not a good month for equities anymore than it’s a good month for gold.
SPDR S&P 500 ETF ($SPY)
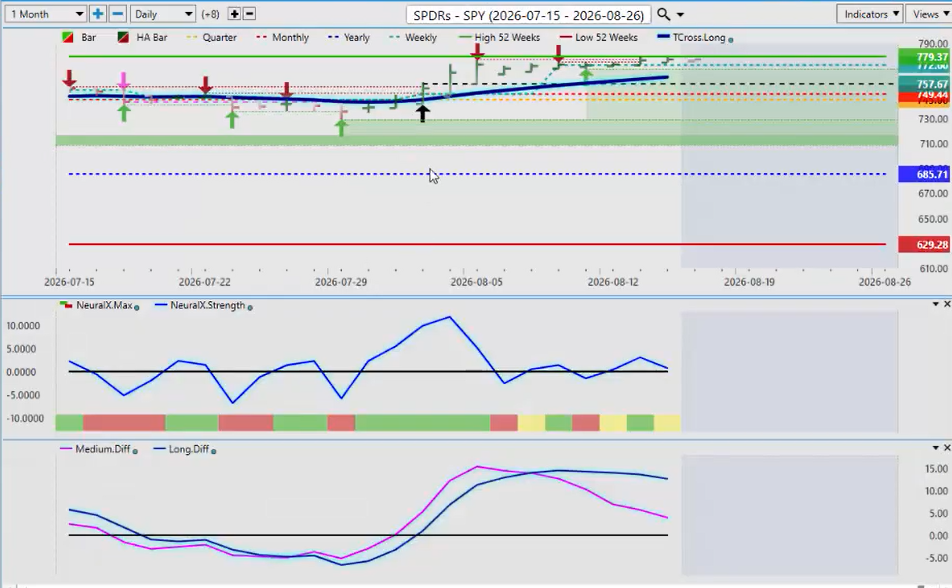
The SPYs here, when we look at the SPYs a little closer, we can see the same thing, a new 52-week high. But now we’re starting to stall out up here.
And what we look for now in our VP software is a contrarian signal. And there it is, the medium-term crossing the long-term diff, meaning that the medium-term strength to the upside is weakening. That’s what we look for.
So, our retracement point for next week, our T-Cross Long, will come in at 762.79.
Watch that area very closely. That’s exactly where the bulls and the bears are likely to fight it out.
BITCOIN ($BTC/USD)
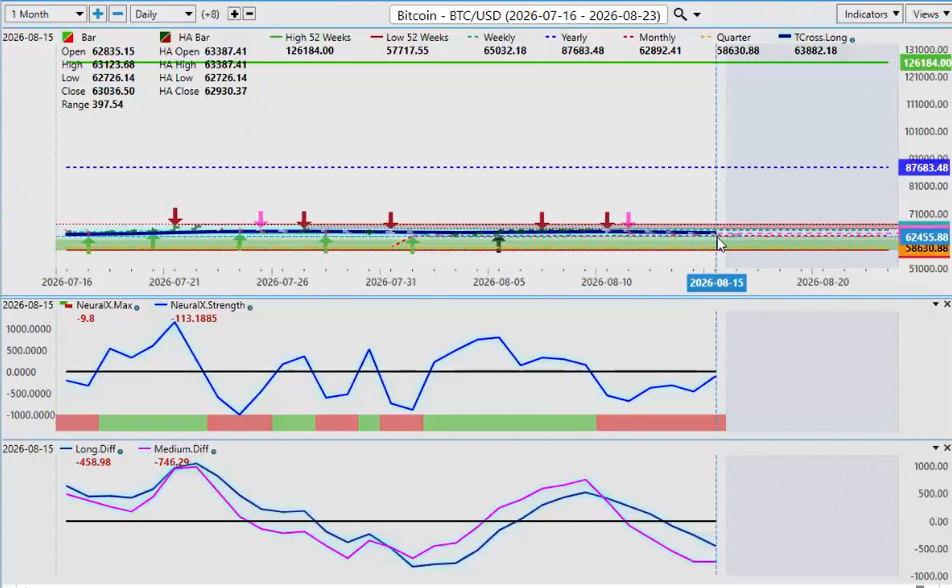
Now, when we look at Bitcoin, once again, Bitcoin basically running flat here.
Now, we’re in the fourth year. We have three years up, one year down, three years up, one year down.
This is the down year. So, I do anticipate that Bitcoin is going to spike. There’s a lot of chatter out there that Bitcoin’s going to 10,000, Bitcoin’s going to crash, Bitcoin is done. Don’t buy into any of that nonsense, guys.
It’s following a cycle that’s been going on for 10, 15 years now. And again, we’re in that fourth year, which is a down year. We would actually be looking in 2027 and three years going forward as more of a bull market, is what I would look for.
And again, this selloff in Bitcoin is nothing compared to the last one where we dropped into the 15,000 area.
So again, I believe that Bitcoin struggles like it always does in the month of August and probably the first two weeks of September. And then very quietly you’re likely to see the buyers come back in towards the end of mid-September to late September. Then in October we start moving back up.
That’s what we would look for. That’s the seasonal pattern that’s very well defined in Bitcoin.
But again, the Bitcoin bears, they always come out whenever Bitcoin moves lower. But it’s been a buying opportunity every single time.
So keep that in mind, guys. Nothing is for sure in trading. But there is a pattern here and that’s what we go by.
Now when we look at our main four forex pairs, the Euro/U.S., the British pound, the Aussie/U.S. and the dollar/yen, these are your main drivers in the forex market.
EURO/U.S. DOLLAR ($EUR/USD)
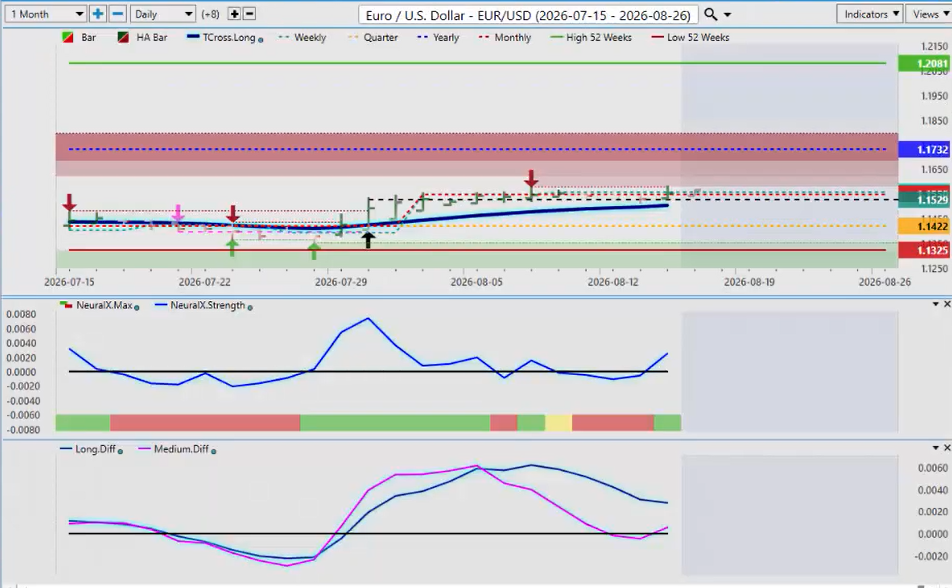
So looking at the Euro, we did have a Heikin-Ashi signal back here at the end of July. We crossed over the T-Cross Long, but you can see that we’ve really been stalling up here.
We remain negative on the calendar year. So, if the Euro is to drop, then the probability is the DAX will also follow it lower. There’s a very high probability of that as long as we’re below 1.1752.
So, if you’re trading the Global X DAX or the DAX futures, then you want to keep a very close eye on the Euro/U.S. pair.
But for now, you can see we’ve got a mixed signal here. We had a medium-term crossover that was corrective in nature, and now it’s turning back up.
Now the economic data out of the U.S. this week was a little bit mixed. CPI was at consensus, but I believe the PPI was a little bit hotter. Nothing major, but again, I think the U.S. dollar will follow its normal patterns.
The U.S. fiscal year end is September 30th and almost every single year I see significant dollar strength in the month of September because the currency markets are not like the stock markets, guys.
People are required to buy fiat currency. Nobody needs to buy a stock, a commodity or an options contract, but they must buy fiat currencies to settle trade balances, pay government employees, pensions, all these things. It’s a requirement.
So, when the U.S. closes their books for 2025, then that is going to be in the month of September. So, I do anticipate dollar strength is just around the corner.
So again, we would have to break 1.1732 and stay above that level if the Euro has any chance of breaking higher.
BRITISH POUND/U.S. DOLLAR ($GBP/USD)
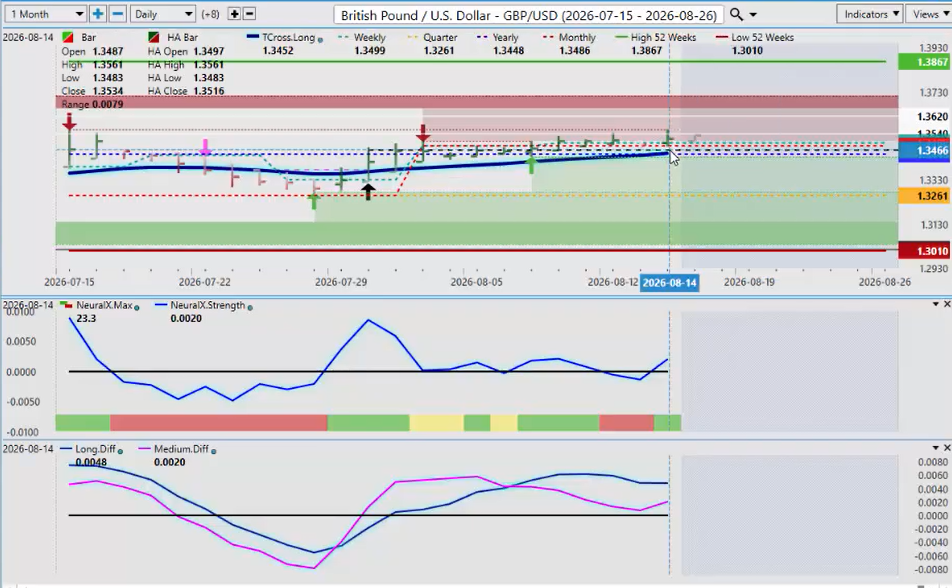
The British pound is a very, very similar trade to the Euro/U.S.
You can see where this one is slightly stronger. We are above the yearly opening price and the T-Cross Long is at the exact same level, 1.3452, 1.3448.
We’ve held above it, but you can see we have a verified resistance high. That verified resistance high is coming in at 1.3506.
So, you can see whenever we kind of poke above that area, it tends to struggle. And we’ve closed above it.
But another way that we can play this is putting sell stop limit orders below the yearly opening price. So, if it mysteriously, which I suspect will happen in the coming weeks, breaks down below the yearly opening and the T-Cross Long, we have a sell stop order ready to go.
So, we target these very specific levels to get into these trades.
Right now, we’re still moderately bullish on this, but again, all of our support is sitting at one place, and that’s right in this 1.3452 area. So, watch that. You can buy up.
Again, I always like to give something to the bulls and the bears. The buyers, that’s where you want to buy at, and the sellers just below that area.
So, we target a very specific level because again, this is an outlook, guys, not a recap of something that’s already happened in the previous week. We’re looking forward into next week’s trading.
AUSTRALIAN DOLLAR/U.S. DOLLAR ($AUD/USD)
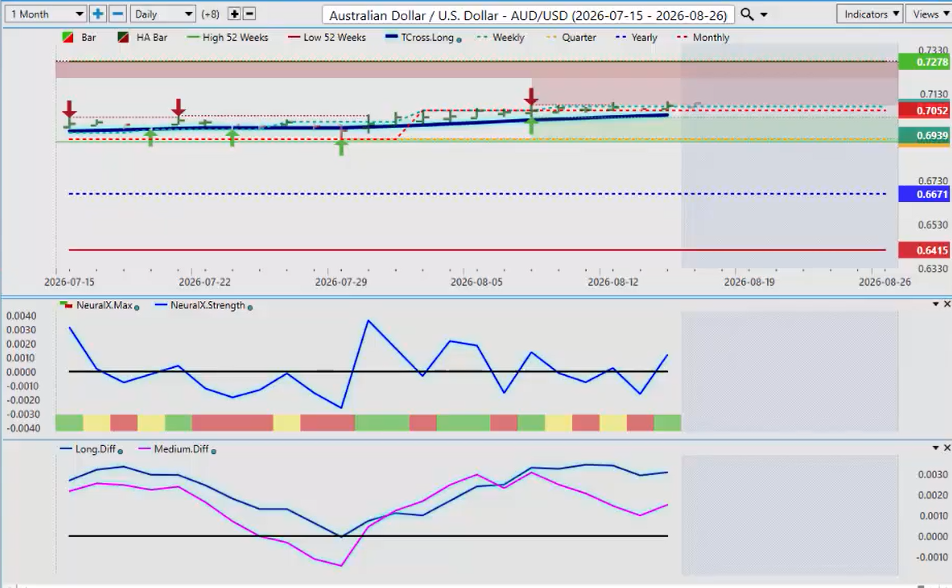
Now the Aussie remains one of the dominant currencies in the forex market against the U.S. dollar despite that previously high correlation to the Euro.
So for now the Aussie has been in a firm uptrend this entire calendar year, guys. So we’re holding above the T-Cross Long that’s coming in at .7033, and that is a critical, very critical level here for the Aussie.
Now, any correction lower here, which I think we will get in September, again, we would use that as a buying opportunity going into the year end and into 2027 because I still believe the Aussie is grossly undervalued at this particular level.
The VP indicators are supportive of longs here. But be careful again, know your levels, guys. The T-Cross Long that’s coming in at .7033 again. So, we need to watch that area very closely.
U.S. DOLLAR/JAPANESE YEN ($USD/JPY)
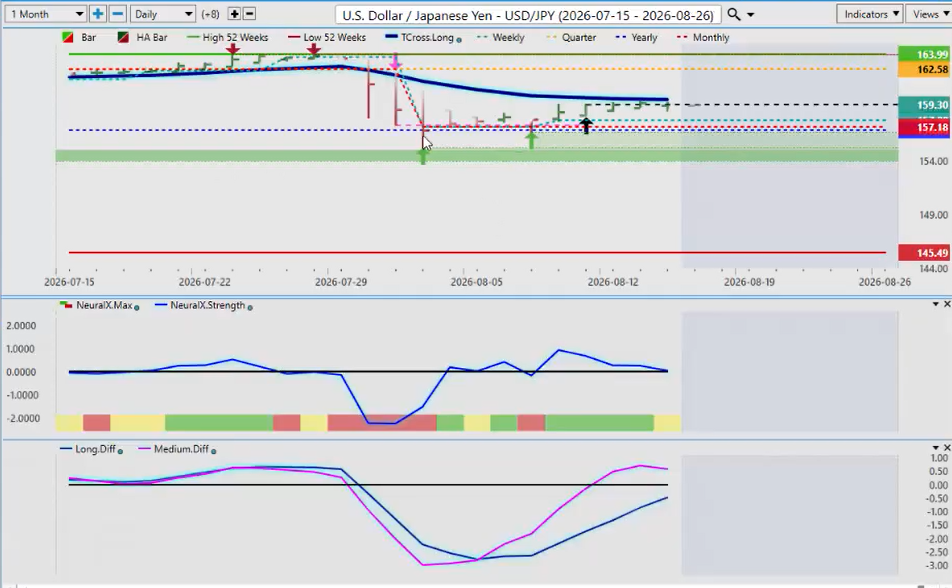
Now with the dollar/yen, again, as I’ve talked over the last few weeks, I don’t believe that they will be successful with intervention and the chart actually proves that theory.
The yearly opening price again is the critical level, 156.88. You can see that we are yet to close below that level.
They forced it down with the Bank of Japan with the assistance of the new Fed chair Kevin Walsh, but it was not successful.
Now we have a Heikin-Ashi buy signal coming off the yearly opening. So again, the T-Cross Long is our line in the sand, guys. 159.74, that’s the level we need to break and then the uptrend continues.
This is the strongest carry trade I’ve seen in 25 to 30 years. They are not willing to exit this carry trade, meaning long the dollar, short the yen.
This is a very high-paying carry trade to stay on the long side. So there is no reason yet to short this thing. Only if we get below the yearly opening price.
And I do believe with the assistance of the U.S. Fed, the Bank of Japan will be on the prowl again trying to strengthen their currency because they’re really taking a hit with it being up in this 158 area.
SPDR S&P INSURANCE ETF ($KIE)
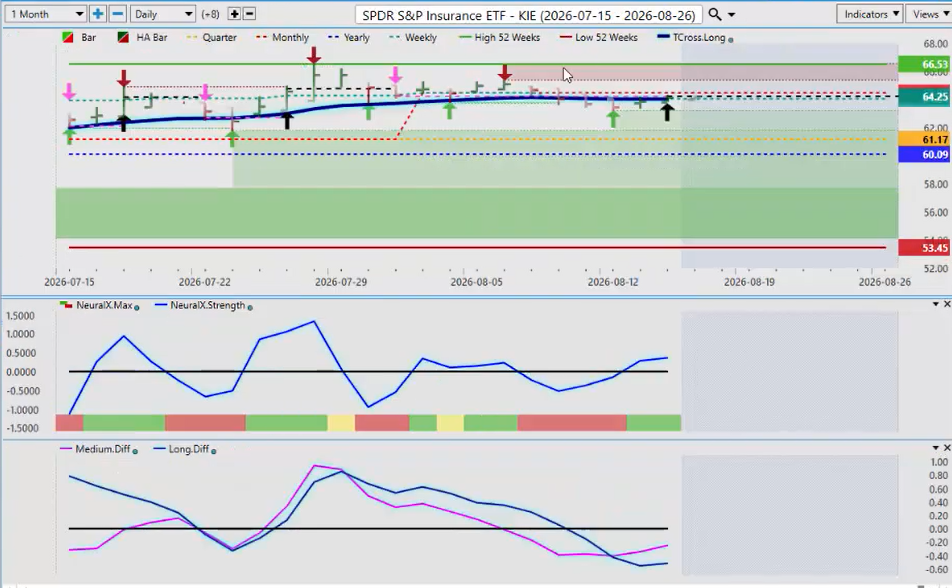
Now following up from last week, we’re going to look at the SPDR S&P ETF KIE.
Now again, a new Heikin-Ashi signal is forming and, as I discussed last week, as long as we’re above this yearly and the stacking of the quarterly opening price, which is 61.17, the yearly opening price at 60.09, this is providing a very, very powerful level of support.
So, I believe this trade is doing just fine, and we’re going to be looking for it to extend higher back towards our most recent 52-week high, which was set actually just last month here at the end of the month.
So, that tells me that this ETF does see strength towards the end of the month. So, could be a very good buying opportunity here right on the T-Cross Long, 64.06. That’s our key level.
Any stops, in my respectful opinion only, should be below 60.09. And again, we would be looking for a new 52-week high above 66.53.
TOTALENERGIES ($TTE)
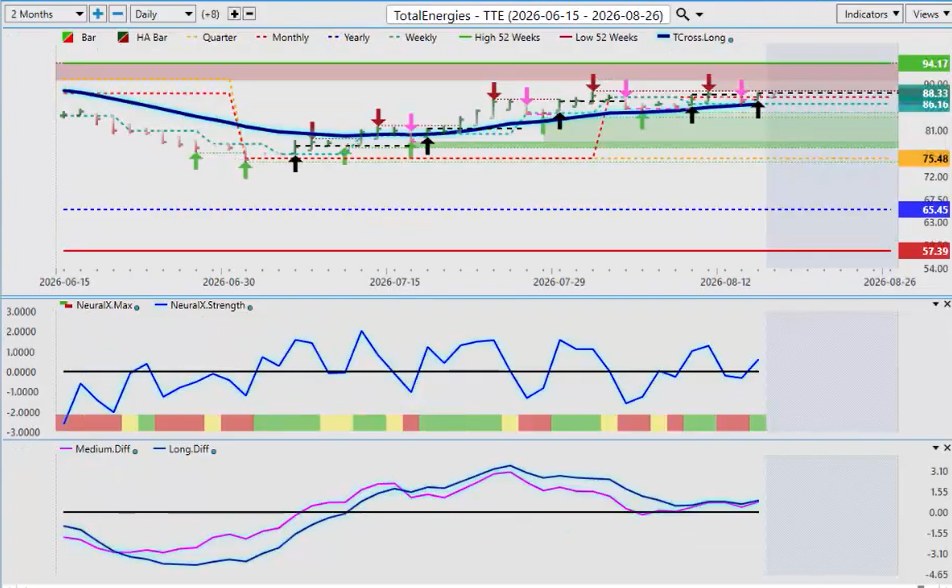
Now, on a side note here, we’ll do a couple of correlated stocks. One that’s highly, I believe, trading more correlated to the CAC 40, and then TotalEnergies, TTE, on the U.S. side.
Now again, this is a volatile stock, but this is actually what one of my favorite strategies is, using a reverse Heikin-Ashi strategy.
Meaning, whenever I’m above the yearly and the quarterly and the T-Cross Long, the Heikin-Ashi sell signal is usually wrong. Not necessarily wrong, but it’s showing a corrective move lower, not a new trend.
But you can see that the black Heikin-Ashi arrows, every one of these is correct. So we continue to build on that.
And usually when I see a Heikin-Ashi signal side by side while I’m above the T-Cross Long and the quarterly and the yearly opening price, the probability is the primary move is going to be to the upside.
So I believe we can start moving back up, potentially targeting back towards this 94 level.
But again, that T-Cross Long, 86.04, looks pretty good to start the week. Our Predicted Differences are above the zero line. Neural Index is positive.
And again, I’m not overly concerned that I’m this close to a 52-week high at the current time because structurally the trade still looks very good.
CORRELATED STOCK — EQUINOR ASA ($EQNR)
Now, VP has also identified a highly correlated stock to go with this. It’s a little bit cheaper.
Now the theory is here, if TTE goes up, then again ASA or EQNR will also go up. So you wouldn’t necessarily take both, but we identified the high positive correlation between these two companies.
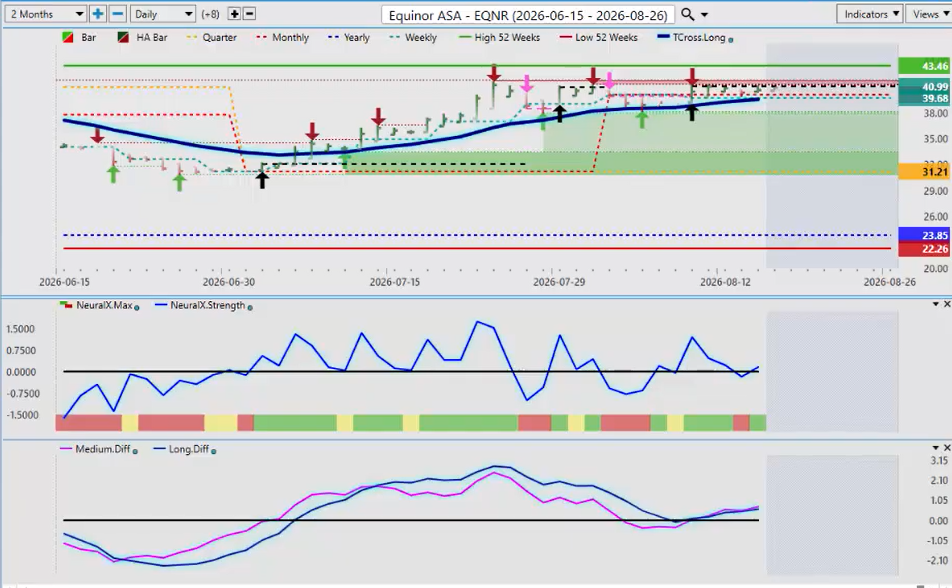
And again, you can see we’ve had a Heikin-Ashi buy, but each one of those Heikin-Ashi bars has been correct.
And in theory, the Heikin-Ashi sell signal has had some degree of accuracy, but people misunderstand that as a reversal sell signal when it’s just really telling us we’re correcting lower.
So again, the high of this bar right now is 41.22. I believe we’re going to break through that and go back up above 43.46. Very high probability. The indicators in VP are supporting that for now.
And again, I certainly wouldn’t recommend a stock down below 22, but I would just point out that this stock has fared pretty well over the last six months.
As you can see, we’ve run all the way up to the 52-week high and then come up actually a relatively shallow retracement, and now we’re starting to push back up.
So, the theory here would be that, okay, we’ve got a much lower high, and we’re likely going to go back up and make a new high above the most recent 52-week high coming in again, 43.46.
So, a reasonable trade there, but it’s sometimes good to show, believe it or not, one stock and another stock that is about 95% positively correlated to the original.
So, another interesting week coming. We are approaching the end of summer trade and it will be a welcome change going back into September.
September through December or January 1st is usually some of the best trading of the year, guys. And with that always comes opportunity when using the VP software.
So with that said, this is the VantagePoint AI Market Outlook for the week of August the 17th, 2026.