





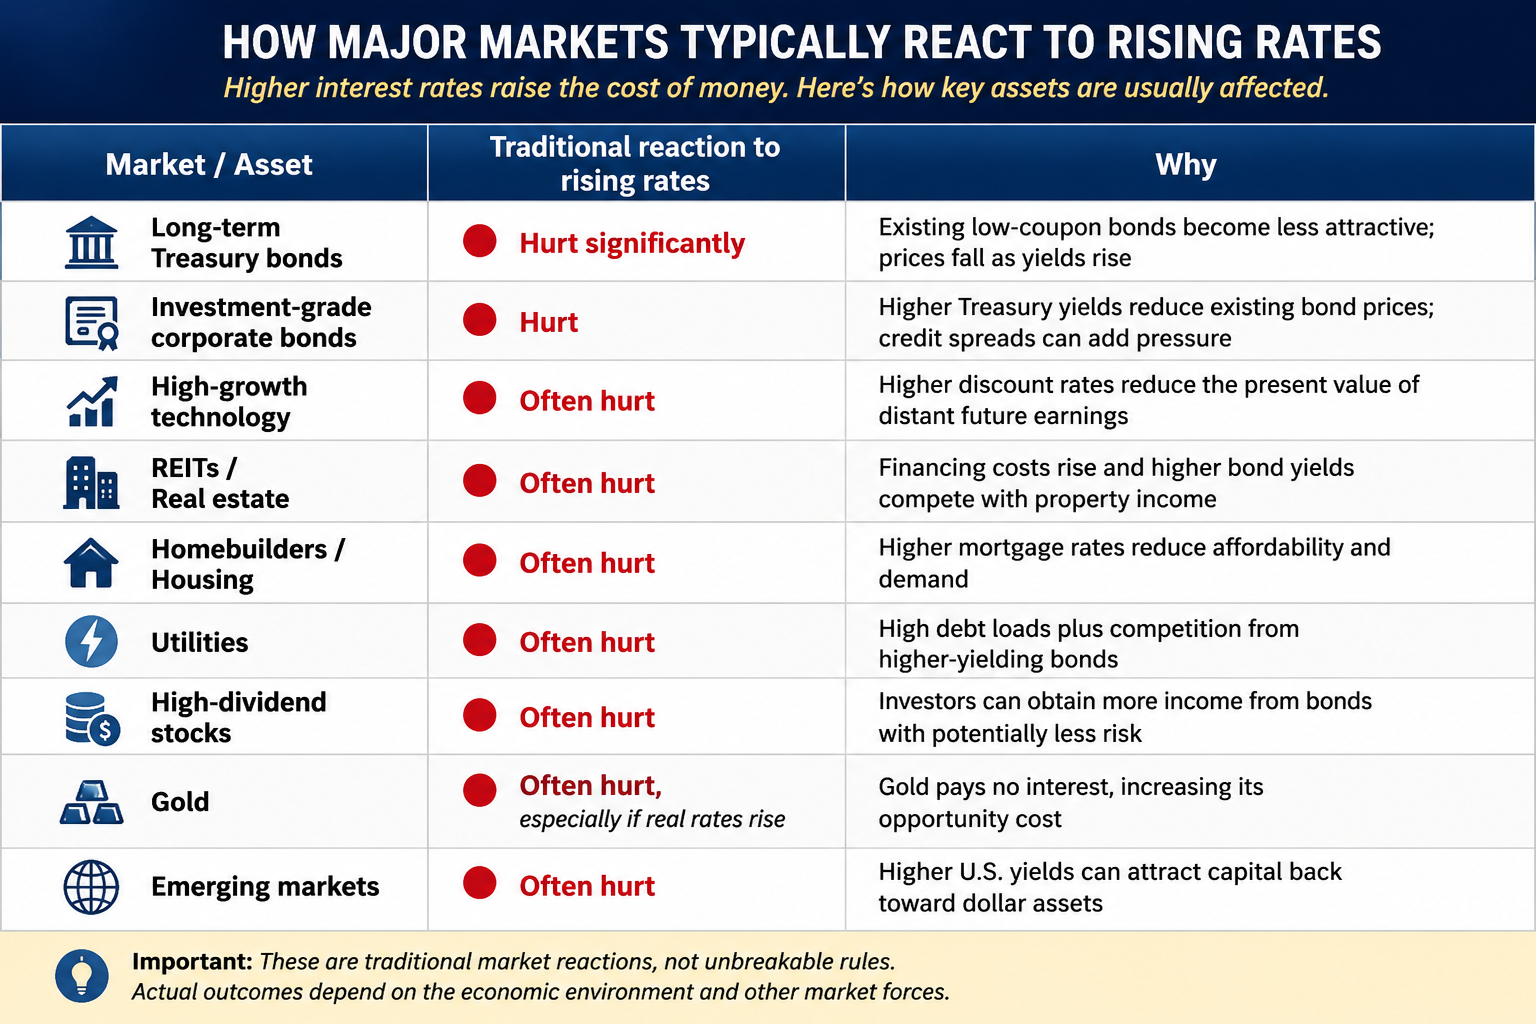
Most investors think they’re diversified because they own six different things with six different ticker symbols. Technology stocks. Utilities. REITs. Dividend stocks. Bonds. Maybe a homebuilder or two.
It looks wonderfully diversified right up until interest rates move sharply and everything starts heading for the same exit.
That’s when you discover diversification can be like ordering six different cocktails and finding out somebody poured vodka into every one of them.
Interest rates are the hidden ingredient in almost everything Wall Street serves. They influence what investors will pay for tomorrow’s earnings, what businesses pay to borrow, what families pay for mortgages, whether a dividend looks attractive, and whether investors want stock-market risk when Uncle Sam is offering a competitive yield.
You don’t own six different trades. You may own the same interest-rate trade six different ways.
The central question is simple:
How diversified are you if everything you own needs cheap money to prosper?
Traders shouldn’t merely ask, “What do I own?” They should ask, “What economic condition am I betting on without realizing it?”
Interest rates influence the availability and cost of credit throughout the economy, along with stock prices, bond prices, housing, and currencies.
Interest rates are financial gravity.
When money is cheap, gravity gets lighter. Businesses borrow cheaply, consumers finance houses and cars more easily, and investors become willing to pay higher prices for earnings expected far into the future. Falling rates also make cash and bonds less competitive, encouraging investors to take more risk.
Turn that process around and things get interesting. When rates rise, borrowing becomes more expensive and safe yields become more competitive. Suddenly the investor willing to accept a 3% dividend or pay an enormous multiple for earnings expected ten years from now has alternatives.
The company hasn’t necessarily changed.
The price of money has.
Stocks have their own version of duration. A mature business producing enormous amounts of cash today is different from one whose valuation depends on spectacular profits arriving years from now. Higher discount rates reduce the present value of those distant cash flows, which is why expensive growth stocks can become vulnerable when rates rise.
Real estate feels the same pressure. Higher Treasury yields can push mortgage rates higher, reducing what families can afford.
The house didn’t change.
The monthly payment did.
Utilities and REITs face another problem. Investors often own them for income, but suddenly that income has competition. If Treasuries offer substantially higher yields, investors have to ask why they should accept additional risk for only a modest increase in income.
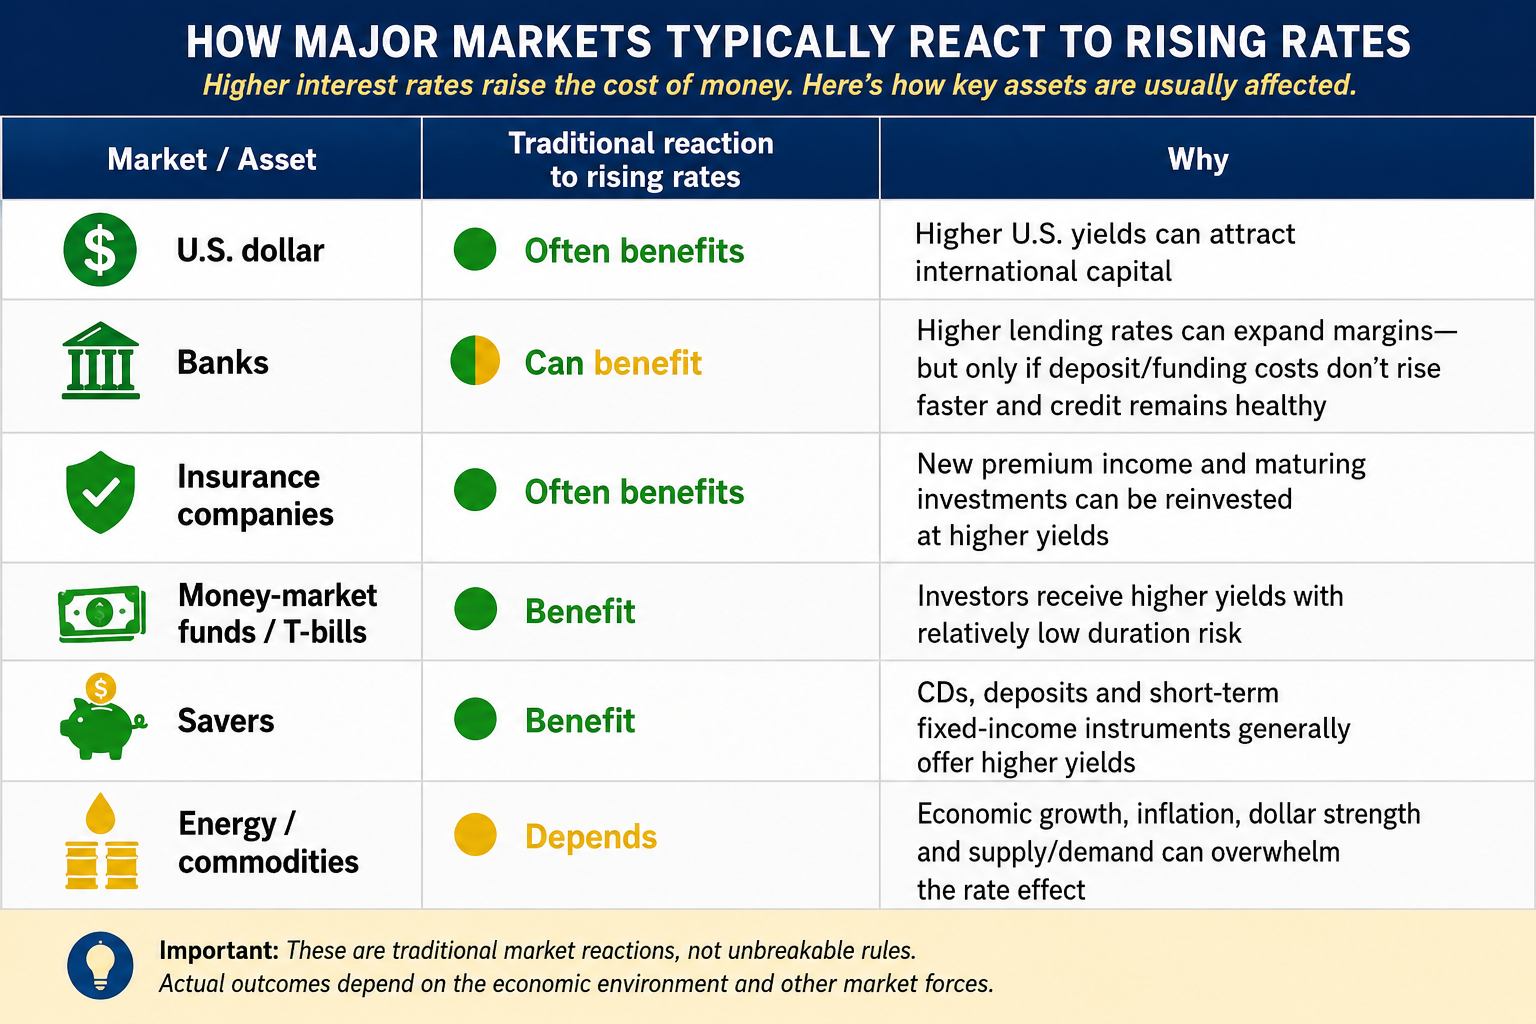
Yet none of these relationships is automatic. Banks can sometimes benefit from higher rates. Insurers can reinvest at better yields. Companies producing substantial current cash flow may become relatively more attractive than businesses depending heavily on cheap capital.
And history teaches us something even more important:
Why rates are rising matters.
Rates rising because growth is accelerating can be very different from rates rising because inflation or government borrowing is becoming a problem. Strong growth can support corporate profits enough to offset some valuation pressure.
But if investors are demanding higher yields because of inflation, excessive borrowing, or growing Treasury supply, long bonds, housing, and other rate-sensitive assets can come under pressure.
The same interest-rate move can carry very different information depending on what caused it.
That’s why asking, “What should I buy when rates rise?” is the wrong question.
The better question is: “Why are rates rising, and where is the money going?”
If yields rise while industrials, financials, and economically sensitive stocks strengthen, the market may be anticipating growth. If inflation-sensitive assets strengthen, investors may be worried about inflation. If bonds, stocks, REITs, utilities, and homebuilders all weaken, the rising cost of capital itself may be the problem.
And sometimes money doesn’t rotate.
It leaves.
If cash and short-term Treasuries suddenly offer meaningful yields, investors don’t need to believe stocks will collapse to reduce equity exposure. They simply need to decide that the extra return isn’t worth the extra risk.
Every asset competes for capital.
A technology stock competes with a bank stock. A bank stock competes with a REIT. A REIT competes with a corporate bond. A corporate bond competes with a Treasury.
Eventually they all compete with cash.
This is where diversification becomes more complicated than owning different ticker symbols. If technology stocks, long-term bonds, utilities, REITs, homebuilders, and dividend stocks all prosper primarily when financing is cheap and yields are falling, you may not have six independent bets.
You may have one enormous interest-rate bet wearing six different costumes.
You can diversify your investments without diversifying your risks.
The 20% Question
Imagine I come to you with an offer.
I want to borrow your money and pay you 20% interest every year. Assume I have a AAA credit rating, an impeccable balance sheet, and enough respectable-looking paperwork to make an investment banker weep with happiness.
Twenty percent sounds terrific.
But before handing me the money, you would ask questions.
Can I actually pay you back? A 20% return isn’t impressive if accompanied by a 100% disappearance of principal.
Then you’d ask what your money will be worth when you get it back. If inflation is 2%, a 20% return looks extraordinary. If inflation is 18%, I’m not nearly as generous as I appeared.
Next comes duration. Am I borrowing your money for six months or thirty years? The longer I keep it, the more opportunity there is for inflation, economic conditions, interest rates, and my own circumstances to change.
Finally, you would ask the most important question:
Compared to what?
What can you earn somewhere else? What are Treasuries paying? What returns are available in stocks, real estate, bonds, or cash, and how much additional risk must you accept?
Four considerations dominate:
Creditworthiness. Inflation. Duration. Alternative returns.
That thought experiment is essentially what an interest rate is supposed to accomplish.
Interest is the price of money.
We talk about rates like weather reports: the Fed raised rates, the 10-year moved higher, mortgage rates declined, bond yields increased.
Then everybody goes back to discussing Nvidia.
But the cost of money is one of the fundamental prices around which the financial system organizes itself.
As of August 26, 2026, the 10-year U.S. Treasury yield was approximately 4.70%. Treasury yields are commonly used as a benchmark for the so-called risk-free rate, the baseline return against which other investments are evaluated.
That doesn’t mean Treasuries contain literally zero risk. Inflation and market-price risk remain. But Treasury credit risk is generally treated as the benchmark.
And 4.7% changes the conversation.
Suppose a corporate bond yields 5%. If you can earn roughly 4.7% from the Treasury, are you willing to accept corporate credit risk for another three-tenths of a percentage point?
Probably not without a very good reason.
Now suppose a stock yields 3%. Why accept equity volatility if Treasuries pay substantially more? The stock must offer enough capital appreciation or earnings growth to justify the risk.
The same applies to real estate. If an investment property produces 5% while Treasuries yield close to that, investors must decide whether tenants, maintenance, taxes, insurance, leverage, and illiquidity are worth the trouble.
Everything is bidding for the same dollar.
Technology stocks. REITs. Banks. Gold. Corporate bonds. Cash.
Every investment must answer:
Why should I give you my money when I can earn roughly 4.7% somewhere else?
When that benchmark was near zero, investors had to search for return. They accepted longer duration, greater credit risk, higher stock valuations, more leverage, speculative companies, and private investments.
Cheap money didn’t merely make borrowing inexpensive.
It changed what investors were willing to tolerate.
Raise the benchmark and future earnings become less valuable today. Borrowing becomes more expensive. Mortgages rise. Weak companies struggle to refinance. Long-term bonds lose value. Investors suddenly have alternatives to taking large risks.
An interest rate isn’t merely another economic statistic.
It is a price signal.
Compared to What?
A company can have the same factories, employees, products, CEO, and business plan on Tuesday that it had Monday and somehow be worth considerably less money.
Nobody burned down headquarters.
Interest rates changed.
This is where the discount rate comes in.
A dollar promised in the future isn’t worth as much as a dollar in your pocket today. The longer you wait, and the more you could earn elsewhere while waiting, the less that future dollar is worth now.
Suppose I promise you $100 ten years from today. At a 2% discount rate, that $100 is worth roughly $82 today. At 6%, it’s worth only about $56.
Same $100. Same ten years.
The measuring stick changed.
Now imagine billions of dollars of profits expected five, ten, or fifteen years from now. When rates are extremely low, Wall Street can place a large value on those distant profits. Raise the discount rate and those profits become worth less today.
That’s why growth stocks can be particularly rate-sensitive. Investors aren’t buying them solely for today’s cash. They’re buying tomorrow’s expected cash.
If Treasuries pay 2%, investors may willingly wait ten years for a company’s grand vision. If relatively safe securities pay 6%, patience becomes more expensive.
Nothing necessarily happened to the company.
Its competition for your money changed.
Follow the Money
Interest rates don’t move in isolation. Change the cost of money and you change the incentives facing lenders, borrowers, businesses, consumers, and investors.
Those changes spread across markets:
Interest Rates → Bonds → Dollar → Stocks → Housing → Commodities → Capital Flows
When rates rise, existing bonds paying lower rates generally become less attractive, pushing prices lower and yields higher. Those higher yields then compete with every other investment.
Higher U.S. yields can attract foreign capital and strengthen the dollar, although currencies also respond to growth, inflation, trade, government policy, and risk.
Stocks face higher discount rates and higher financing costs. Growth companies can be particularly sensitive, while heavily indebted businesses may face painful refinancing.
Housing feels the change through mortgage rates. A family doesn’t care that economists call it “monetary transmission.” They care that the house they could afford at 3% may not be affordable at 6%.
Commodities can face a headwind from a stronger dollar, but they are also driven by inflation, growth, geopolitics, inventories, and supply constraints.
Oil doesn’t stop caring about OPEC because Treasury yields went up.
Finally, follow the capital. Investors constantly compare stocks, bonds, currencies, commodities, real estate, and cash.
When relative rewards change, money moves.
But these are relationships, not mechanical laws.
That’s why traders should resist simplistic rules like “rates up, stocks down.”
Instead, ask what happens after the first domino moves.
Are bonds confirming the message? Is the dollar responding? Which sectors are strengthening? What are housing, commodities, and credit markets telling you?
The objective isn’t to predict every domino. It’s to recognize when several markets begin telling the same story.
That’s intermarket analysis.
Washington Enters the Bond Market
Because Treasury securities sit underneath so much of global finance, investors should pay attention when Washington takes steps to support that market.
Last week, Treasury announced it would increase liquidity-support buybacks of long-dated government securities after long-term yields had risen sharply.
This is not quantitative easing and it is not literally money printing.
But the signal matters.
The world’s largest borrower is increasingly sensitive to the price investors are demanding to lend it money.
Long-term yields initially fell following the announcement, but much of the relief was temporary. Meanwhile, gold and Bitcoin strengthened, although both had other catalysts.
None of this proves investors are abandoning Treasuries.
But the markets are worth watching together.
Japan adds another dimension. Concerns about yen weakness raised the possibility that Japan could need to sell some Treasury holdings to obtain dollars for intervention.
Put the pieces together.
Washington wants an orderly Treasury market. It has an interest in preventing major foreign holders from becoming forced sellers. And rising yields matter enormously because the United States now carries more than $40 trillion of public debt.
The potential danger is a feedback loop.
More government borrowing increases Treasury supply. Investors demand higher yields. Higher yields increase government financing costs, contributing to larger deficits and still more borrowing.
The borrower becomes increasingly sensitive to the interest rate demanded by the lender.
That brings us back to gold, silver, Bitcoin, and other alternative assets. Their strength doesn’t prove a monetary crisis is coming.
But investors keep asking:
Compared to what?
What return am I receiving? What inflation and currency risks am I assuming? What will those dollars buy when I get them back?
Markets don’t require a Treasury crisis to reprice risk.
They only require investors to decide that yesterday’s interest rate is no longer enough compensation for tomorrow’s uncertainty.
Interest Is Becoming a Budget Problem
The federal budget is increasingly dominated by enormous expenses.
Social Security is about $1.8 trillion.
Defense funding could exceed $1 trillion.
Net interest is roughly $1.1 trillion.
Medicare is roughly $1.1 trillion.
Interest has joined America’s largest entitlement and national-security commitments near the top of the federal ledger.
CBO projects net interest costs rising from about $1 trillion in 2026 to $2.1 trillion by 2036 as debt grows and existing securities refinance at higher average rates.
That’s why the Treasury market matters.
A sustained increase in government borrowing costs doesn’t merely inconvenience bond traders. It migrates into the federal budget, where higher interest expense requires more revenue, less spending elsewhere, or more borrowing.
And there is the uncomfortable circularity:
We borrow money. We pay interest on the money we borrowed. Then we borrow more money, in part, to pay the interest.
When interest becomes one of the government’s largest expenses, the cost of money stops being an abstract discussion about bond yields.
It becomes a budget problem.
Who Is Making Money?
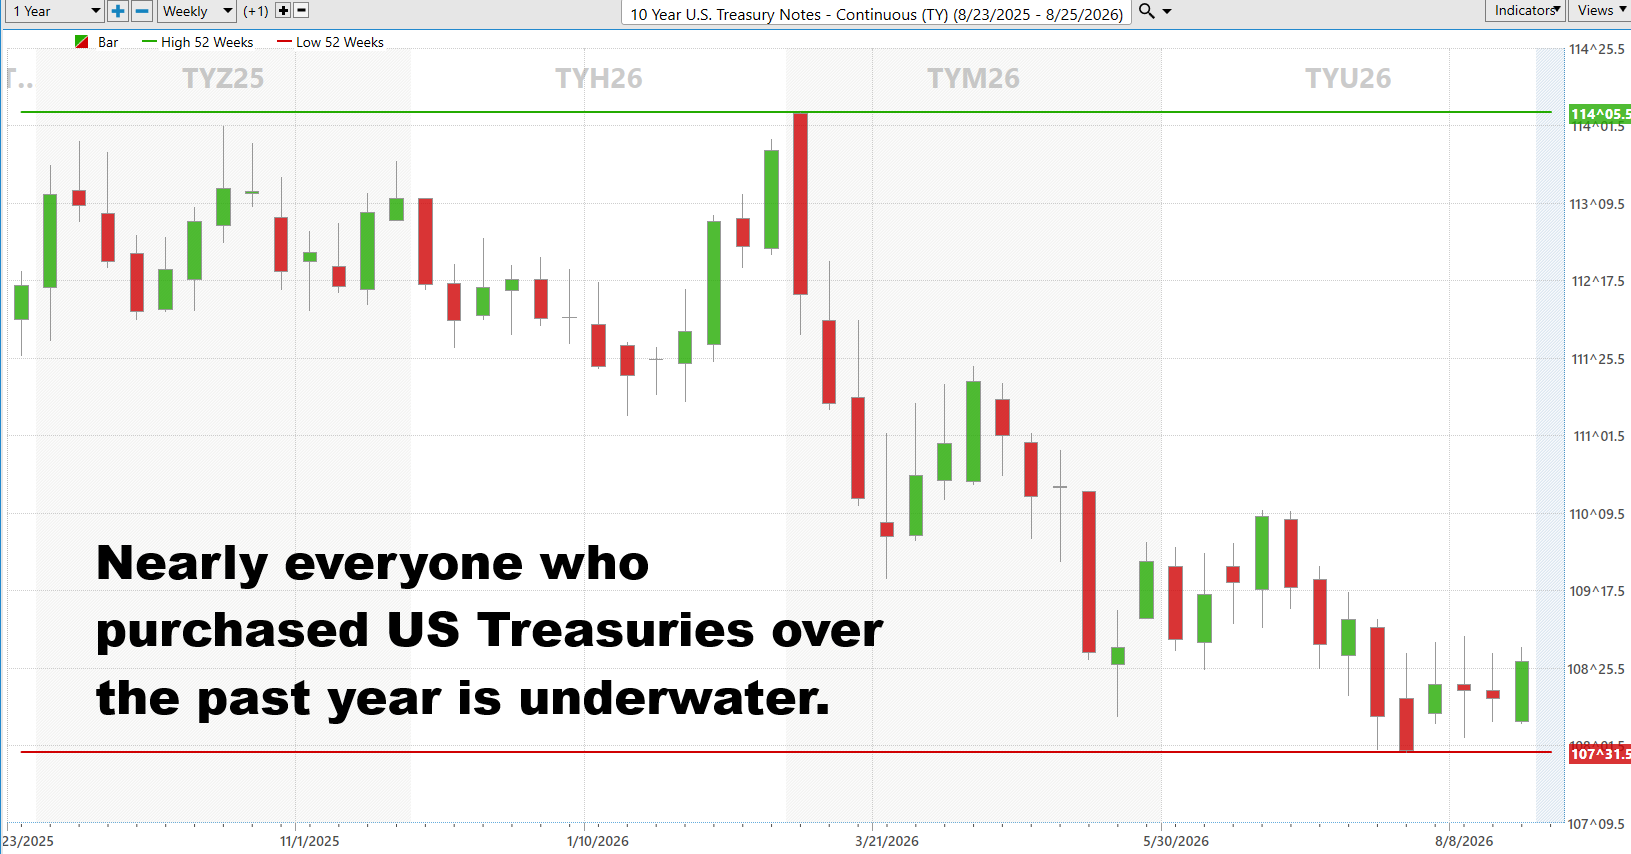
Whenever I begin researching a market, the first thing I want to see is the 52-week chart.
Not an economist’s forecast. Not somebody’s price target. Not a television panel explaining what ought to happen.
I want to see what happened.
Then I ask:
Who is making money here? And how?
Markets keep score in price.
Apply that test to the 10-year Treasury futures chart.
Over the past year, prices have fallen from near the upper end of their 52-week range toward the bottom. There have been rallies, but they repeatedly failed to change the larger pattern.
The bears have been making the money.
Treasury futures are sitting just above their 52-week low after a prolonged decline. The recent bounce is visible, but small compared with the damage that preceded it.
Calling this a bull market because prices rallied for a few weeks would be like calling a man healthy because his fever dropped from 104 to 103.
Then came Washington.
On August 19, Treasury announced it would at least double its liquidity-support buybacks of longer-dated Treasury securities, raising the maximum from $2 billion to at least $4 billion per operation beginning September 9.
Bond prices rallied and long-term yields initially fell. But much of that yield decline was quickly reversed.
More recently, the 10-year yield fell to about 4.64% on August 25, helped by falling oil prices and softer economic data.
That matters.
But one rally doesn’t erase a 52-week trend.
So ask:
Where is the evidence that the bulls have taken control?
For the evidence to change, Treasury prices would need to stop testing the bottom of their annual range, establish higher lows, break above meaningful prior highs, and show that buyers can remain in control.
Until then, the burden of proof belongs to the bulls.
This matters far beyond bonds. Rising Treasury yields affect mortgages, corporate borrowing, long-duration growth stocks, real estate, and the relative attractiveness of every risky asset.
That’s why I don’t simply see a bad year for bondholders.
I see financial gravity getting stronger.
The next question is what happens elsewhere.
Do homebuilders weaken? Do utilities struggle? Do expensive technology stocks lose momentum? Does the dollar strengthen? Do gold, silver, or Bitcoin attract capital?
Those markets can provide confirmation.
The market still gets a vote.
And based on the 52-week chart:
The bears have been winning. The bulls have produced a bounce. Those are two very different things.
Six Years Tell an Even Bigger Story
Now extend the exercise from 52 weeks to roughly six years.
Draw a horizontal line across today’s Treasury futures price and ask:
Who is making money?
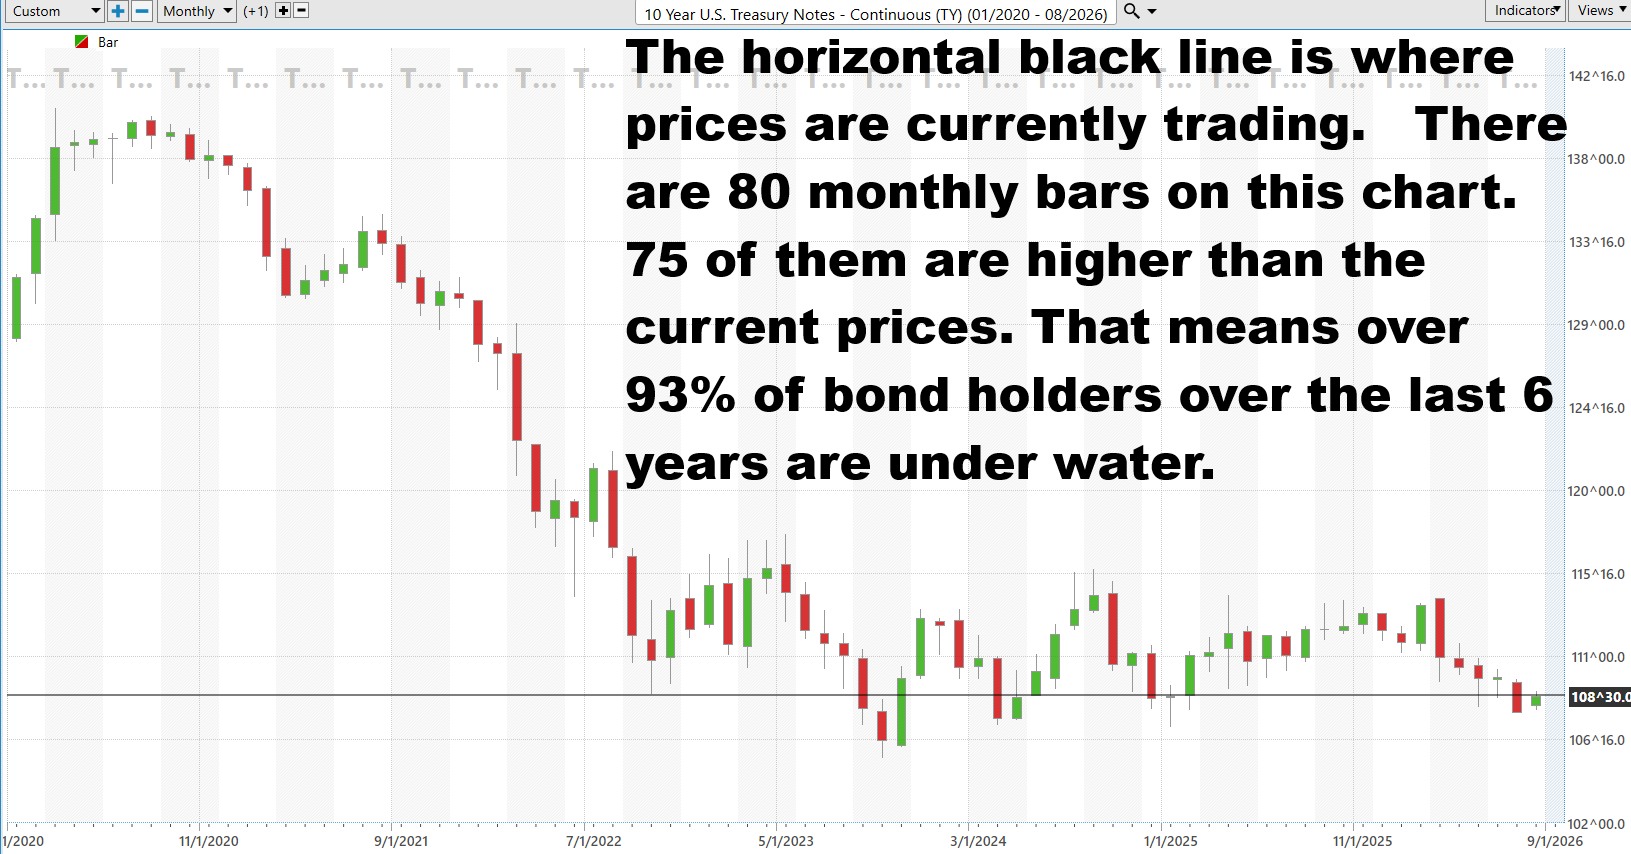
By my count, more than 80 monthly bars appear on the chart, yet only about five months show prices below today’s level.
In other words, buyers at the overwhelming majority of monthly price levels are sitting on securities worth less in the market today than when they bought them.
That’s not an opinion about fiscal policy.
It’s what the chart shows.
There is an important qualification. Treasury investors collected coupon interest, and investors holding individual securities to maturity have a different experience from someone marking a bond portfolio to market every day.
But interest income doesn’t eliminate capital losses.
And it doesn’t eliminate inflation.
Since 2020, cumulative consumer-price inflation has been roughly 30%. At the same time, the Treasury futures price shown on the chart has fallen roughly 22% from its starting area.
Coupon income offsets part of that damage.
But long-duration investors have been fighting declining bond prices and declining purchasing power at the same time.
The government honored its obligations and paid interest.
Yet investors who needed to sell before maturity discovered an old lesson:
Credit safety and price safety are not the same thing.
Now ask the bigger question.
Who wants to lend the United States money for ten, twenty, or thirty years if the compensation isn’t sufficient for inflation, duration risk, and possible capital losses?
Investors will lend.
But they may demand a higher price for doing so.
In the bond market, that means higher yields and lower prices.
Washington continually issues and refinances enormous quantities of debt. If investors demand higher yields to compensate for inflation, deficits, duration, and uncertainty, the government’s financing cost rises.
More debt requires more financing. Higher yields increase interest expense. Higher interest expense contributes to larger deficits, requiring still more borrowing.
None of this means a Treasury crisis is inevitable.
It means the price investors demand for lending Washington money matters enormously.
That’s not a prediction.
That’s observing the obvious.
A Treasury buyback is simple. The government steps into the open market and buys back its own older long-term bonds. That reduces the supply of bonds available, which can push bond prices higher and yields lower.
Treasury says buybacks are meant to keep the bond market running smoothly. Fair enough. But there is another benefit Washington doesn’t advertise quite as loudly: cheaper debt. When you owe trillions, every basis point knocked off the 30-year yield can save a serious amount of money. This isn’t just market maintenance. It is Uncle Sam trying to lower the carrying cost of an enormous debt burden.
Two dates will settle the argument
September 9 is when talk becomes action. That is the day the Treasury’s doubled bond buybacks actually begin. Until then, it is merely an announcement.
August 28 brings a different test. New Fed Chair Kevin Warsh delivers his first Jackson Hole speech. The Federal Reserve and Treasury are separate institutions, but the same bond traders will be scrutinizing every word.
Then watch 5.28%. That was the 30-year Treasury yield before the buyback announcement. If the yield climbs back to that level, the bond market will have delivered its verdict: the plan did not change the underlying problem.
Everybody Has a Number
Return to my imaginary 20% offer.
Would you accept it?
Almost certainly.
But the important question isn’t whether you’d accept 20%.
It’s how low I could go before you said no.
Everybody has a number.
A young investor trying to build wealth may demand substantial returns. A pension fund, insurance company, bank, or wealthy family may think differently.
They’ve already accumulated wealth.
Their first job is often to protect it.
The young investor might ask, “Why settle for 5% when I could potentially make 15%?”
The institution may ask, “Why risk losing 15% when all I need is 5%?”
Same markets.
Completely different numbers.
For generations, U.S. Treasuries occupied a special place in that second calculation. Institutions could earn interest, maintain liquidity, and assume relatively little credit risk.
They weren’t trying to hit the jackpot.
They were trying to protect the jackpot they already had.
That is what an interest-rate market is supposed to reconcile. Borrowers say what they’re willing to pay. Lenders decide what they require for inflation, time, credit risk, and opportunity cost.
Somewhere between those numbers, a market price emerges.
The Federal Reserve heavily influences that process at the short end of the yield curve by setting a target range for the federal funds rate and managing liquidity.
The Fed doesn’t dictate the 10-year Treasury yield. Markets determine it every day.
But Fed policy can exert enormous influence over the entire structure of rates.
After 2008, the Fed drove short-term rates near zero and purchased trillions of dollars of longer-term securities through quantitative easing.
The goal was to stabilize the financial system and support economic activity.
But there were consequences.
When safe investments yield almost nothing, institutions that need 4% don’t suddenly stop needing 4%.
So money moves farther out on the risk curve.
Treasuries become corporate bonds. Investment-grade debt becomes high yield. High yield becomes equities. Capital moves into real estate, private credit, leverage, and increasingly complicated strategies.
The Fed wasn’t ordering investors to take more risk.
It changed the economics of remaining conservative.
Ultimately, every interest-rate market is answering one question:
What is money worth?
And when that answer changes, the consequences eventually appear in asset prices, leverage, risk-taking, inflation, and purchasing power.
Stop Predicting the Fed. Watch the Evidence.
This is why traders shouldn’t spend all their time trying to predict what the Federal Reserve will do next.
Watch the evidence.
Watch Treasury yields. Watch the dollar. Watch gold. Watch technology, financials, utilities, housing, energy, commodities, and credit.
The Federal Reserve changes the incentives.
Markets tell you how investors are responding.
That’s the essence of intermarket analysis.
No market operates entirely by itself because capital is constantly comparing one opportunity with another. Bonds influence currencies. Currencies influence commodities. Interest rates influence housing. All of them can eventually influence the stocks in your portfolio.
This is where predictive intermarket analysis can be valuable.
VantagePoint is designed to examine relationships among markets rather than treating one stock as if it exists on an island. The goal isn’t to predict every Federal Reserve decision or every move in Treasury yields.
It’s to identify when important market relationships begin changing and whether those changes confirm or contradict the trend you’re trading.
So open your portfolio and look past the ticker symbols.
Don’t simply ask:
“What do I own?”
Ask:
“What economic condition am I in on?”
The ticker symbol tells you what you bought.
It doesn’t necessarily tell you what you’re betting on.
Let Artificial Intelligence Do the Heavy Lifting
Interest rates are the price of money, and the price of money eventually touches everything. Bonds, stocks, currencies, commodities, housing, gold, and cash compete every day for the same investable dollar.
When that price changes, capital moves, correlations change, and yesterday’s strongest market can become tomorrow’s weakest.
The opportunity belongs to traders who recognize those changes early.
The good news is you don’t need a degree in econometrics or quantitative finance to understand what the bond market may be telling you next.
You don’t need to spend your evenings calculating correlations between Treasury yields, the dollar, gold, technology stocks, commodities, and dozens of other markets.
VantagePoint AI is designed to do that analytical heavy lifting for you.
Using patented artificial intelligence and predictive intermarket analysis, VantagePoint examines relationships that would be extraordinarily time-consuming for an individual trader to research manually.
Instead of staring at one chart and hoping you’ve found the answer, you can evaluate a market through the lens of other markets statistically connected to it.
AI can process enormous quantities of market data and translate changing relationships into predictive indicators designed to help identify trend direction and possible changes in momentum.
It doesn’t eliminate risk or guarantee the next move.
But it can improve the quality and speed of the information you bring to the decision.
And perhaps the greatest benefit isn’t simply time saved.
It’s peace of mind.
There is enormous value in having an objective analytical process helping identify where strong trends are developing and warning when previously strong trends begin to weaken.
You will never eliminate uncertainty from trading.
But you can eliminate much of the guesswork.
That’s what we’re trying to accomplish at VantagePoint AI.
We don’t need to predict every Federal Reserve meeting, Treasury auction, or headline out of Washington.
Find strength when the evidence supports strength. Recognize weakness when the evidence deteriorates. Manage risk when conditions change.
If you’d like to see how traders use predictive artificial intelligence to analyze trends, uncover intermarket relationships, identify potential opportunities, and recognize risk, I invite you to attend our Learn How To Trade With VantagePoint AI Live Online Masterclass.
You’ll see how these predictive tools can become part of a disciplined trading process without requiring you to become a quantitative analyst or spend your life buried in spreadsheets.
Because whether we’re talking about Treasury bonds, technology stocks, commodities, or the next great market opportunity, the objective never changes:
The right side of the right trend at the right time.
See you at the masterclass.
It’s not magic.
It’s machine learning.
THERE IS A SUBSTANTIAL RISK OF LOSS ASSOCIATED WITH TRADING. ONLY RISK CAPITAL SHOULD BE USED TO TRADE. TRADING STOCKS, FUTURES, OPTIONS, FOREX, AND ETFs IS NOT SUITABLE FOR EVERYONE.IMPORTANT NOTICE!
DISCLAIMER: STOCKS, FUTURES, OPTIONS, ETFs AND CURRENCY TRADING ALL HAVE LARGE POTENTIAL REWARDS, BUT THEY ALSO HAVE LARGE POTENTIAL RISK. YOU MUST BE AWARE OF THE RISKS AND BE WILLING TO ACCEPT THEM IN ORDER TO INVEST IN THESE MARKETS. DON’T TRADE WITH MONEY YOU CAN’T AFFORD TO LOSE. THIS ARTICLE AND WEBSITE IS NEITHER A SOLICITATION NOR AN OFFER TO BUY/SELL FUTURES, OPTIONS, STOCKS, OR CURRENCIES. NO REPRESENTATION IS BEING MADE THAT ANY ACCOUNT WILL OR IS LIKELY TO ACHIEVE PROFITS OR LOSSES SIMILAR TO THOSE DISCUSSED ON THIS ARTICLE OR WEBSITE. THE PAST PERFORMANCE OF ANY TRADING SYSTEM OR METHODOLOGY IS NOT NECESSARILY INDICATIVE OF FUTURE RESULTS. CFTC RULE 4.41 – HYPOTHETICAL OR SIMULATED PERFORMANCE RESULTS HAVE CERTAIN LIMITATIONS. UNLIKE AN ACTUAL PERFORMANCE RECORD, SIMULATED RESULTS DO NOT REPRESENT ACTUAL TRADING. ALSO, SINCE THE TRADES HAVE NOT BEEN EXECUTED, THE RESULTS MAY HAVE UNDER-OR-OVER COMPENSATED FOR THE IMPACT, IF ANY, OF CERTAIN MARKET FACTORS, SUCH AS LACK OF LIQUIDITY. SIMULATED TRADING PROGRAMS IN GENERAL ARE ALSO SUBJECT TO THE FACT THAT THEY ARE DESIGNED WITH THE BENEFIT OF HINDSIGHT. NO REPRESENTATION IS BEING MADE THAT ANY ACCOUNT WILL OR IS LIKELY TO ACHIEVE PROFIT OR LOSSES SIMILAR TO THOSE SHOWN.