


Welcome to the Artificial Intelligence Outlook for Forex trading.
VIDEO TRANSCRIPT
Okay, hello everyone, and welcome back. My name is Greg Firman, and this is the VantagePoint AI Market Outlook for the week of February the 12th, 2024. Now, to get started this week, we’re going to begin, uh, where we usually do, with the currencies and the equities. But I’ll do things a little bit differently, uh, again this week, and show how we can cover all, pretty much all, the global markets from one chart setup.
So, as you can see, I’ve split my VantagePoint screen so I can clearly identify inter-market correlations, both positively and inversely correlated.
U.S. Dollar Index
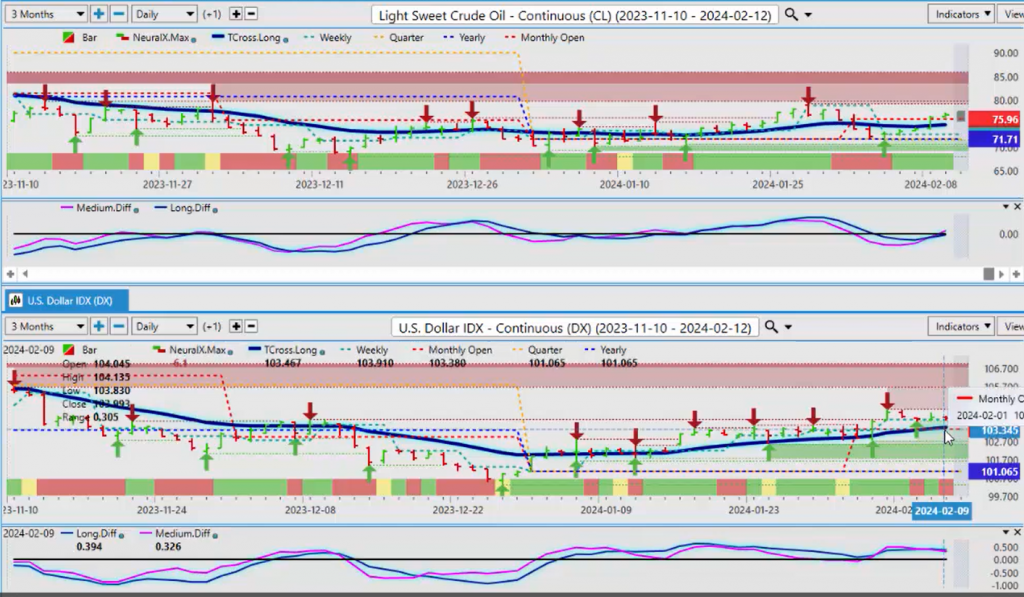
So, starting with the dollar, the dollar, once again, I’ve talked about this, uh, in the VantagePoint live room and in this particular, uh, weekly presentation of the classic Monday-Tuesday reversal that often catches traders. So, be very cautious of this. You can see the dollar had a big rally up on Monday, only to sell off on Tuesday. We saw the same thing with Euro US, Great Britain US, the equity markets, right across the board. So, so, I think that a lot of traders do get stopped out on Mondays, and if you wait until all markets are in, and then, for the remainder of the week, I would also strongly recommend that you look at the high and the low of the Monday bar in any particular market you’re looking at, uh, and again, I do prefer bars. I don’t use candlesticks of any kind. The, uh, the bar is very simplistic; the notch on the left is the open, the notch on the right is the close. So, when we look at the Dollar Index right now, and we do a comparative analysis between the Dollar Index and LightSweet Crude Oil, we’ve talked about the direct positive intermarket correlation.
Last week, I made the argument, using a proper anchor point in our trading, guys, we don’t want to be looking into rolling performance models. We always want to make sure we start our analysis at the beginning of each calendar year, the beginning of each month, beginning of each, uh, uh, week, and my personal, one of my personal favorites, the opening of the quarter. So, once again, we want to make sure that we’re actually looking at these things from, it from, a a proper anchor point, because if we move that, we’re going to have problems. So, right now, oil is positive on the year. We’ve come directly off the current yearly opening price. If I, again, if I went back 30 days, or even 365 days, I wouldn’t see this particular support zone. We’ve got an, an additional looks like we’ve got additional longs building on oil. Now, this directly tells us that the dollar rally is probably not done yet. There’s a very strong positive correlation between, as you can see by this chart, over the last three months, they’re moving up, oil and the dollar moving up and down together. So, oil, our support there, the monthly opening price, very important number, 75.96, but the yearly opening price provided very, very easy longs off of that this particular week, which I talked about in last week’s weekly outlook. So, when we look at that move off of the current yearly opening price, we can see that that was essentially, uh, it’s gone up 6% in 5 days, but we knew this before it happened. The VantagePoint indicators were turning positive, the neural index going green. Now, we’ve got additional confirmation with the MA Diff Cross. Now, there is a, the difference here is we’re looking at a little bit of a corrective move on the dollar. We’re still above our T-cross long, that’s coming in at 103.46, that is the key level here. Now, our monthly opening is 103.38, so we have plenty of support down in this particular area. And again, in most calendar years, the dollar is quite strong between mid-February and mid to late March, not every year is the same, uh, that is a pattern that I’ll advise you of. And if that’s the case, then oil is simply confirming that the dollar is not done, its particular, uh, buying in the dollar is not necessarily, uh, done at this particular time.
S&P 500 Index
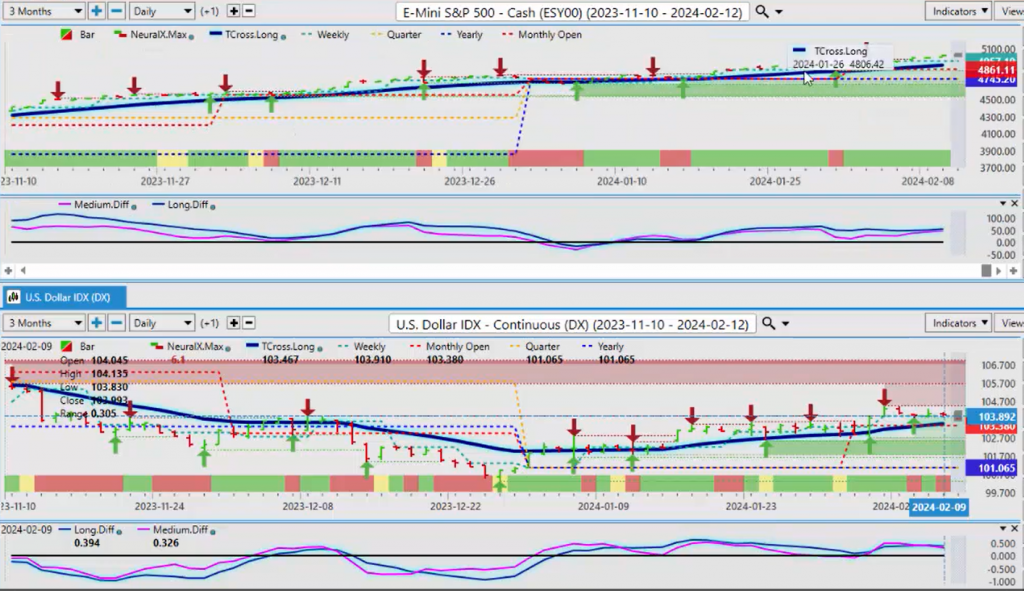
Now, if we look directly at our S&P 500, uh, once again, both the S&P 500 and the dollar are both at their yearly opening, above their yearly opening price, meaning they’re both bullish. So again, when we look at the, we want to identify our downward targets for the week, and you can see that they’re all layered in here very nicely, with proper anchor points. Again, guys, I will stress this, that rolling performance models, going back 30 days, 90 days, 365 days, can be, it’s lagging, number one, number two, it can be very misleading as to what’s actually happening with price. So, we keep current in the calendar year. The last thing we want to do is drag something from 2023 into 2024. So, right now, those, uh, the S&P 500, has stayed very easy to read here, also, I might add, our T- cross long is at 4909.
We’ve got our quarterly opening at 4745, which matches the yearly opening price, but 4861—this is the area that I would focus on next week. Between the TR cross long at 4909 and the monthly at 4861, if we can hold above that, then longs remain viable.
DAX
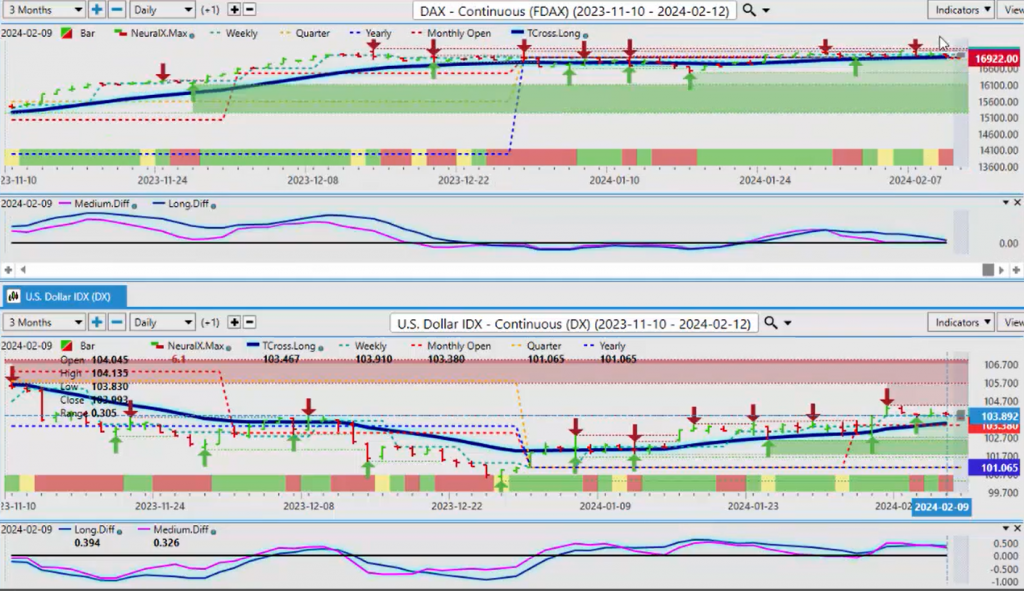
So, if we cross-reference that to our European equity markets, then we can see that really, we don’t have a lot of buyers up here, and that is concerning because usually, if one index drops, very often 80% of the other indexes drop too. So, the Dax here could be an early warning sign, and the Dax is struggling to get over the Tross long at 16,951. Once again here, we’re closing the week at 16,988, so again, we’re slightly above it, but again, just basically dead flat here, and we are getting, uh, you can see our medium-term predicted difference is running along that zero line, trying to break to the downside. I would respectfully submit that that is highly probable because of, uh, if this dollar turns and goes back up, we stay above our T cross long and our monthly opening price, that is going to put pressure on these indexes.
Nikkei
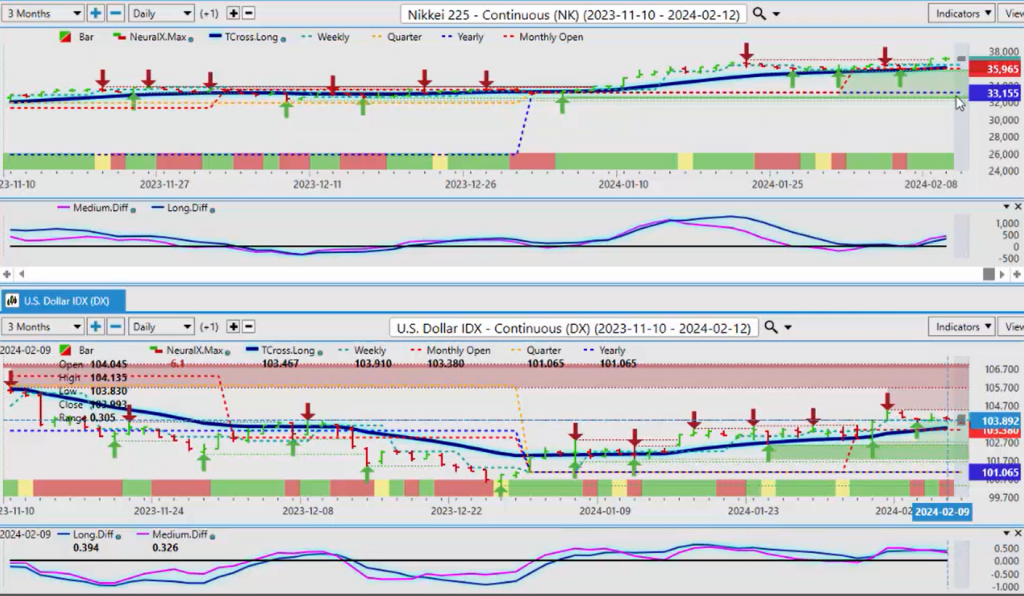
We can see something similar here with the Nikkei, but the Nikkei is more in line with the dollar index, and that’s because of the carry trade in the yen. So, the Nikkei holding its value. Now, if we cross-reference this to the dollar, using this from a single chart setup, instead of going from stocks to metals, I can do it all from the same chart and then do a comparative to the Dollar Index because the Dollar Index will affect all of these other markets, period, full stop right there. So, we’re looking for positive and inverse correlation.
Gold
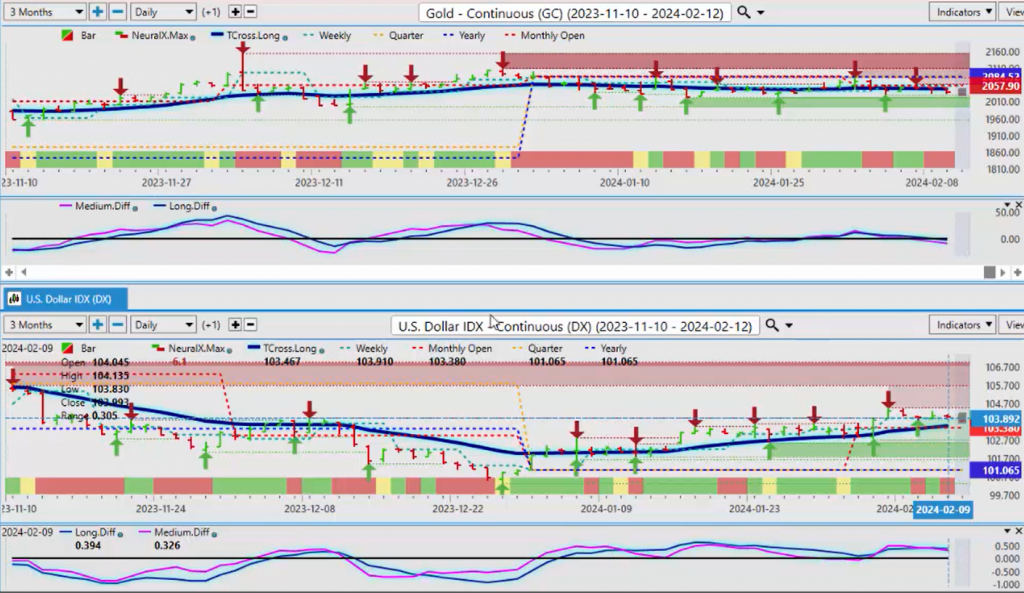
So, right now, we can see that gold, the staggered resistance starting at the yearly opening price, comes in 2084, then we’ve got our monthly opening at 2057, and our T cross long at 2049, and gold has been staying below that for the main calendar year as the Dollar Index stays above its yearly opening price. So, the direct inverse correlation is suggesting there’ll be more downside pressure on the metals.
Platinum
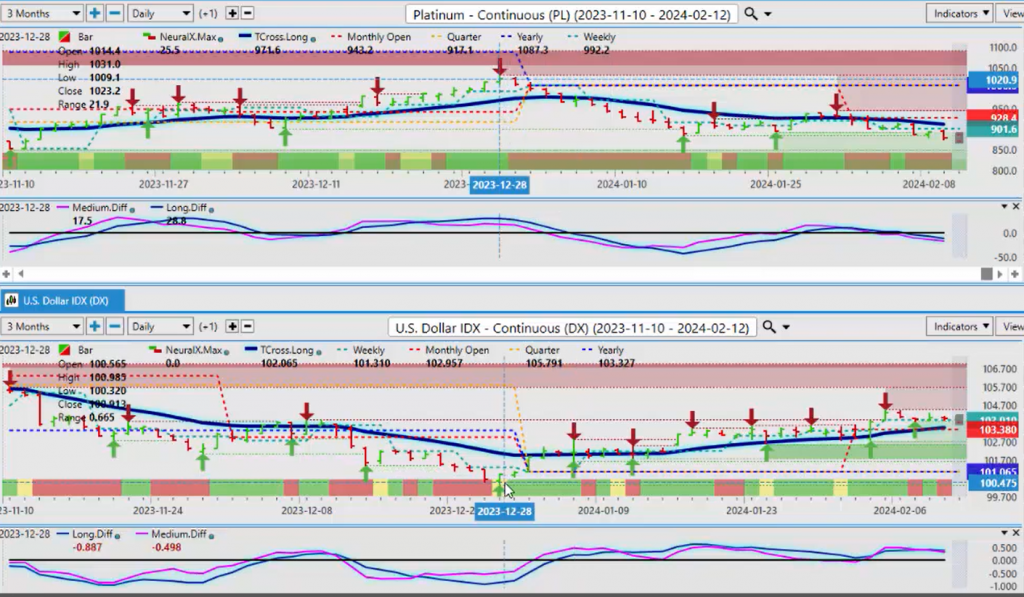
When we do a comparative to another metal, Platinum, you can see the same thing. Platinum, excuse me, peaked at or around December the 28th, that is at the exact same time the Dollar Index bottomed out. The direct inner-market inverse correlation warns us of this, that again, we don’t want to keep buying metals if we’ve got dollar strength coming in, and there’s many different metals you can check against that.
We can use platinum, Palladium, all kinds of different metals. We can look at Copper, Copper also having a very, very strong direct inverse correlation. So, but we don’t need to go through them. The point being is that they’re virtually all the same trade or very, very similar, and they’re being affected by the dollar. Now, when we look at those gold prices, likely have a little bit more downside until we turn around, but I have, as I’ve said before, I have seen gold and the dollar both go up at the same time between February and March. So, we definitely want to keep that in mind.
Magna International ($MGA)
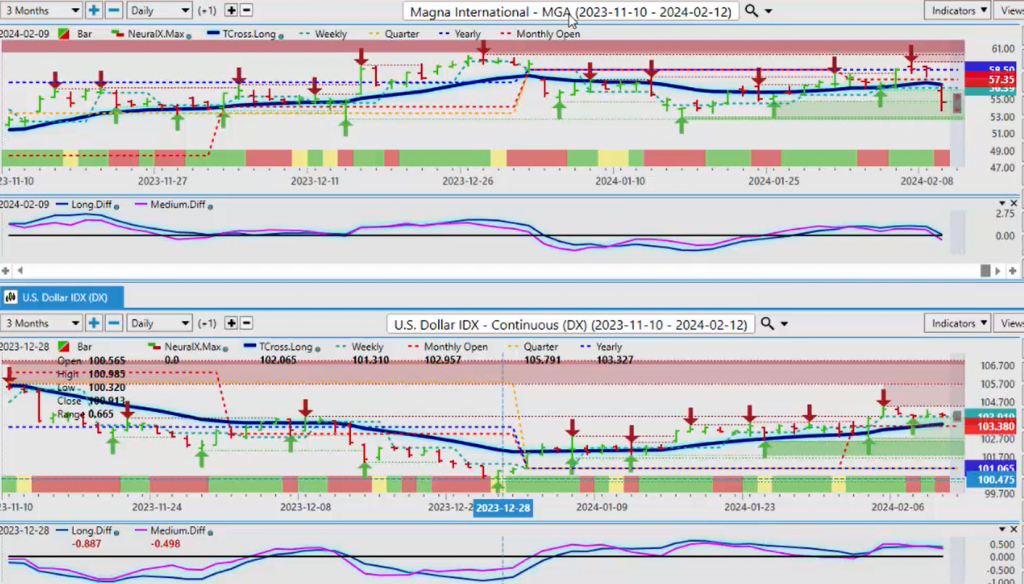
Now, if we want to look further into correlations, as I’ve talked about before, the MGA stock has about a 93% inverse correlation to the Dollar Index. Yes, it’s getting hit by earnings, but it’s been below its yearly opening price, failing at that prior to those earnings coming out. We’ve had multiple failures on this particular stock at the current yearly opening price, and each time that happened, the dollar moved higher. So, if we use the MGA stock as an inverse correlation, then there’s a very big difference here. We’ve got the MA Diff Cross on the Dollar Index to the downside, but we’re above the yearly opening price and above the zero line on the MA, the medium and long-term predicted difference, where MGA is crossing the zero line below the monthly opening and below the yearly, and firmly below the VantagePoint T cross long at 5673. So, if we’re going to start selling dollars, then we would look for this particular stock to rebound and go higher and get above that T cross long, and not even the S&P 500 could help this. So, but it is possible that this is a warning sign of pending equity weakness. That’s something we want to look at very, very closely.
Bitcoin
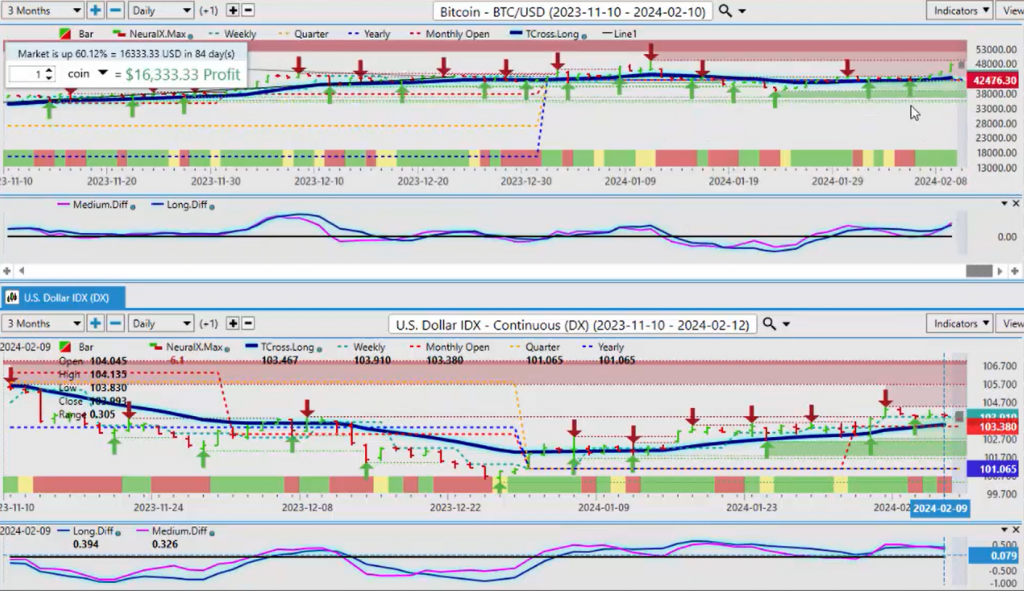
Now, with Bitcoin, once again Bitcoin, uh, accelerating back up to the upside. I get a lot of questions on this. I’ve remained a bull on Bitcoin since 2018, nothing has changed. If anything, we’re probably looking for a bigger move. If we look historically, very briefly, at the price of gold, uh, the market cap of gold back in ’04—I don’t quote me to the exact day, but around 2004 when gold, uh, market cap was 1 to 2 trillion. However, they implemented gold ETFs, the gold market cap then, over the next several years, went up to 16 trillion. So, I would respectfully submit we could have something very similar going on here with Bitcoin, now that we have the approval on these Bitcoin ETFs. So, once again, Bitcoin moving higher, the only area of resistance that we need to watch for here is this verified resistance high at 49,021, but I have a sneaky suspicion we can get towards the 56,000 mark by the end of the month, depending on how strong that dollar actually gets. But what I would, uh, also respectfully submit is that, uh, as I had warned last year, that Bitcoin could be an independent asset class that doesn’t look at, doesn’t care what the equity markets are doing, or gold. Over the last couple of years, we’ve seen Bitcoin correlate to the S&P, correlate to gold, inverse correlated to the dollar, but I will point out that this week, that basically gold and Bitcoin are essentially, or excuse me, the dollar and Bitcoin have largely been going up and down together, uh, with a slight bias of, uh, towards Bitcoin. So, I know that that is a very unusual thing. Usually, if Bitcoin’s trading against the US dollar, well, they can’t both go up, but well, they actually have been. So, again, the dollar did pull back a little bit this week, but not very much. We hit a high for the week on Monday, and that again helped push Bitcoin up.
Now, if we again look at some of our main, some of the additional main Forex markets, uh, again, everything has a correlation, and I often get people say, “Well, I trade stocks. I don’t trade Forex.” I will again respectfully submit you are trading Forex; you just don’t realize it. And you, Forex traders, are trading stocks, whether you like it or not. And again, the inverse correlation and positive correlation to some pairs to the dollar index or the S&P 500 is really quite something. So, when you know what it is you’re looking at, so with the dollar index, we’re still, uh, moderately bullish on the year and on the month until such time we break down below that level.
Euro versus U.S. Dollar
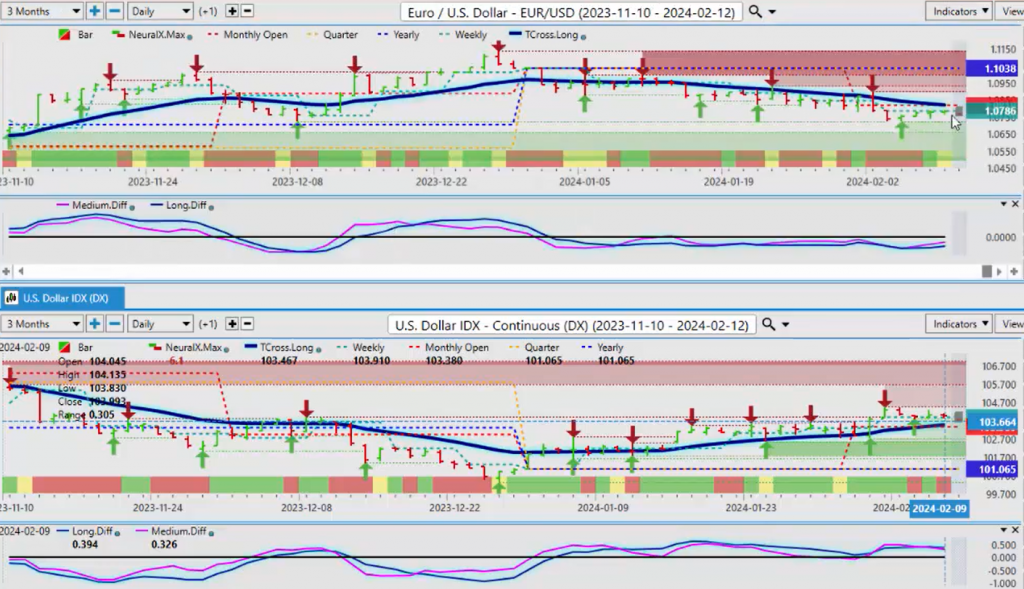
So, if we do a comparative analysis on some of our main pairs, when we look at the Euro US pair, as the dollar index rises, the Euro US pair, once again, just to show you guys this because it is quite interesting, 2.45, you can see that we had the down day on Monday to start the week, and then we completely reversed, but we’ve got all tangled up in the current weekly opening price and the monthly opening price just above that, and, and then we have the TR cross long from VantagePoint intersecting directly at 1.0820. So, that’s all of our resistance is sitting right there, the monthly opening price 1.0818. Uh, if you’re a Euro buyer, I again would respectfully submit, you would want to, if you’re thinking about buying this, it needs to be above that T cross long, and then you still have that yearly opening price to deal with at 1.1038. So, the Euro, currently, yeah, we could look at this on a year-over-year basis, and it could make the argument that the euro is bullish, but when we use a proper anchor point in the first, in the start of the new calendar year, there has been nothing bullish about this particular pair, and that’s largely due to that period of known dollar buying, I would argue, between mid-January to mid-March, uh, in the US fiscal second quarter.
British Pound versus U.S. Dollar
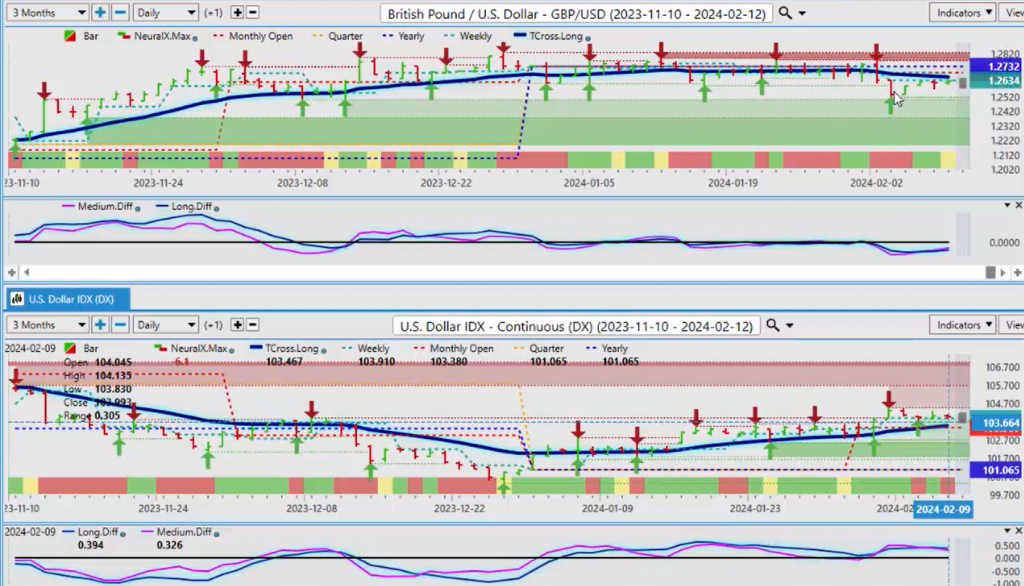
When we look at the British Pound US Dollar, we see the exact same thing on Monday. We have a big push down; it stops, completely reverses, comes back to a natural retracement point that has absolutely nothing to do with Fibonacci or waves or any of this theory. This is simply related to the, the, the weekly, the monthly, the yearly opening price, and the very powerful VantagePoint T cross long, coming in at or about the 1.2637 area. So, until we get above that, then this area remains very, very stiff resistance. We do have a loose MAAD diff cross that is trying to produce a buy signal, but to be clear, that would be a corrective move until such time as we close above the T cross long and close above the yearly opening price, that coming in at or about the 1.2732 area.
U.S. Dollar versus Swiss Franc
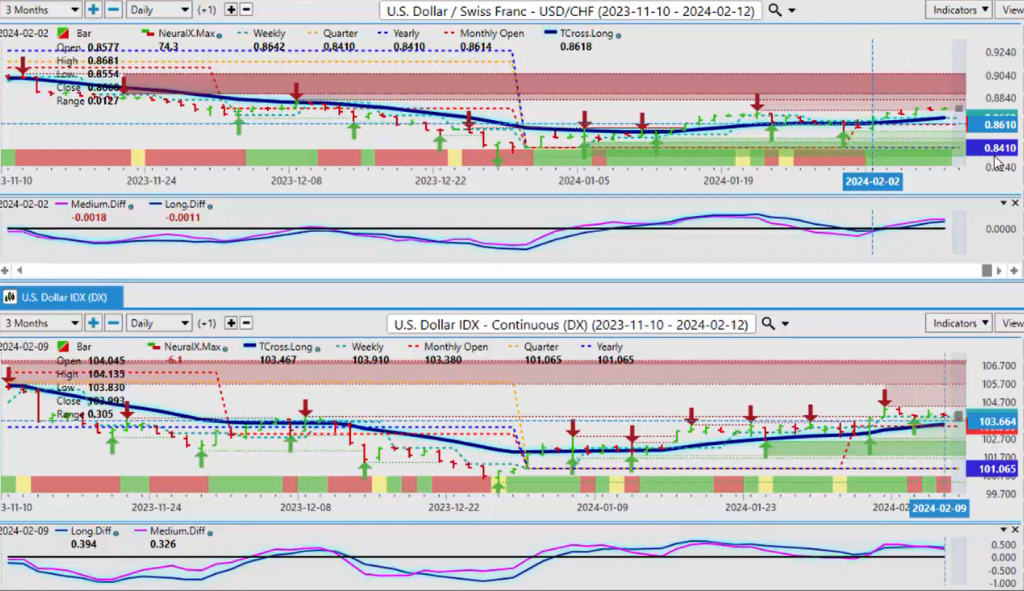
Now, when we look at US Swiss Franc, it’s benefiting from this dollar strength, even though the dollar was a little bit soft in the middle of the week, we’re still holding above that, and that, in turn, with the US Swiss Franc, is also holding above its T cross long and the yearly opening price on this one too, coming in at 0.88410. So, my, in my respectful opinion only, the further we move away from one, from 0.8410, the more likely it is we’re going to retrace to it. I believe that will be in likely mid-March, once we get through this dollar strength, if we even see the dollar strength because the FED could change that. We’ve got the January CPI number coming out, uh, next week. That’ll be very interesting, but always remember, guys, that that is a lagging indicator, right.
So, again, if we can hold above that level, then we could potentially extend further, but the upside here, in my respectful opinion, could be limited on this particular pair because of the Dollar Index.
U.S. Dollar versus Japanese Yen
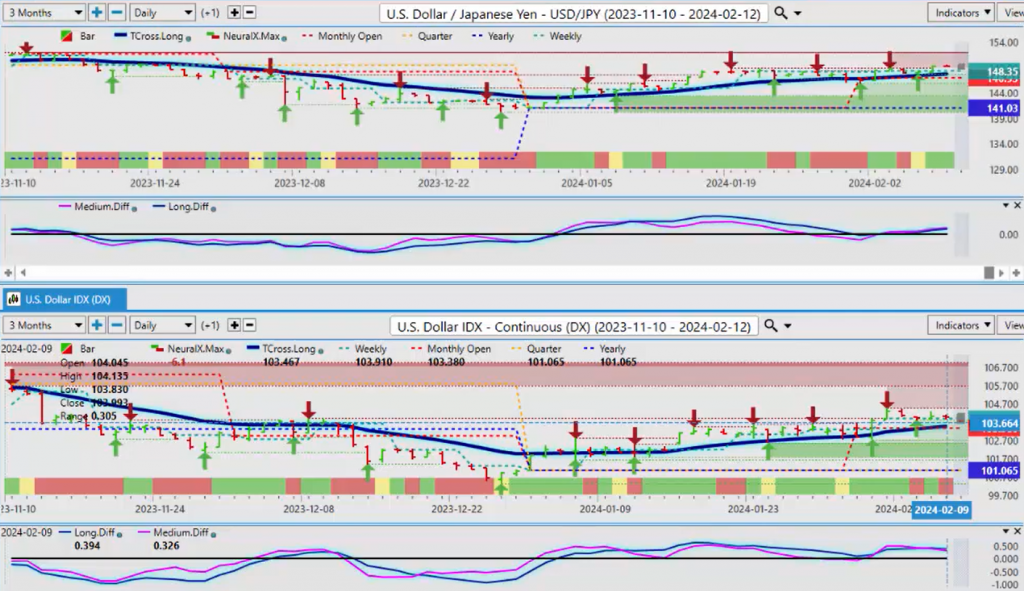
Now, when we look at some of our additional pairs here, the Dollar Yen, uh, the dollar continues to put pressure on the Yen based around the carry trade, but we, you can see that there isn’t a lot of buyers up here. We are holding above our T cross long and our monthly opening price, but, but if we can break down below 146.93, then we could see some additional selling here as people exit the carry trade. If the Fed is talking about multiple cuts, that would slightly benefit the Yen, but there is still a carry trade there, guys, so we should be careful with shorts on this pair. Right now, the indicators and VantagePoint remain positive that the dollar will hold its gains for the most part against the Yen, barring anything coming out of the Federal Reserve.
Now, when we look at the, uh, some of our main equity-based pairs, and sometimes it does help to illustrate this, what we can do in our VantagePoint software is simply swap this out and say, okay, well, now what we’re going to do is we’re going to identify pairs that are highly correlated to that S&P. And I’ve often, um, been asked about this, so let me show it to everybody.
Australian Dollar
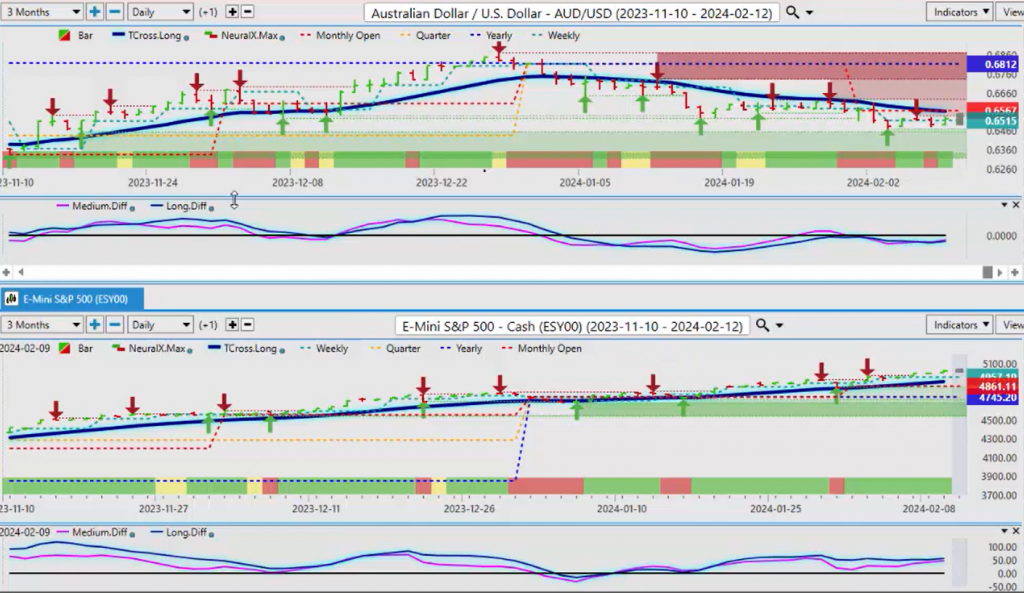
So, here is what we have on the dollar index with that, but if we look at the US pair, in most cases, the Aussie has a relatively strong positive correlation to the equity markets, and it’s been interesting as of late because we haven’t seen that as much. There’s been more of a correlation to gold, actually. But when we look at this over the last 6 months, we can see that this correlation, just following that predicted moving average, something changed a little bit right here in 2024. So again, we’re in that first quarter here, and the correlation is a little off right now, but, uh, and I believe that is strictly on people because, always remember, nobody needs to buy a stock or a stock index or a commodity or Bitcoin, but they do have to buy currencies to settle their trade balances and things of that nature. So, I believe that this slight distortion here is because somebody is required to buy the US. They may not want to, but they have to, so that’s putting the downward pressure on the Aussie, but ultimately, the positive correlation between the S&P 500 and the Aussie will return once we get past this dollar strength, which again, I believe to be mid to late March.
New Zealand Dollar
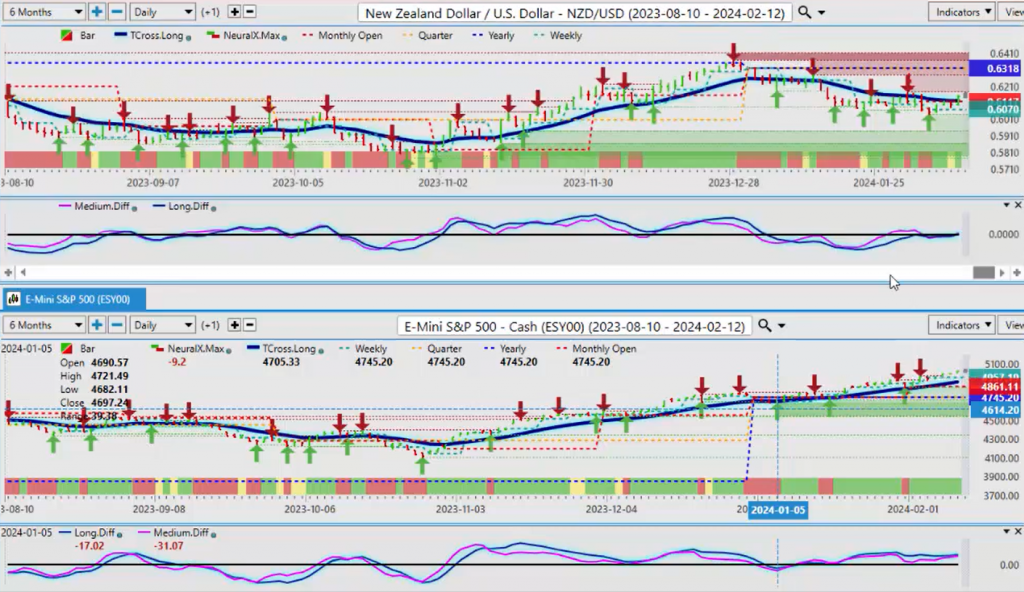
Now, if we look at the Kiwi, we can see the exact same thing with the Kiwi; it’s almost the exact same chart as the Aussie US. So, these are things we want to make sure we’re looking at, but there are still, uh, there are signs here of some strength on these, on these currencies. With the US Canadian pair, uh, again, this is an inverse correlation right now. So, if that dollar slips, then the Canadian dollar could benefit, but based around what’s happening politically and everything else in Canada right now, I think it’ll be very difficult for the Canadian dollar to make, uh, large gains against the US dollar, at least at this particular time of year.
Gold versus S&P 500 Index
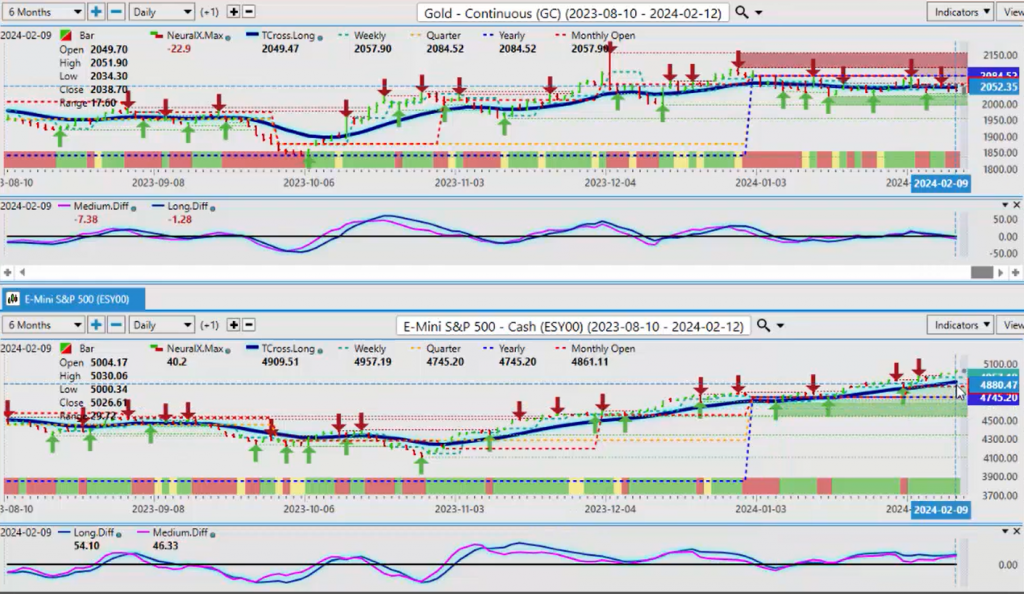
But once again, when we, over the years, what I’ve also seen is a positive correlation, as you can see by this chart, between gold and the S&P 500. So, gold is really holding on here, and that is why we keep a very close eye on these direct correlations, so we know, or we have some idea, what to expect. But right now, with Bitcoin, you can see that Bitcoin, once again, it can co-correlate positively to the S&P, positively to gold, uh, so it really is becoming an asset class of its own, and we would be looking, uh, still to monitor these correlations very closely, but the main driver would still be the US dollar.
So, with that said, this is the V Point AI Market Outlook for the week of February the 12th, 2024.


