


VantagePoint AI Market Outlook for the Week of January 25, 2021
VIDEO TRANSCRIPT
Hello, everyone, and welcome back. My name is Greg Firman, and this is the VantagePoint AI Market Outlook for the week of January the 25th, 2021.
U.S. Dollar Index
Now, to get started this week, we’re going to begin where we always do it with that very important US Dollar Index, a driving factor in our commodity trading, our currency trading, and even indirectly in our equity trading around stocks in the S&P 500. So, when we look at the current situation of the Dollar, yet another sell signal is forming after yet again, another failure at this 91 level. Now, at this particular time, the indicators are somewhat mixed. We’re moving below this key level, which you can see that this is on a Thursday and Friday. The Dollar has predominantly been quite strong during the course of the week, particularly against its main rival, the Euro. That’s the correlation we want to watch. Which currency is in control, the Dollar or the Euro? And then the other currencies tend to spin-off of that.
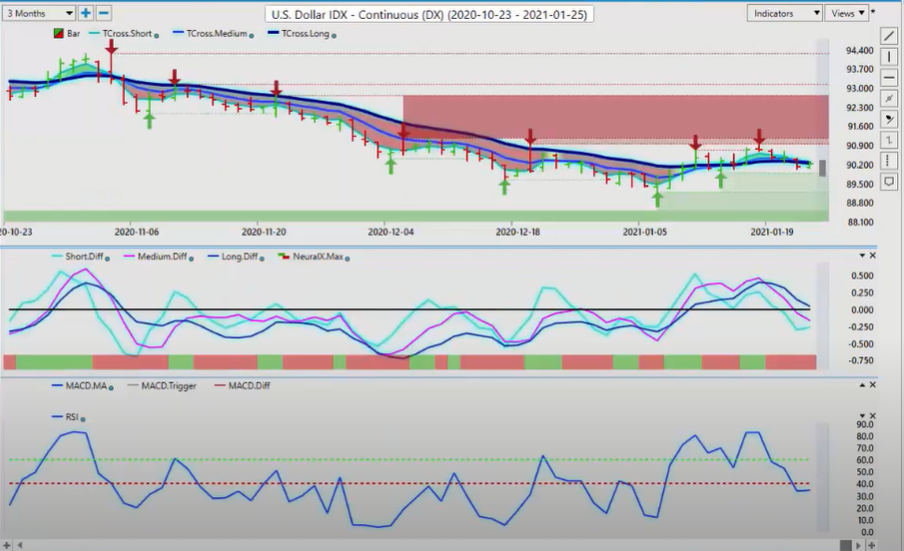
So, right now, we have very significant resistance, T cross long, 90.25. We’re closing about 90.21. Once again, when we click on our F8, a leading indicator using this blue line by itself and seeing how the market is reacting to it. Now, as the market starts to struggle with the VantagePoint predicted moving average, we start to turn more bearish. But to be clear, the medium term crossing the longterm predicted difference, with the Neural Index, is warning us that, at the very least, we are going to correct lower. This is perfectly normal at this time of the month, because the Dollar usually strengthens between the 30th and the 10th into the new month, is that cycle of Dollar strength. So, we would expect some weakness at this time of the month, either way.
Now, our RSI is starting to flatten out. We’re below 40, and obviously holding below 50. But you can see that the RSI is not showing a lot of downward momentum here, as it’s starting to flatten out. So, this tends to, that would suggest to me that maybe the Dollar is not going to break down. Now, if we look at the CFTC, the Commitment of Traders Report, the market is still very heavily net long, the Euro, and net short, the Dollar. That trade has been very, very crowded for a long time.
So, whenever I see that, I’m always cautious about jumping on that particular bandwagon. I would look for, if we can break below this key 89, right around the 89, 90 level, if we can break down below that, which at this particular time, I’m not convinced that we can, we would then immediately target the next verified support, which would be 89.16. In my respectful opinion, for the Dollar index to get, if it can even get down to that level, by the time it does, we’re likely going to be starting into the new month and we would see that period of Dollar strength.
When looking at our currency trading here, once again, we must use inner market correlations, guys. Back off the indicators a little bit.
Gold
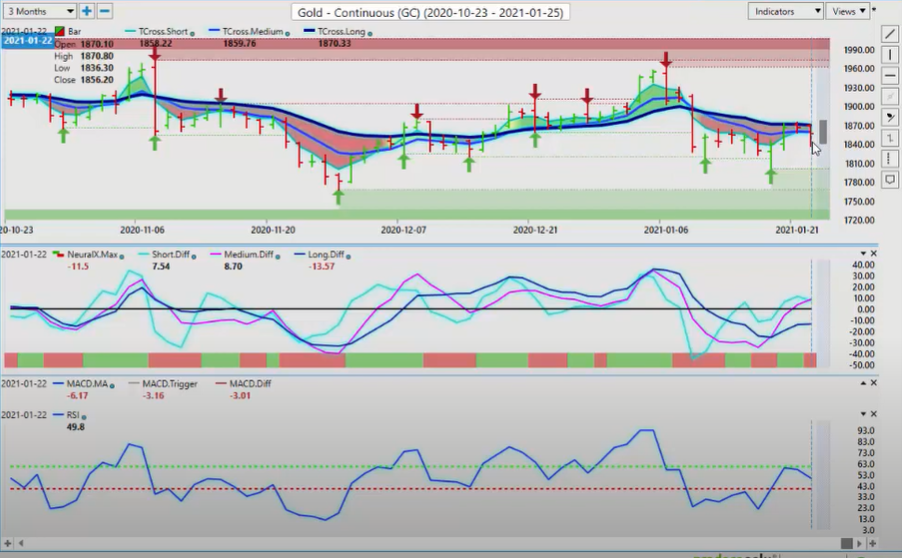
Like I’ve always said, indicators are fun, but trading is hard. We need to look at these key levels. So, if I’m using the inner market correlation of the Dollar to gold, I can see that gold is, again, unable to break through the T cross long at 18.70. We’ve come up to it three days in a row and failed miserably. Now, the VantagePoint software has clearly shown us that we are correcting higher. It is not at this current time showing a new bull trend in gold. Until such time, we can break above 18.70, close above it two days in a row, but we have further resistance at the 19.04 level.
You want to put the yearly opening price directly onto your charts. Very easy to do. If you just put a little bit of a line right there and say, “Okay, right at 19.04 is the yearly opening price. Again, so even if we did get above the VantagePoint, critical T cross long, we still must break above the yearly opening price to confirm that gold has further upside. But as we can see here, using a 60/40 split on our VantagePoint software on the RSI, instead of a conventional overbought or oversold and just gauging momentum, we can assess here that as we came into that critical T cross long from VantagePoint, the RSI rejected the 60 level and said, “Look, this is likely corrective in nature. We don’t have a new trend yet.” So, look for a break of that level, but again, be very, very cautious between 18.70 and 19.04 on longs.
S&P 500 Index
Now, the S&P 500, it’s had some bumps in the road, but it continues its move higher. The news, the stimulus package coming out of the US should boost equities further. But once again, this trade’s getting a little bit crowded here, too. So, in my respectful opinion, I would like to see a pullback towards the yearly opening price on this, also around 37.55, but at least a little bit of a pullback down to 37.78. Let this thing cool off a little bit, then we can re-gauge that whether it’s going to go up or not. One of the easy ways of doing that is again, clicking on the F8 in the software and using that blue line, the predicted moving average as a pivot level here. You can see, when the market crosses above it, usually we have a pretty good move to the upside or the downside, depending which way it breaks, but the primary trend remains to the upside in the equities.
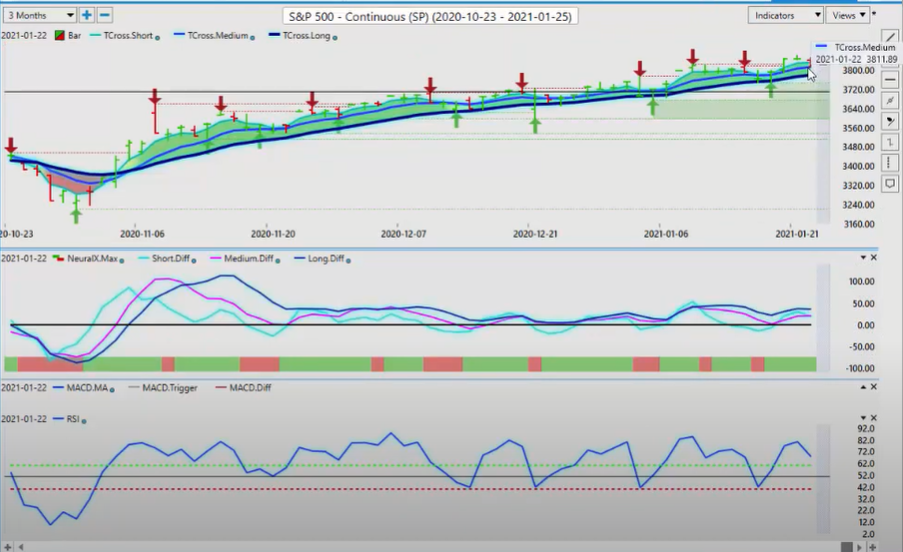
This is supported by a dovish Fed, the stimulus package should help equities along. But once again, I would like to see a corrective move. Now, with our oil contracts, once again, we’re exactly where we were last week in the Weekly Outlook, where I warned everybody that, “Look, we’ve got a verified resistance high up here. That’s coming in at 53.98.” I didn’t anticipate last week, excuse me, that we would get above that.
Crude Oil
Now, one of the reasons that I’m saying that is because we’ve got issues with Keystone Pipeline now, but the COVID virus is not going away here, guys. Last year in February and March, we saw oil go into a free fall based around supply and demand issues, meaning very high supply and very little demand, with the global economy shutdown. Canada, basically, again, going into lockdown. I think so is Europe and some of the other countries.
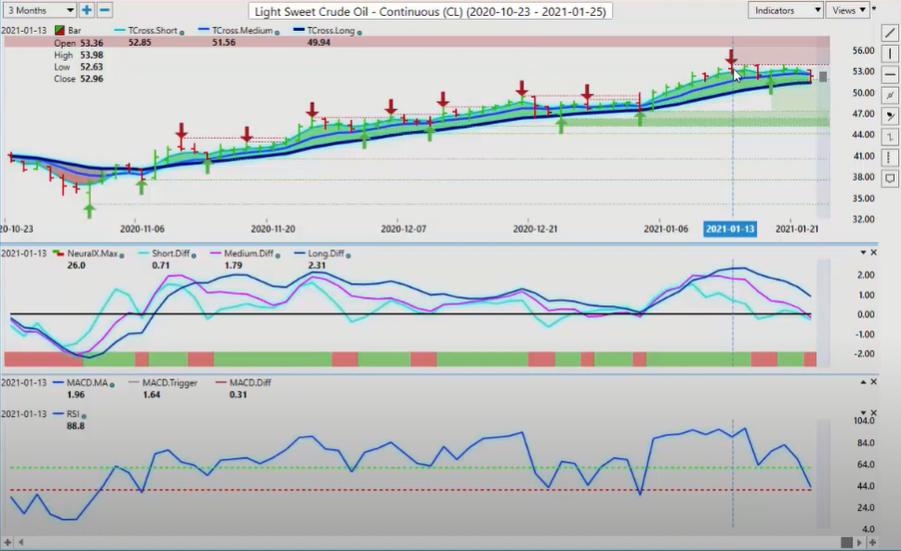
So, there’s not going to be a lot of demand here for oil in the coming months. So, I could see us taking out this 51.37 area very soon. And once again, when we look at our VantagePoint software, we can see that pink line crossing the blue line. This pink line represents the medium-term trend strength. It’s crossing over the longterm trend strength, excuse me. And when we see this, it’s just a warning sign telling us that, “Hey, maybe we should not buy up at these higher levels, because this trend is not strong up here.” So, we’ve been sitting up here now for two, four, six, eight, about 10, eight, nine, 10 days, we’ve been sitting up here and unable to break it. Now, if we can break above the high of 53.98, I think we would have to make some more progress with the vaccines, opening up the economies.
But if that doesn’t happen, then that could be a deathblow for oil going forward.
Bitcoin
Now, when we look at Bitcoin this week, once again, I’ve worked that into the weekly outlook, because again, we hear a lot of people back and forth, “Bitcoin’s a scam, Bitcoin’s this, Bitcoin’s that.” Well, guys, some of the ones that have actually forecasted Bitcoin to where it is now, me being one of them, some of the other analysts, too, that I’ve watched, there’s been some very aggressive calls here. JP Morgan at 146, some other very well educated, I’m not the most educated on Bitcoin. I just follow charts and inner market correlations, but they’re calling for 246,000, some of them, on this. I don’t know if we’re going to get there, guys, but I’m pretty confident we’re going to continue to move higher, after we get a corrective move lower.
Now, this black line, again, that I have on the screen here, just a little side note, add it to your charts, guys. That’s about the 29,000 level, the yearly opening price on that. We came right down to that level, maybe a little below that level, I think around 28,500 on Friday, and then a very aggressive bounce out of that particular level. So, that’s a good sign. We’ve got a reverse checkmark on our predicted RSI. And again, when we’re looking at that Neural Index, still probably a little more downside on Monday. But again, we’re in coming into a period, what would normally be Dollar weakness. So, remember what this is trading against, BTC/USD it’s trading against. So, if the Dollar does weaken, if the signal we’re getting on the Dollar index comes to fruition, then that would push Bitcoin back up next week.
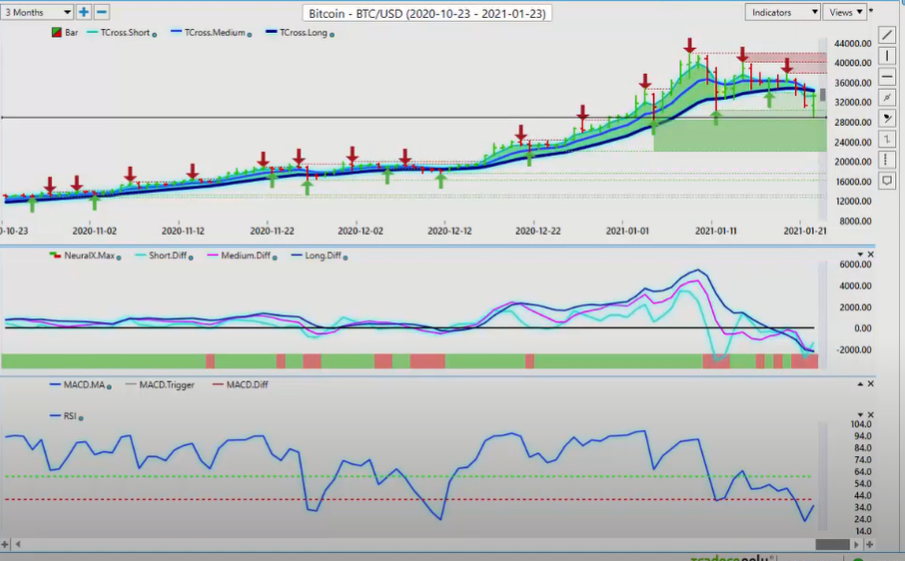
So, we’ll watch that one very closely. But the main thing we have to do here is we’ve got to get above this T cross long, 34,284. We get above that level, you could even, I would be so bold as to even suggest have limit orders, sitting just above that area. So, when it goes up there, your limit order is triggered, and bang, you’re in a trade. The additional way we can do that is using the predicted moving average by itself. That level is at 34,098. That’s where I would likely would put the buy orders just above that area. Because again, with this reverse check mark, it’s telling us that we’re losing momentum. I have no interest whatsoever in using an RSI, as overbought or oversold, or a stochastic, or any of these conventional oscillator type indicators. But a 60/40 split, it’s just telling me if I’ve got momentum in the market.
And right now that predicted RSI is telling me I don’t have a lot of downward momentum here. I’ve cleared out a couple of levels. Bitcoin, let’s face it, is moved up very, very fast in 2021, a corrective move is perfectly normal. But 29,000, guys, keep an eye on that, but in my respectful opinion, again, only, if we came down into the 19,000, I could only hope we could come down to 20,000 again, so we could pick this up long.
Euro versus U.S. Dollar
Now, when we go into our main forex pairs for this coming week, the Euro, again, struggling, the better part of the week. We started to flatten out here, again, on about the 18th, and then we get a reversal signal from VantagePoint, the medium term crossing the longterm predicted difference. Now, this indicator is a dual purpose for us, guys. Number one, it tells us to stop selling, right here, basically tells us to stop selling and warns us, if nothing else, we’re going to have a corrective move higher.
And how I gauge that corrective move is using the VantagePoint T cross long, 121.61. So, we’ve come up and hit it three or four times over the last couple of days, and it’s failed each time. So, a good selling opportunity. Once again, if we click on our eight and use this blue line by itself, technically speaking, we have a two day close above this blue line, that suggests the Euro is going higher. Now, when we look at saying it’s going higher, we like to put in targets. So, I would put a target of about 123.49. But once again, you have very significant resistance sitting about here, and that is the yearly opening price. We cannot say the Euro is bullish until such time it’s actually positive on the calendar year. It is technically bearish, in my respectful opinion only, while we’re below that 122.30 area.
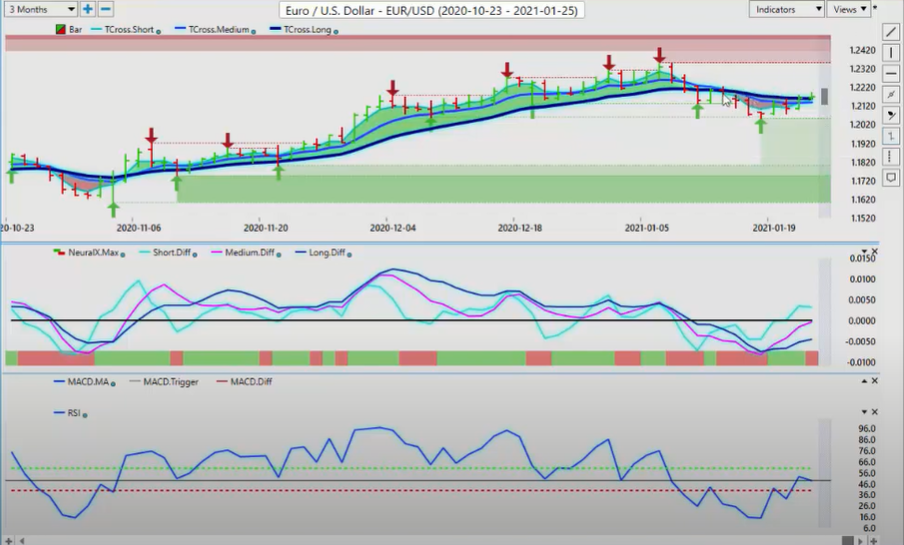
So again, keep an eye on that level. If the market mysteriously starts to stall out around 123, 122.30, excuse me, then you’ll know why. But right now, the predicted differences are still going higher. My concern, my very serious concern is as I’ve already stated, number one, net longs by the CFTC, even though the Commitment of Traders Report is a grossly lagging indicator, it still warns us that, “Look, you’ve got a lot of people in Dollar shorts. You’ve got a lot of people on Euro longs.” The powers that be keep telling us to buy Euros. However, the Neural Index being red, in a two day moderately bullish move, again, but you can also see this overshadowing here in the VantagePoint software, this red here. And that’s still a problem area is what we will call that.
So again, keep an eye on the levels that I’ve mentioned, and also we need to see if we can get the predicted differences rising above the zero line.
British Pound versus U.S. Dollar
Now, the British pound is still lingering around this 137 area, and it’s struggling. You can see we’re in the early stages of a medium term crossing the longterm predicted difference. Again, this is both a trending and a contrarian indicator because this is warning me, telling me, “I don’t think I want to buy up here anywhere near this 137 level, as long as while these predicted differences are in the process of crossing.” The RSI is, again, one could argue it’s rejecting this level up here. So, if I put this in here and I drew a line on my RSI, all of a sudden I would see a lot of resistance on this RSI up here.
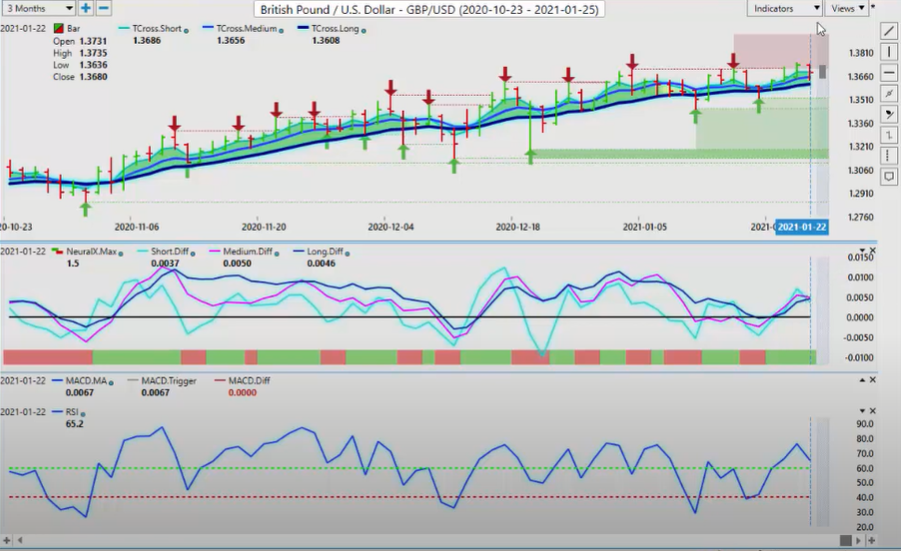
So again, with that reverse check mark pointing down, suggests that, “Look, we’ve got a bit of a problem up here.” Now, 136.08, the way to use the VantagePoint software is theoretically, it’s still a long while above that area. It’s still bullish, in theory. So, when we click on our F8, once again, you can see the market, when it moved above this blue line, it then used the predicted moving average as a daily entry point for longs. So, as long as we can hold above 136.65 and the 136.05 level, then the Pound would still technically be bullish. But again, there’s some fundamentals at play again here. I think that we may see the Bank of England flip-flop on the interest rates. And if they cut, that will really be a devastating blow to the Pound, likely sending it back the 134 area.
So, watch the Bank of England, see which direction they’re going to go on this. When we look at the Dollar Yen next week for this coming week, excuse me, because again, this is an outlook, not a recap of something that already happened. We’re forward looking as to what we’re doing now. Where the Dollar Yen sits right here is largely going to be determined, again, by gold. Now, people have asked me, why is gold failing? What is going on here? Well, number one, we’re below the yearly opening price on gold. We’re below the VantagePoint T cross long.
U.S. Dollar versus Japanese Yen
So, this directly relates to the Dollar-Yen. If gold can break above the aforementioned levels, mainly the 19.04 levels, the one you really want to watch, if that happens, that will send Dollar Yen spiraling down very, very quick.
However, if gold cannot break through that level, then the Dollar Yen will follow the S&P 500, and likely go higher. So again, we’re in a very difficult area here, but when we look at the RSI starting to turn back up, the predicted difference starting to turn back up, the Neural Index positive, and we’re closing the week above 103.66, there’s still hope here for the Dollar Yen that it can move higher. When we click on our F8 and look at our blue line only, this is a big level also for us, 103.69. We need a couple of days closing above this, though, to be clear. Very choppy back and forth here, both very strong resistance. I would peg the main resistance here, guys, in my opinion, at 104.48. But the immediate resistance we have to take out would come in at the high of 104.08.
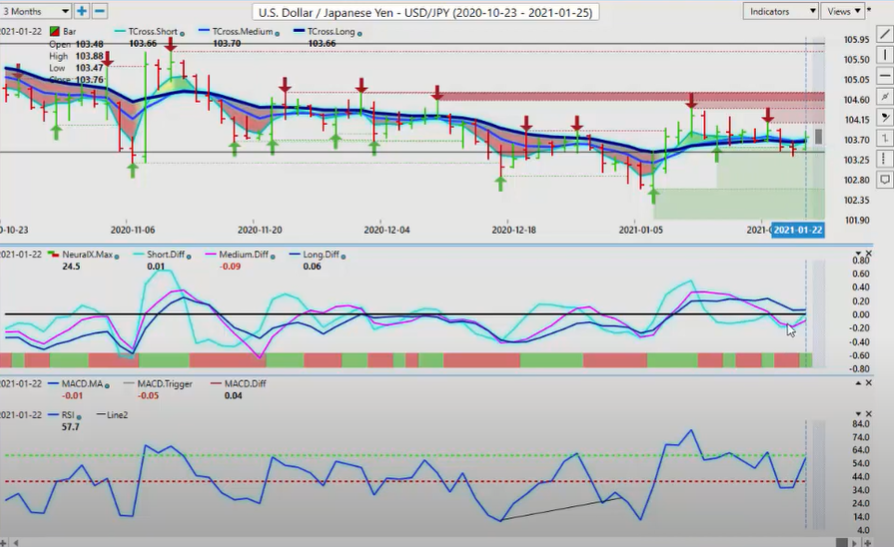
And then that would be followed again by the 104.40 area. But what is a little troubling here for me is these arrows that are coming down showing in a step formation. There’s no elevator here, guys. It’s a nice orderly step formation coming down. But these two bars here, you’ll notice these two red arrows here. They have closed above this resistance. We’ve been flirting with this high around 103.25. So, if we can hold above one 103.25, I think the Dollar Yen can go higher. But again, COVID is a positive for gold, so we’ll have to monitor gold very closely if we’re trading this pair.
U.S. Dollar versus Canadian Dollar
Now going into the US Canada, the Bank of Canada, a little bit more optimistic this week, but we know the Bank of Canada flip-flops back and forth.
What we need to watch with the US Canadian pair is, I’ve already discussed the fundamentals, the concerns I have about the Canadian economy, the lack of vaccines, the ballooning deficits, but everybody’s deficits are ballooning. Everybody’s printing money. So, when people say to me, “Well, the US Dollar can’t go any higher because the amount of money they’re printing.” Well, so are all the other countries, guys. So, it’s the prettiest horse in the glue factory. How about we’ll call it that? So, right now, if oil is getting ready to turn lower, then that is what’s going to hurt the Canadian Dollar. If the S&P 500 moves lower with oil also, that will not help the Canadian Dollar. Most of your banks are forecasting into the end of the first quarter, around the 134 level, but they flip-flop back and forth too. Long-term forecasts in a market like this are simply not trustworthy, guys.
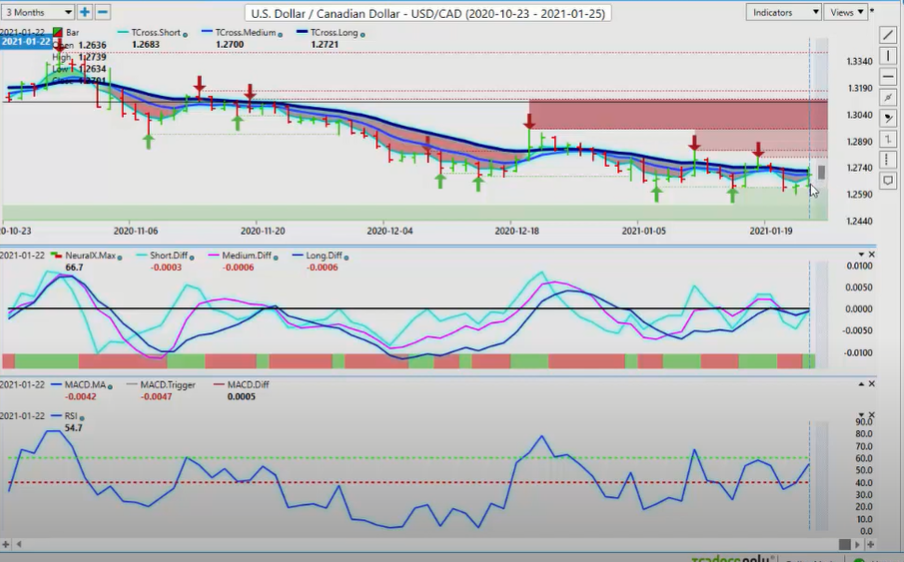
When we break it down into layman’s terms, so we can all understand this, 126.30 is a major support level. I think we may have a new verified support low off of 125.90. These are the games that brokers play with us, guys. They run the stops about 20, here’s a piece of advice too, and I say this to my own direct clients. Don’t ever put your stop on a round number, like 126. Always give yourself about 30 pips below or above that round number. So, if I was shorting this thing up into the 127.40 area, I would put my stop at about one 128.30, giving myself at least 15, 20 pips outside of that round number. This is what I told my guys here this past week with US Canada. If you want to try a long off the verified support, which did work, but again, make sure you give yourself some breathing room around that.
Now, if the US Canada pair, if oil drops, then that would send the US Canadian pair higher. So, if I look at one year ago to the date, here’s where we were last year. So, we’re slightly more bearish than we were last year, but you can see, one year ago, we had one heck of a rally here up. But again, that’s not based around the fundamentals, per se, in Canada. It was based around the shock of the COVID virus. So, that doesn’t mean that’s going to happen again this year. And again, with the Bank of Canada a little bit more optimistic about the Canadian economy recovering from this, I think it’s very premature to say that. But if the market believes that, they will very quietly start buying Canadian Dollars. But here is my point on this, technicals, fundamentals aside, the driving factor of the US Canadian pair is inner market correlations, the correlation to the S&P 500. If the S&P 500 drops, US Canada is going to go higher, and vice versa.
That’s the game here, guys. You may not like what I just said there, and say, “Well, what about Fibonacci? What about my Elliot Wave? What about this? What about the fundamentals of what’s going on in Canada?” Well, guys, this pair has ignored all of those things. Okay. And I talked about it last week.
Australian Dollar versus U.S. Dollar
I split the charts so everybody could see it, and I also made reference to these two pairs, the Aussie and the New Zealand, very similar. They will go higher as long as the S&P does, but if there’s any disruption in a risk on environment, these currencies don’t stand a chance. All three of them, Cad, New Zealand, Aussie. So, the Aussie is basically just teetering on the cliff here, but it hasn’t gone over it just yet. 77.02 also is the yearly opening price on here, guys.
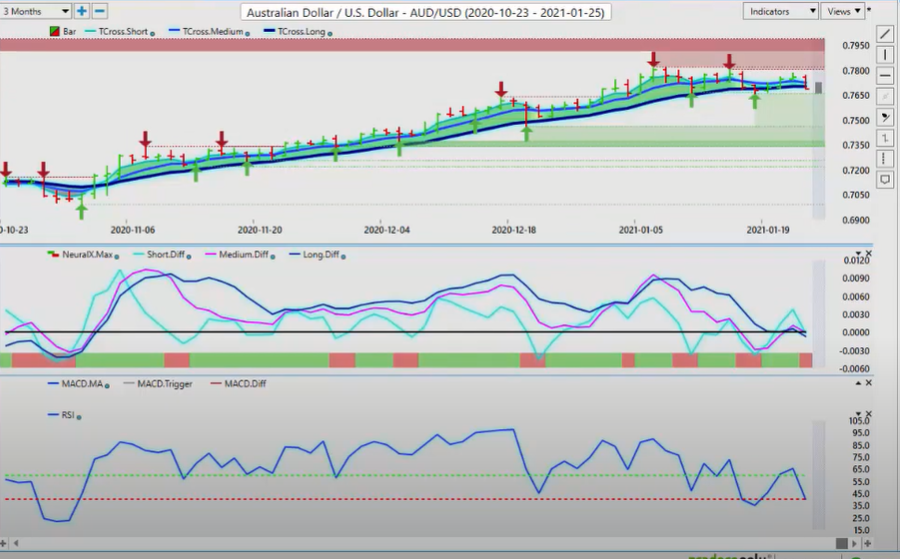
So, we want to watch this level like a hawk. Right now, we already had a buy signal here on the medium term crossing the longterm predicted difference, but that was short lived. In my respectful opinion only, this is what Friday’s bar looks like. The S&P was down on Friday. Nobody wants to hold longs over the weekend on equities, or Bitcoin, or even gold and some of the currencies right now, because we don’t know what’s going to happen over the course of the weekend. So, a lot of times what happens is by late day Monday, or early Tuesday, money goes back into stocks. Money goes back into some of the risk on currencies, like the Aussie, the New Zealand, and the Cad. Just remember when you’re trading, I know that the forex and futures market open Sunday night, but you don’t want to start your trading week here, guys, until after 9:30 AM, Monday morning, Eastern Standard Time.
New Zealand Dollar versus U.S. Dollar
You want all three markets coming in before you start getting trades. Now, if we can hold above 77 and the S&P 500 recovers, then again, forward-thinking here, using inner market correlations, then we would have a buy on the Aussie. But if the equities crash, then we also have an easy sell.
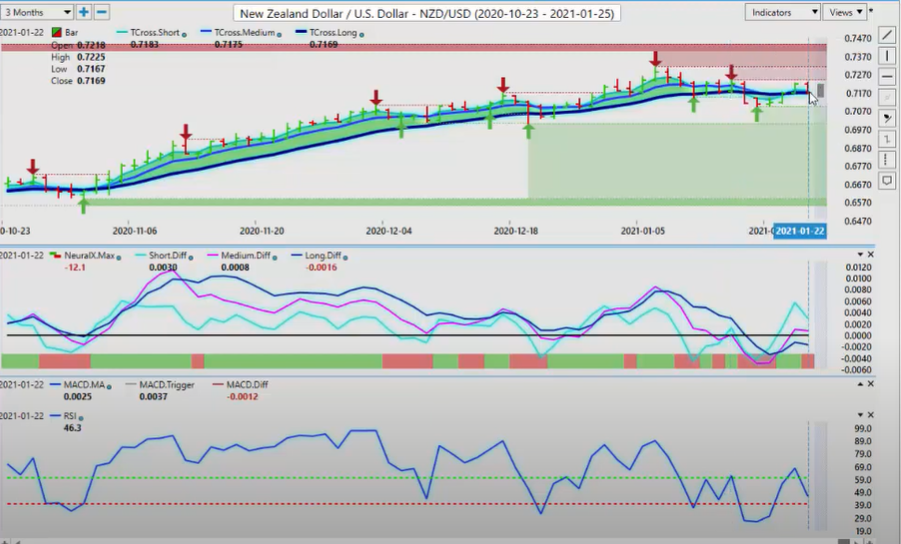
The same thing would apply to New Zealand. And now, the New Zealand, it’s putting up an epic fight here, and we actually have a fresh buy signal here. But again, we’ve got this choppiness and we’ve got this verified resistance high at 72.40. So, in my respectful opinion only, I don’t try and force my opinions on anybody. I’m just trying to lay it out for you all to play it out. So, if you know your levels, then you will know how to react to these markets. Now, 71.69 is that T cross long. If I click on my F8, I’m above both key VantagePoint pivot levels. So, if we can continue to hold, and the S&P 500 goes higher, than we’ve definitely got a trade here. So, with that said, this is the VantagePoint AI Market Outlook for the week of January the 25th-
Are you using A.I. yet?


