


Welcome to the Artificial Intelligence Outlook for Forex trading.
VIDEO TRANSCRIPT
Hello everyone, and welcome back. My name is Greg Firman, and this is the VantagePoint AI Market Outlook for the week of January the 29th, 2024.
Now, to get started this week, we’re going to do things a little bit differently. As promised, I was requested if I could show some of the international Equity markets, so what I’m going to do is show all of them and we’re going to do that as a comparison to our Anchor Point, which would be the S&P 500.
S&P 500 Index versus the DAX Index
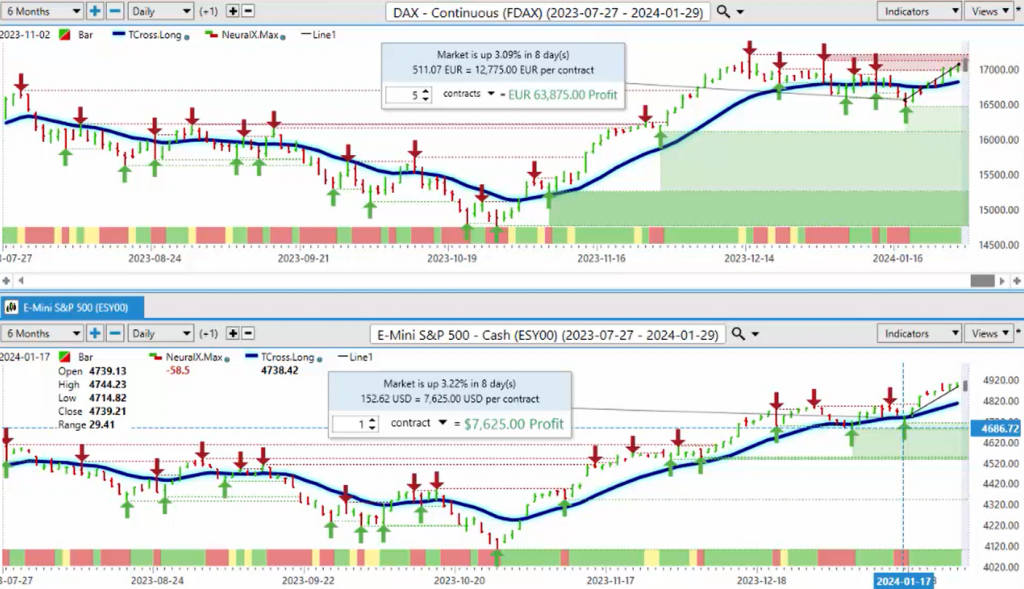
So, as we can see with our VantagePoint A.I. software, a very nice bull run up here started way back in November, based around that US dollar weakness, that seasonal pattern in the dollar in the US fiscal first quarter. So right now, we can see that the Dax 30 is exactly the same trade here, guys, a little bit of volatility around the ECB, but I’ve given some percentages. When the S&P started to break higher again, that specific date was January the 17th of this year, we can see that the Dax turned and started to move up at the exact same time. But when we look at the predicted moving average on the screen here, we can see that these two charts are identical, and that’s why on a weekly basis I just show the S&P 500, because it’s basically my go-to standard for the equity markets.
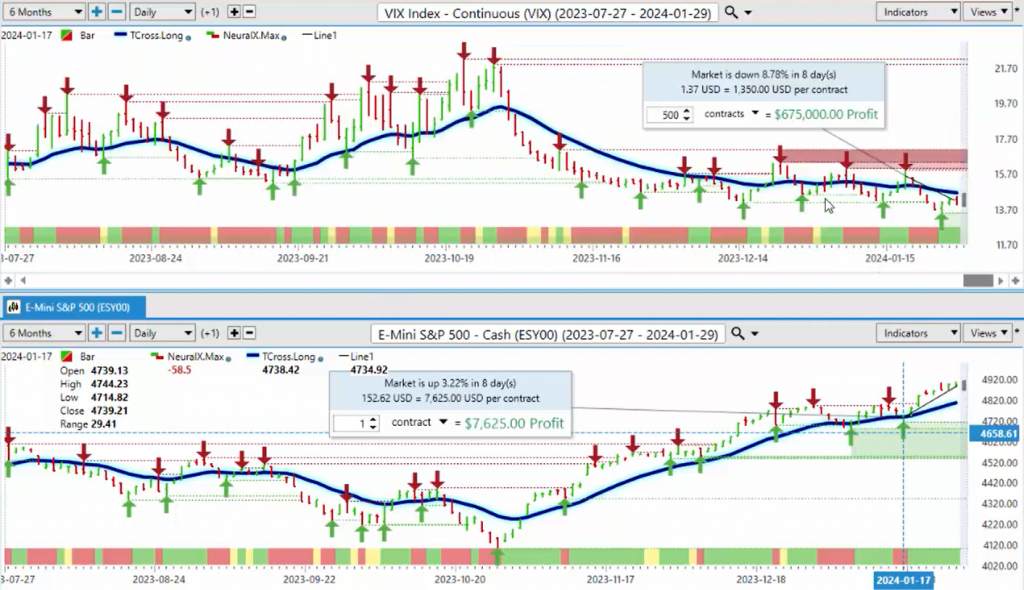
Volatility Index ($VIX) versus S&P 500 Index
When we look at how the VIX responds, we can see just a quick point of reference there too, guys, from that Rally Point here, we’re about three little over 3% on both since the 17th. So again, even on a percentage basis, they’re virtually identical. So with the Dax, we can see, again, we’re looking at our T cross long that’s coming in at 16,814, and we remain long while above that area, but some very stiff verified resistance on the Dax and that high 17,200.
When we look at the vix, the inverse to this, you can see the stock market goes down, the vix goes up. So currently, from the 17th, we can see that the vix on that day, that was the last day we had a rally in the vix, and down it goes, also about just a little over 8% versus the S&P.
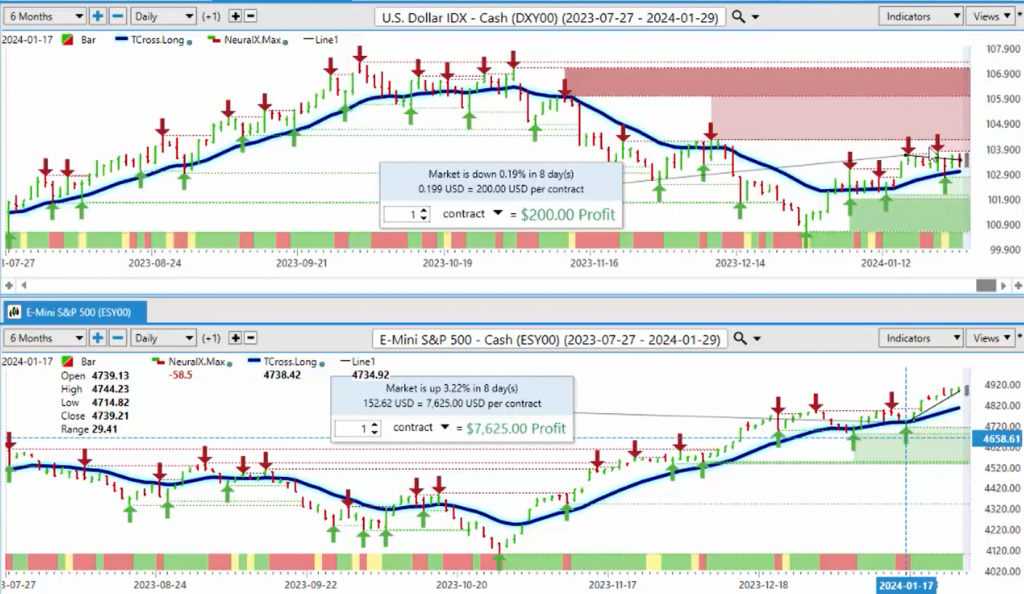
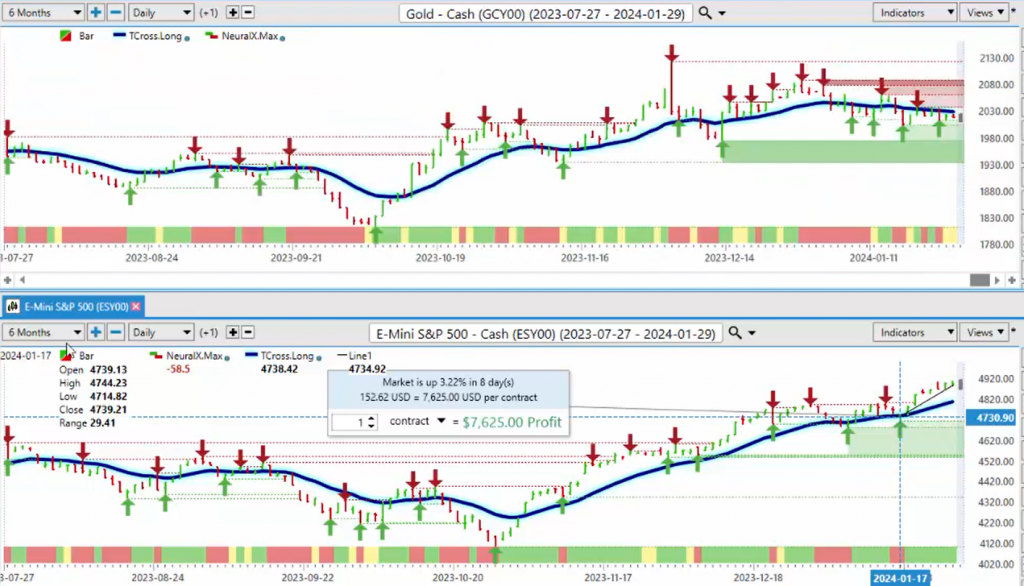
U.S. Dollar Index ($DXY) versus S&P 500 Index
When we do a comparative to the dollar Index, we can see the dollar Index is also above its yearly opening price. However, what I would point out is that this is something that is very rarely seen, where the S&P 500 and the dollar Index, they’re both above the Vantage Point TR cross long. The dollar index that that level now is coming in at or about the 103 mark. So again, as the predicted moving average moves up, that price has to keep pace with that, and we’re going into a very, very volatile week with the US Federal Reserve and the US non-farm payroll number, the ADP on Wednesday, the payroll number on Friday. So watch out for those two points.
When we look at the NASDAQ versus the S&P 500, again, you can see that these two charts are virtually identical. The NASDAQ pushed higher also on the 17th. Our key level there going into a volatile week, the T cross long 15,1123. We need to hold above that particular level in order for that NASDAQ to hold on to these particular gains.
Russell 2000 versus S&P 500 Index
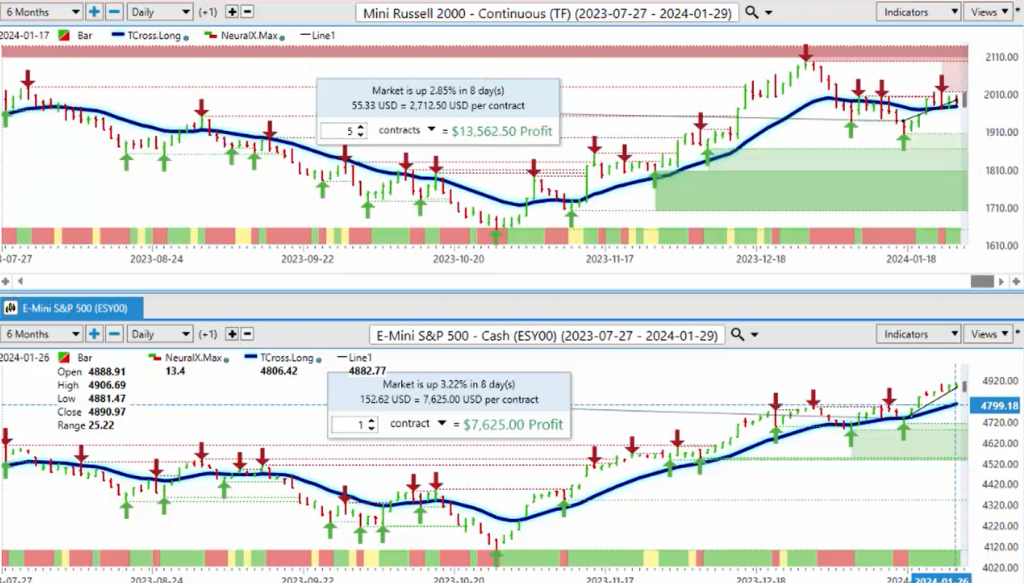
The Russell 2000, we can see the same thing on the 17th. This is, again, it’s easier to do this without an excessive amount of indicators and keeping the charts clean so we can just our eyes can follow along this blue line to really visually see the failure points and the reversal points in the market. So if the S&P 500 is my Anchor Point, if it starts to move up aggressively above the Vantage Point T cross long, the Russell 2 will follow, maybe not as strong, it’s about 2.85%, but still a very strong relative comparison.
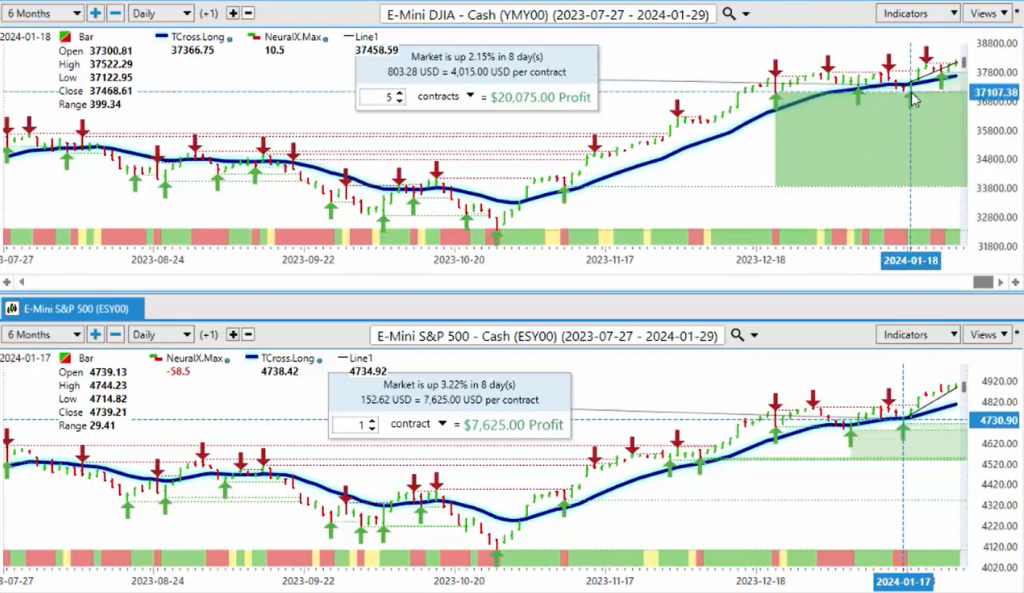
Dow Jones Industrials versus S&P 500 Index
The Dow Jones Industrial, the exact same thing. We can see on the 17th, it pushed higher. But when we look at the predicted moving average, we can assess here that this is, you can pick your poison, guys, but it’s the same trade, virtually almost identical.
The one that I will point out here, which is one we can, we need to keep our eye on, this one, in my respectful opinion, the Nikkei 225 is trying to buck the trend here.
Nikkei 225 versus S&P 500 Index
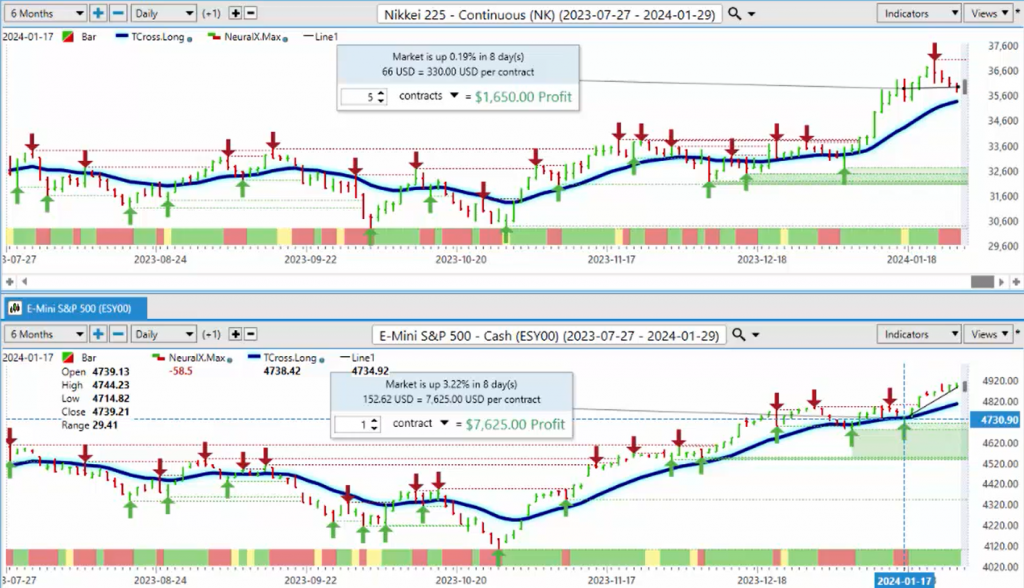
And we can see that we have a high point and a failure on the Nikkei at, that’s coming in around the 37,000 mark. That’s concerning because I believe that the Bank of Japan is going to intervene in the currency markets. If they do, then the Yen will, the exact opposite is going to happen. The Yen is going to strengthen, the Nikkei is going to drop very hard. So I’m not saying that’s going to happen, I’m saying I’m always looking for a needle in the haystack, and this is starting to move down aggressively while the S&P is still moving higher.
So again, that is definitely a point of interest. Well, and I will concede here that from the 17th, it did rally up, but it’s not holding those gains. So I think the market is a little bit nervous here as to what this Fed is going to do. And not just that, but what the Bank of Japan is going to do.
HangSeng Index versus S&P 500 Index
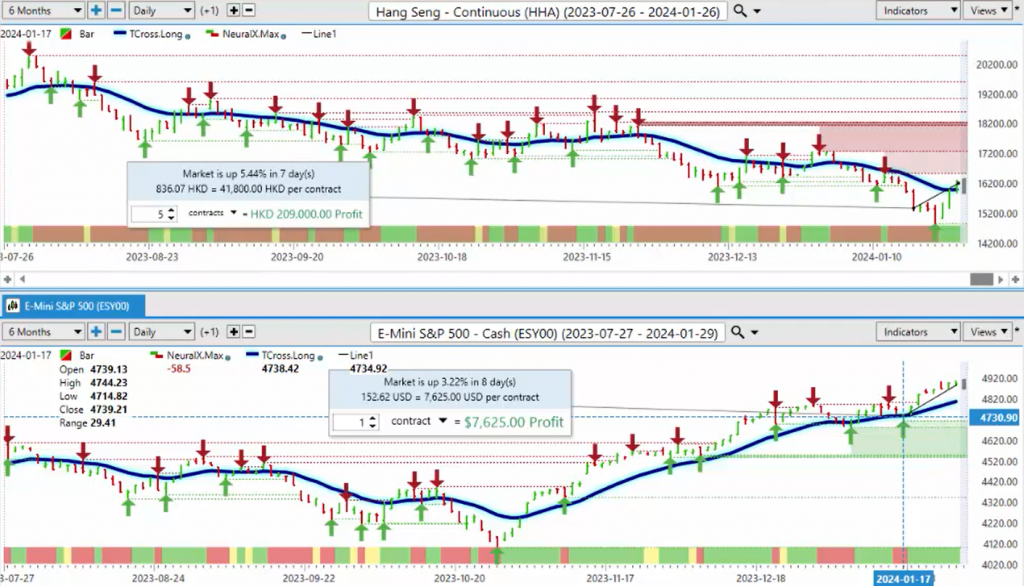
Now, the Hang Seng, again, not 100% correlation on this, but still relatively strong. This trend separating or inner market correlation separating a little bit around mid-November. But again, that correlation is still there. I’ve done an assessment there from the 17th when the S&P moved up. We were down for a few more days, but then we rallied up and we’re still outpacing the P at 5.44% once we get through that particular volatility.
DJ Euro Stoxx 50 versus S&P 500 Index
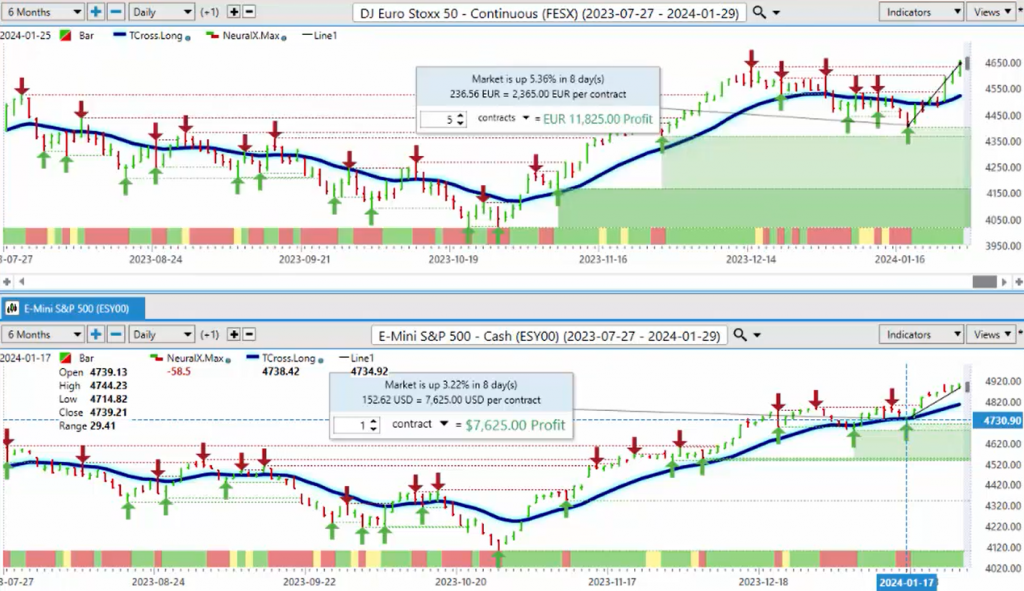
The Dow Jones, EuroStoxx 50, same thing here. On the 17th, S&P takes off. We were below the Vantage Point T cross long, but then we easily penetrated through that, crossed it, and extended higher for a gain of 5.36%. Our key support level there is coming in at 45, 4523. So still a pretty decent move up there, but be careful with these verified zones.
Gold versus S&P 500 Index
Now, when we look at gold prices versus the equity, there has been a relatively strong positive correlation between that. And I’m going to do gold next here in the same way, a little differently, so we can see how intermarket analysis works. So right now, gold is being pressured. But what I want to point out is that there’s actually about a 75% positive correlation here. Not so much over the beginning of the calendar year, but if gold continues to slide, then we could see the S&P 500 turn also. And I would say there’s a very strong possibility of that come around mid-February or even as early as next week, the week after next, I should say. But that key level on gold, that’s coming in at or about the TCross long, 2028. But we are holding above that psychological level. But the main thing is we want to see if there is any positive correlation between gold and those equity markets.
CAC 40 versus S&P 500 Index
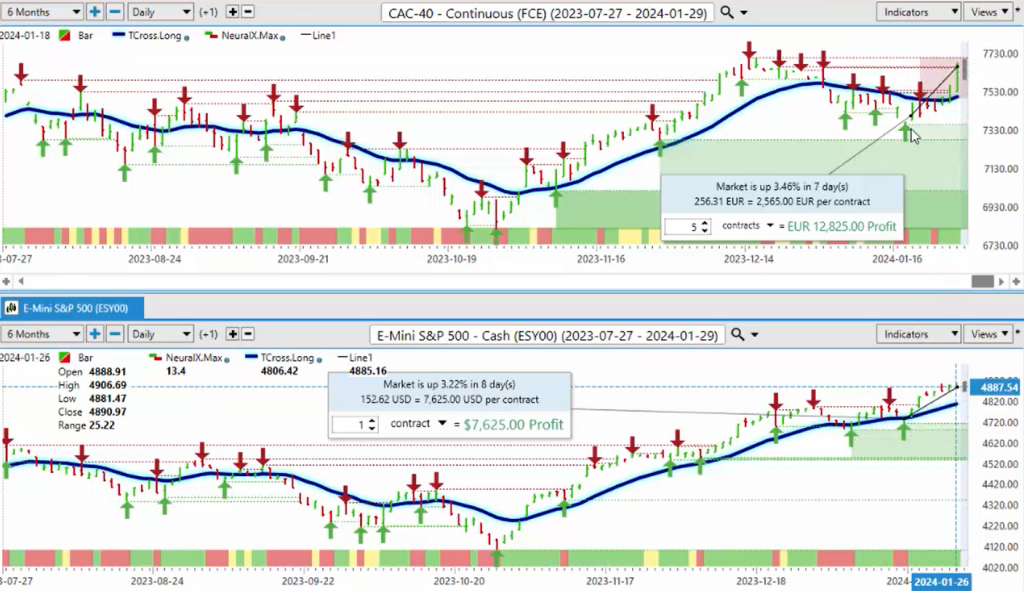
The CAC 40, same thing. We’re running below the Vantage Point T cross long, but on that spike up on the S&P 500, the CAC 40 also followed it higher for a gain of 3.46%. But the key point again is understanding the positive correlation that this has.
Bitcoin versus S&P 500 Index
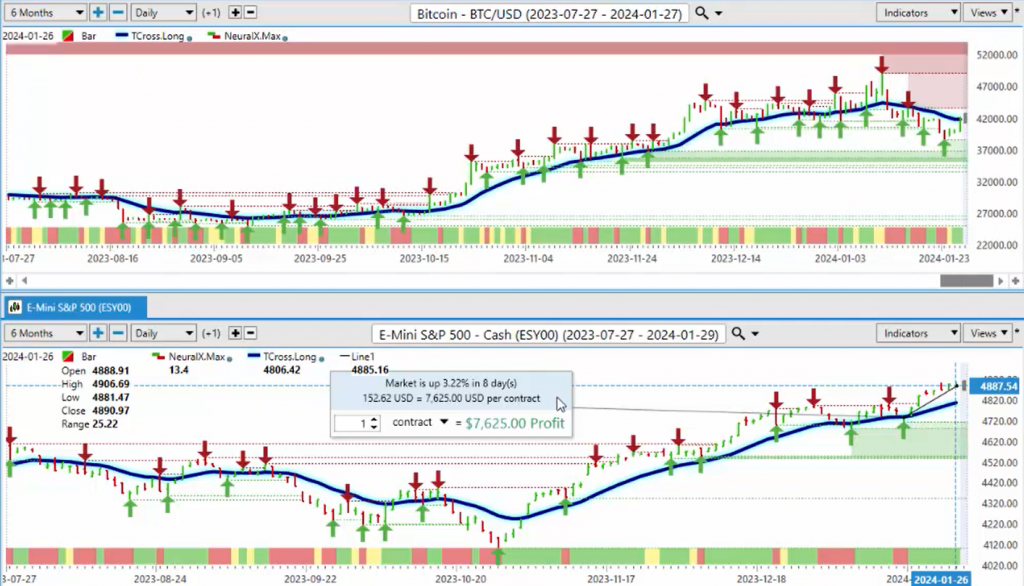
Now, with Bitcoin, as a correlation, Bitcoin is a very funny animal. I will say a number of industry professionals this past week suggested that Bitcoin was not a buy on this dip down. And in the VantagePoint A.I. point live training room, we did discuss this week, and it was actually an excellent buying opportunity. We will see some downside on Bitcoin for sure. But just remember, the general consensus here is that by next year, 2025, 2026 going forward, there’s still realistic expectations of Bitcoin hitting $140,000 to $150,000 or more. So anything at $38,500 or anything at $30,000 to $40,000 to me is a bargain. Even if you’re investing $100 a month in Bitcoin over the last 10 years, yes, it’s been very volatile, up and down, but the fact of the matter is you’re still making money with this thing.
So until such time as maybe after the halving event that’s coming up in April, but that’s always been positive for Bitcoin. So once again, it’s pushing a little bit lower, but there’s still been a relatively strong correlation, positive correlation. But I would put it down right now at about 65-70%. This is how we would look at these types of intermarket correlations. Now we can go over and look at some of the metals and then we’ll do our currencies. So that way we can cover a broad market, not just one single market.
US Dollar Index versus Gold
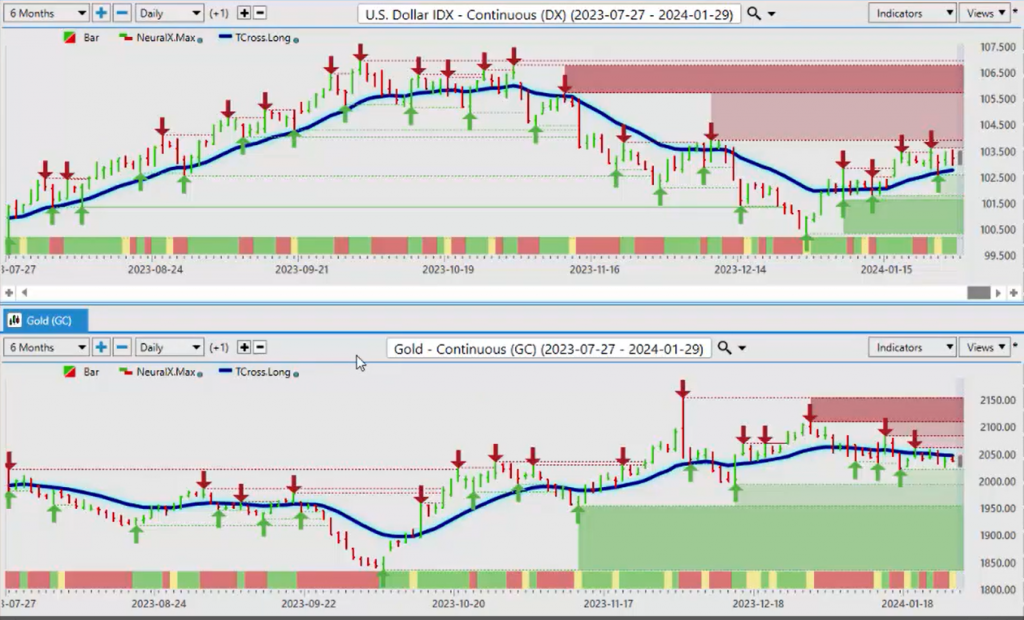
When we look at gold and we look at the main correlations to gold, then we can pull in and we can view uranium stocks, things of that nature, to see if there’s an opportunity there. So when we look at the inverse correlation, gold to the US dollar, the inverse correlation is about 90%. But I have seen gold and the dollar move both move up at the same time in the month of February. I will put that out there. But 90% of the time, it’s an inverse correlation. So when we look closer at the dollar index, you can see that gold is struggling to push higher. And this is the reason why the dollar, in my view, is struggling up here. It’s holding firm, but the markets are waiting for the Fed.
So when we look at that right now, gold is not going to make its move, neither will the dollar, in my respectful opinion, until we see what the Fed’s plan is here.
Cameco TSX versus Gold
Uranium Energy versus Gold
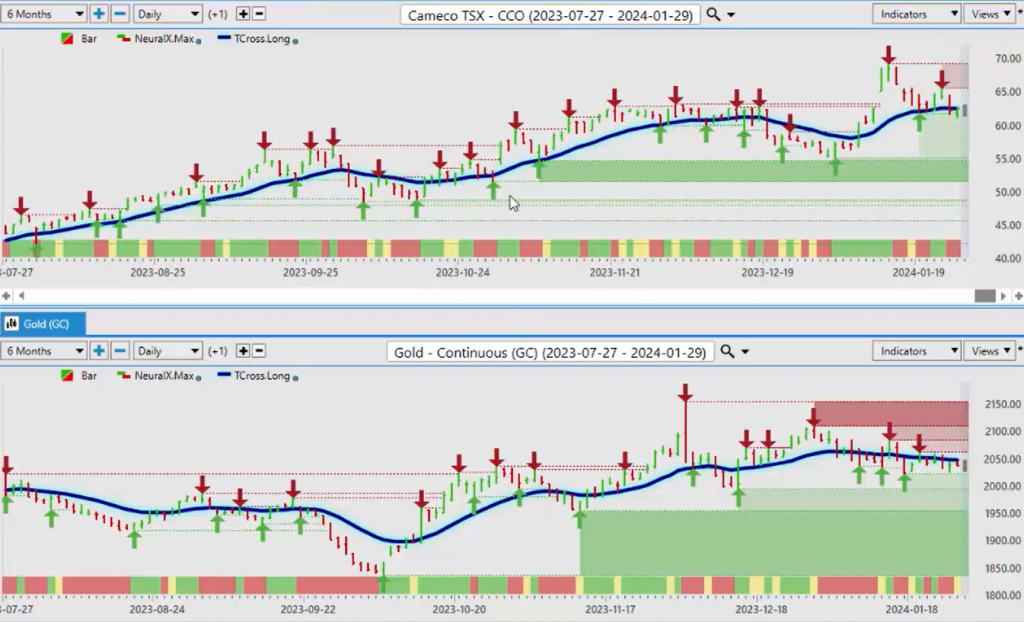
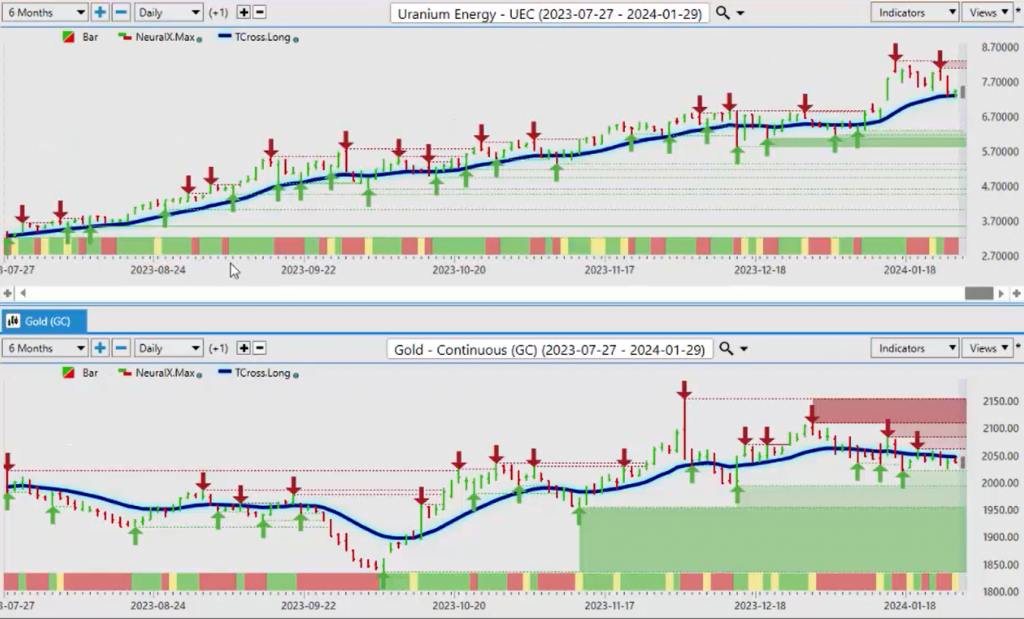
But when we look at some of the other markets here, like your uranium stocks, like Cameco on the TSX, UEC is another one, or Uranium Energy, we see that there’s a very, for the most part, there’s been a strong correlation between these two. Cameco is a Canadian stock, and this chart is almost identical to gold, very, very similar. So when we look at that, we want to make sure we understand how these correlations work.
But I remember months and months and months ago, I think it was actually last year when I had stated on one of these outlooks that I think that there could be a strong possibility that Bitcoin could correlate positively to gold.
Bitcoin versus Gold
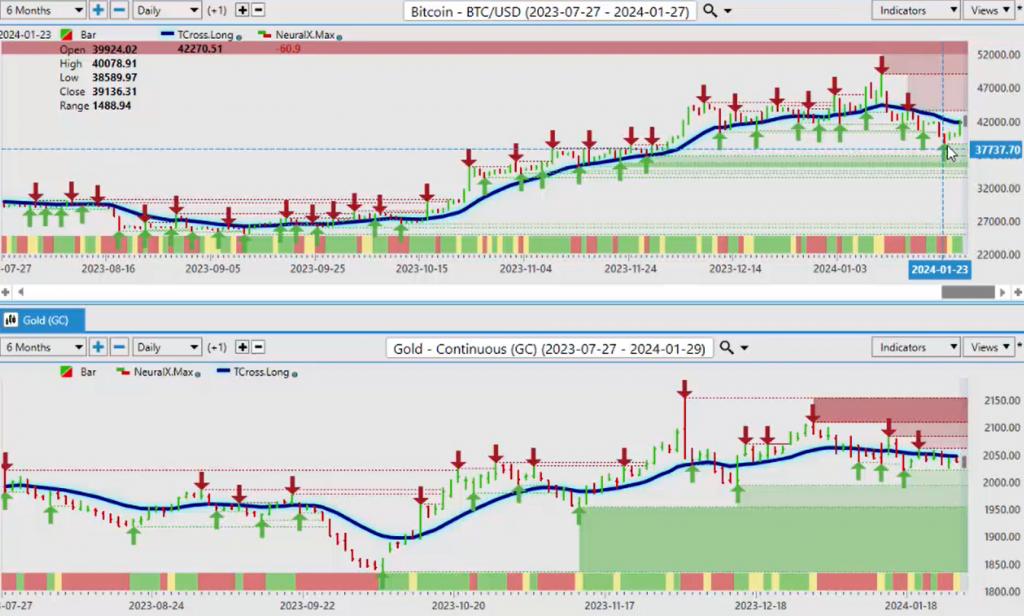
And we can see that that’s actually come to fruition. Bitcoin will correlate to, in my view, whatever it feels like correlating to, but it predominantly is going up. But this most recent stalling out in gold, you can see that Bitcoin has moved a little bit lower. So that triggered the analysts to say Bitcoin’s going lower; it’s not a buy. I respectfully disagree with that, and I think it was a great long trade. We had a newly formed verified support low, $38,5189, and that’s our support for next week. And I’m sure it will be retested because again, we’re going into a very, very volatile week.
But in my view, only a trending move will come from this data, good or bad, or indifferent. There will be a trending move coming in the next probably in the next 5 days. So we’ll keep an eye out for that. And again, knowing these key levels, our T cross long, $41,88 is the level we need to get above in order to keep buying up here. But again, in my respectful opinion, investing in Bitcoin has made a lot of sense over the last 10 years, despite what some of the industry professionals have said.
Light Sweet Crude Oil versus Gold
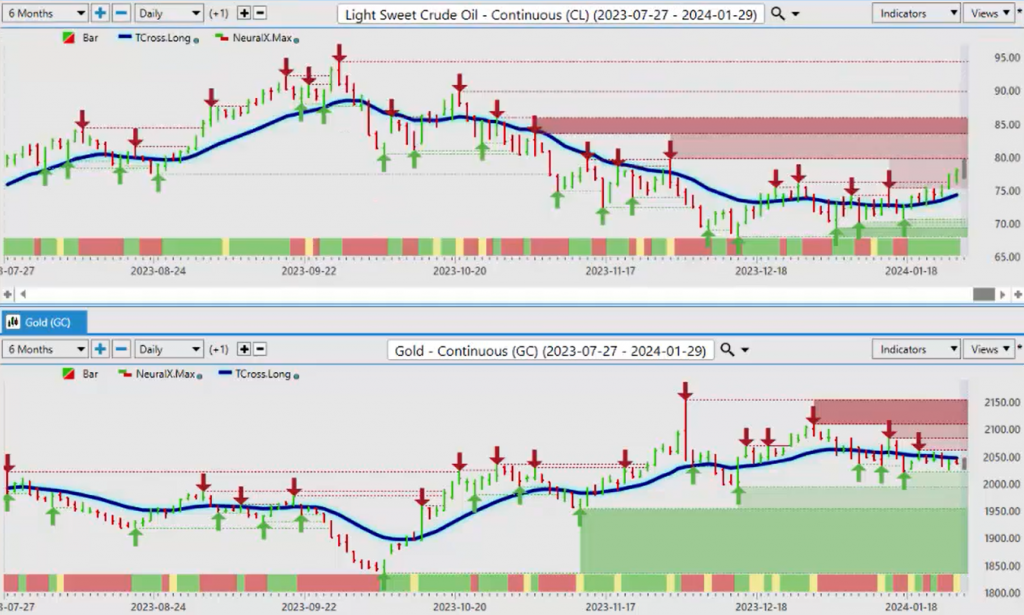
So when we look at the gold prices and light, Light Sweet crude oil, well, there’s more of an inverse correlation to these. But when we look at things like copper, again, almost identical to the gold contracts, palladium, very, very similar contracts, platinum, platinum’s a little choppier, but you can see that if this was a, you know, like a line graph, this predicted moving average, the TR cross long, you can see that these metals are just sitting there waiting for gold to move higher.
Copper versus Gold
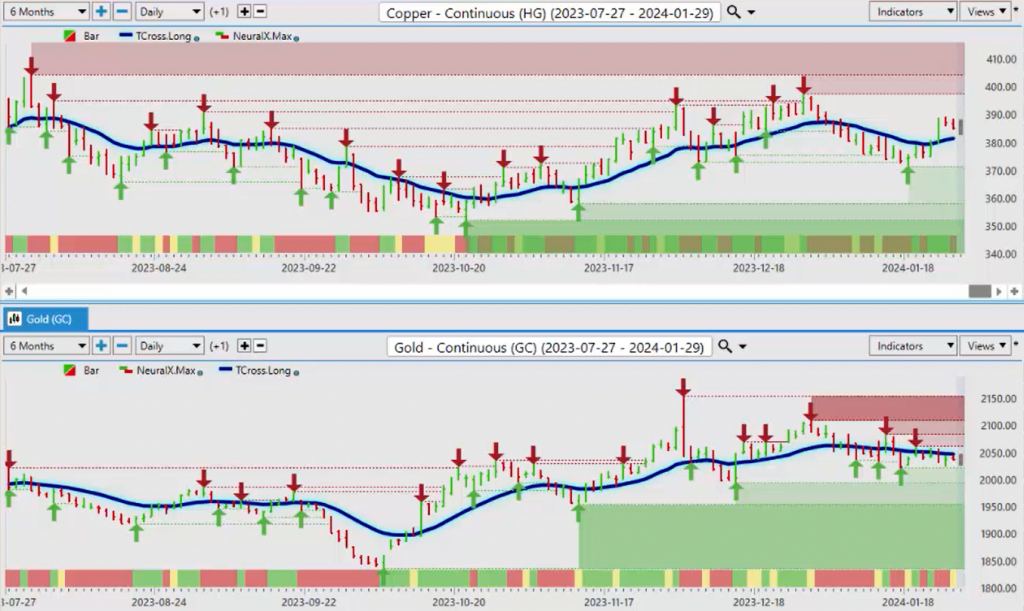
So, the one that I find the most interesting here is copper. Is it possible that copper is a leading indicator for gold and that gold is getting ready to spike? I can’t rule that out, but that is the whole concept behind the Vantage Point software – identifying these intermarket correlations. I’m simply pulling them to the forefront so you can visually see them. Internally, in the Vantage Point software, it looks at 31 correlated markets, positively and inversely, and then it plots it via the Neural Index and the Predicted Moving Average.
So, once again, looking at that Neural Index gives us a leading indicator.
Silver versus Gold
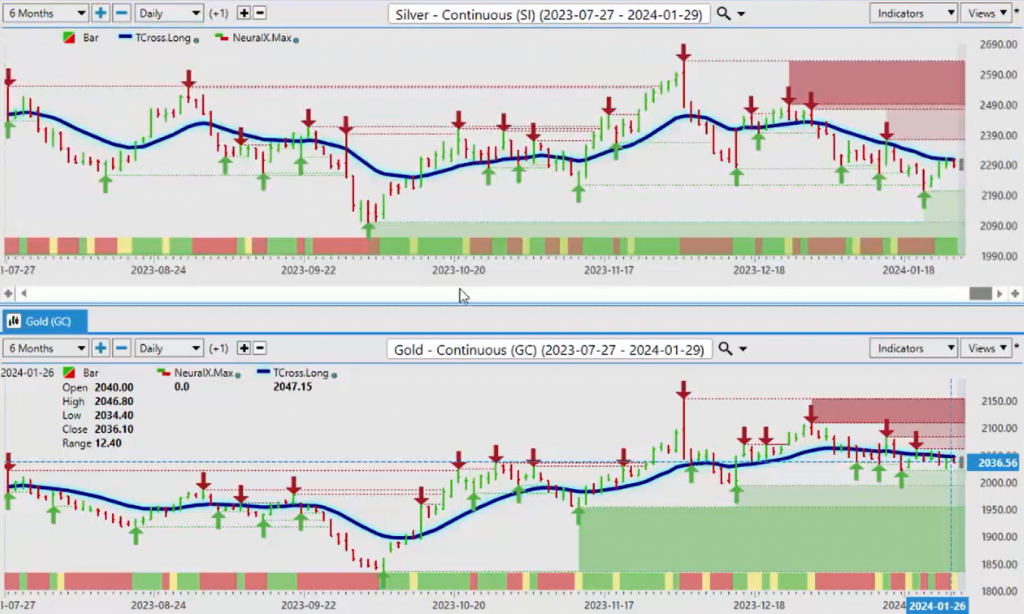
Silver, we can see that silver is struggling, but it too is pressuring the Vantage Point T cross long, trying to break out to the upside. And again, it’s going to be if the Fed suggests cuts are coming, then gold, silver, copper, platinum, uranium, they’re all likely to go up here, guys. So, the viewpoint of this week’s presentation is that you’re prepared for that and you can act accordingly once we get some idea what this incredibly confused Fed is going to do.
When we look at this right now in our software, again, these particular stocks down here, this is a very low-cost uranium energy stock, UEC. I’ve been watching this for some time and how it correlates. So, uranium has had a full corrective move lower, and now it’s at a make-or-break point. So, if we hold this level, what we’ll be looking for is gold to go up. So, if gold goes up next week, here, guys, I can kill multiple birds with one stone, metaphorically speaking, of course.
But if gold goes up, then this little stock at $7.37 looks pretty darn good because it’s going to follow it. And that’s the basis of what we do, right? The other one that’s again, CCO or CCJ from my American friends, the CCO is the Canadian version of this particular stock, but it’s the same deal here, guys. If gold turns back up, the probability uranium turns back up, all these metals turn back up, and that is precisely what we want to look for.
Euro versus Gold
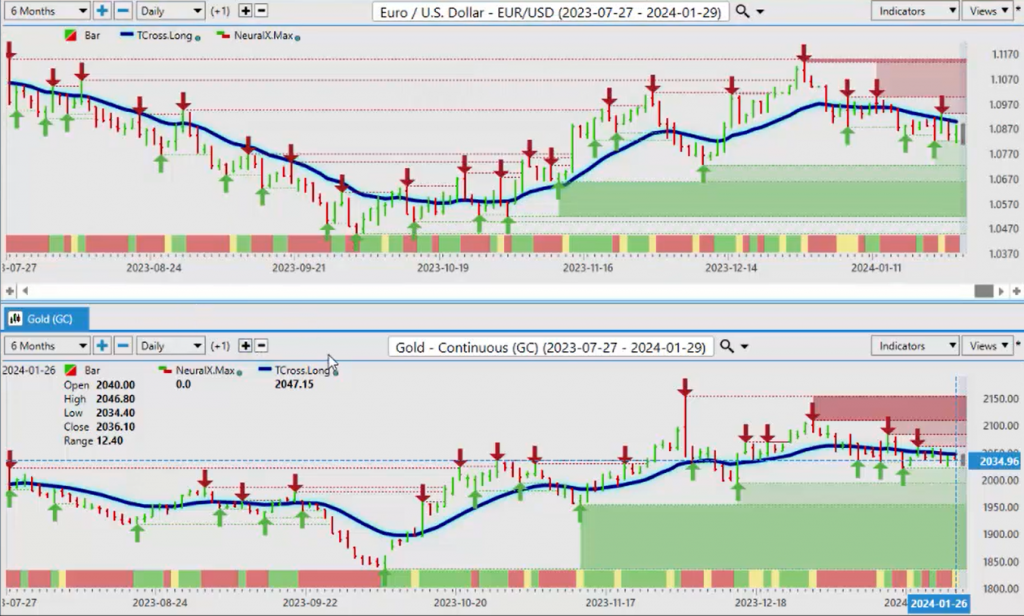
So, we’ve covered all of our equities, we’ve covered the bulk of our markets. But what I’ll point out here too, where I can show some of these other markets, we see that these currency markets, the Euro appears to have a very, very strong correlation to gold. So, if you’re a Forex trader and you’re watching this week’s weekly outlook, once again, yes, it is about the dollar index, but it’s also about metals and gold. So, I can do the entire presentation from the Forex side by visually looking at a gold chart to identify if gold moves up, what will follow with that. Well, it would be clearly the Euro. And they’re both sitting here pressuring that T cross long. So again, we’re data-dependent. I hate to use that verbiage to copy the Fed, but we are data-dependent next week.
This is a fundamental event with the payroll number, but more specifically, the Fed.
British Pound/Us Dollar versus Gold
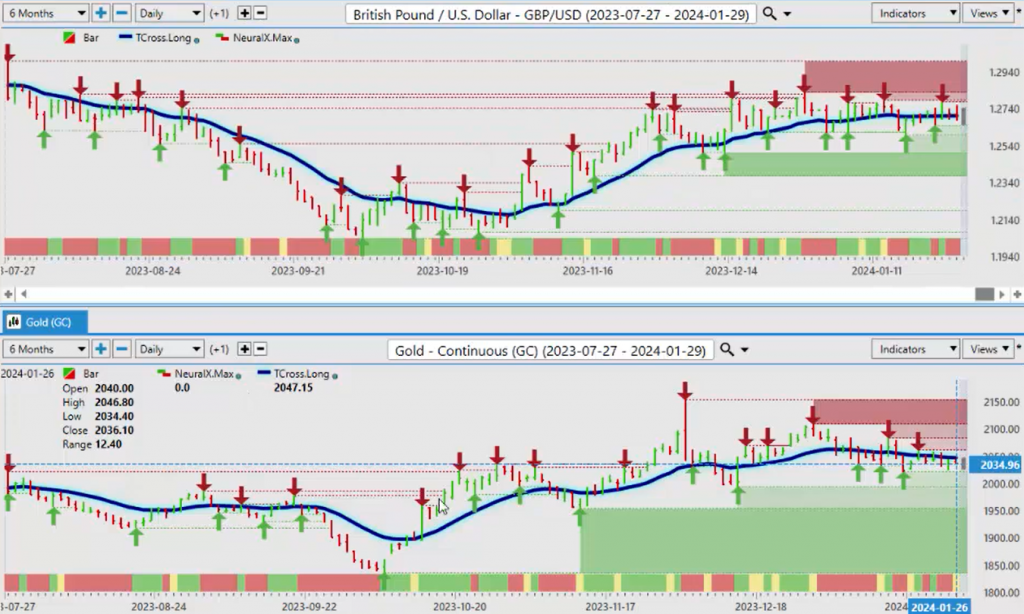
So, what about the Pound/Dollar? Is there a correlation there to gold? Well, of course, there is, a very, very strong correlation.
Australian Dollar versus U.S. Dollar
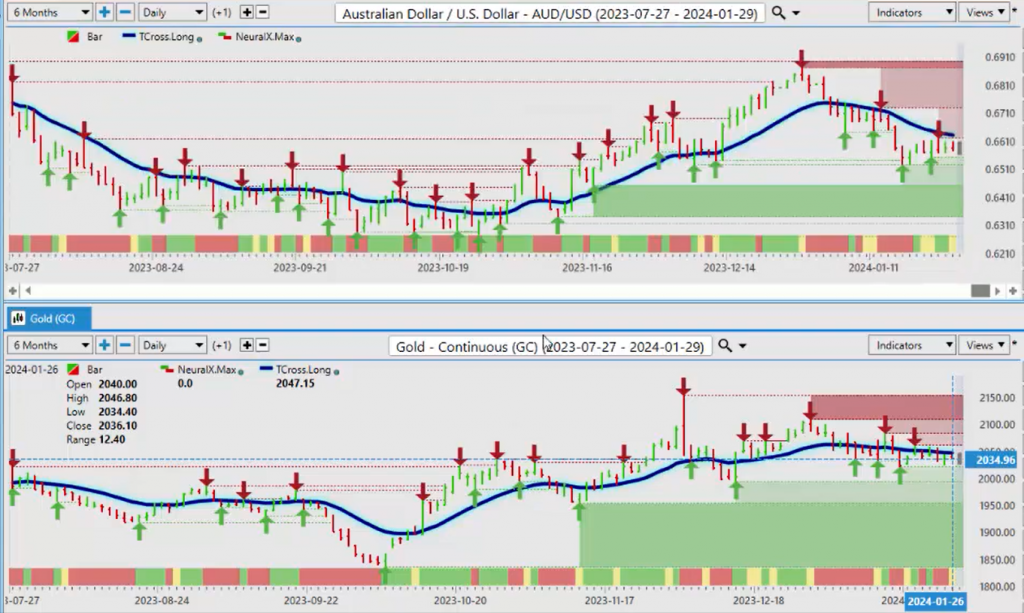
Actually, if we look at the Aussie Dollar, we can see that there’s a correlation, maybe not quite as strong.
Australian Dollar versus Gold

The Aussie is clearly showing its weakness here, but could it move higher also? The answer is yes, of course, it could. The Kiwi and gold, these two charts, my friends, are almost identical. So again, there’s a lot riding on what happens with the dollar, what happens with gold, and what happens with equities, and they will drive all of these markets.
Japanese Yen versus Gold
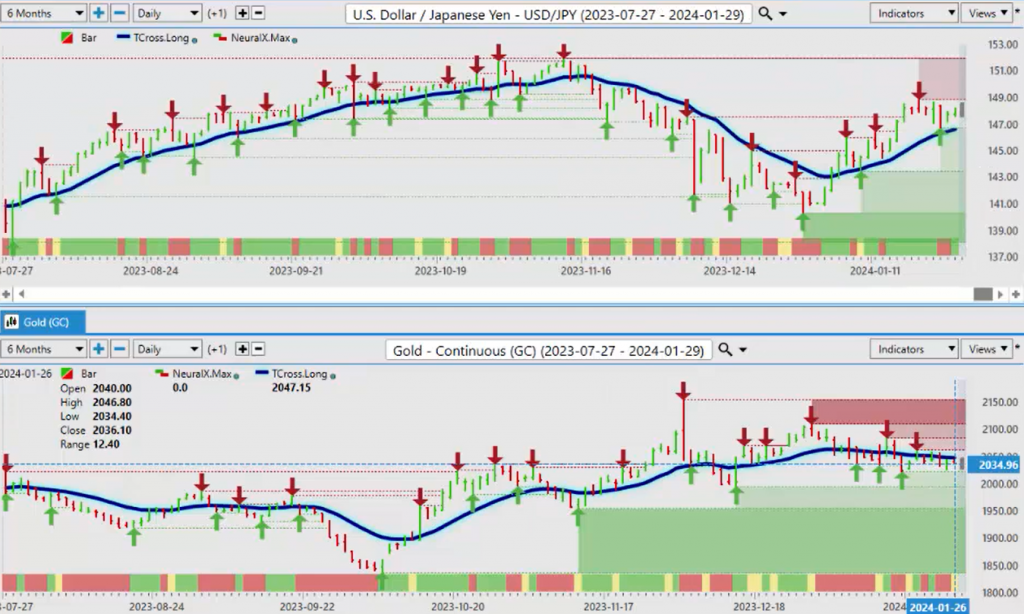
When I look at the US-Japan, if gold spikes, then in my respectful opinion, that is going to send this pair lower because, as we can see by this chart, one goes down, one goes up. So yes, I could throw 50 indicators on here, but the primary basis of this week’s presentation, going into a fundamental event like the Fed and the payroll number, is we want to dig a little bit deeper here and say, well, we’ve got multiple different things that we can trade here. We just need to understand what is going to be the catalyst for that, and in my respectful opinion, that will be the dollar, gold, oil maybe, but definitely the equity markets in the S&P 500.
Swiss Franc versus Gold

The US Swiss Franc, if gold does push higher and it breaks through the Vantage Point T cross long, then the US Swiss Franc would also go lower. We can see a clear inverse correlation between these two pairs. Or, excuse me, between gold and the US Swiss Franc, one up, one down. Again, if gold breaks higher, that pushes the dollar down and strengthens the Swiss Franc.
Canadian Dollar versus Gold
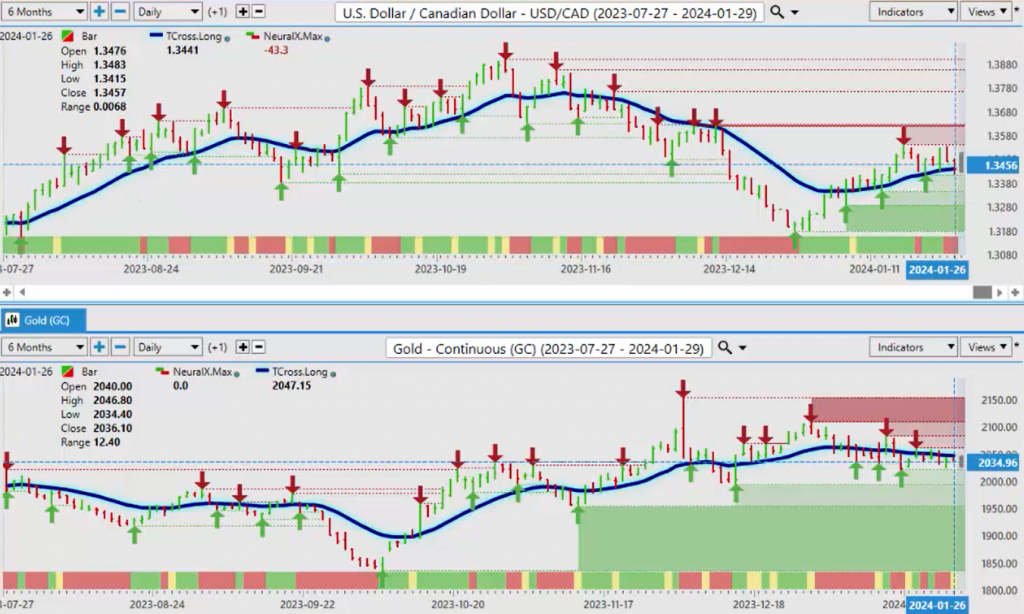
The US Canadian pair, we’ve got a basically an inverse correlation because the base currency on this pair is the Canadian dollar or is the US dollar. So if gold goes up, this pair also would likely move lower.
These are exactly the things that we need to know and understand to be able to trade these particular markets that inner-market correlations drive, not just one market, but but multiple markets. So, if I look at this, we can see, and there’s very little reason this past week the Canadian dollar should have strengthened, other than maybe higher oil prices, right? But this is something we want to look at. So again, this can be done in many different ways, but we’ve covered a lot of different markets very, very quickly by understanding what these correlations are.
So again, from a final standpoint, we can then break it down for the Forex market and say, ‘Okay, here’s our main Forex Pairs,’ and we look at the dollar, right? So, the dollar. If the dollar Index is going down, then the vix is going up. And I’ll be relatively brief here with this because we’ve mainly covered this. But the dollar Index, here, coming up on here, 10276, we need to be just mindful of this, right? That, uh, that this is, there is something going on here. Uh, I think I’ve got a little bit of an issue with that particular chart there. Let me just go over here and have a quick look at that and see what I have here. Uh, no, 129. So, to 129. So right now, we can see that, in my view, we can, we can definitely assess here over the last 6 months a very strong positive correlation between oil and the dollar Index. And this is why I have no idea why the industry was pushing everybody into the energy sector in the fourth quarter last year because it didn’t make sense because of this positive correlation. So this allows us to get out in front of these moves, right, and not get caught up in, in misinformation, diff disinformation from the media. So, if oil keeps moving higher, then the dollar is likely to follow. There’s a known seasonal pattern in February that they think is a seasonality in oil. But I would argue it’s a seasonality in the dollar Index between February and March, both around the mid-Month of both, but we also have the dollar cycle at the beginning of the month. So again, when we run through these pairs, like the US Swiss Franc, we can see that the dollar Index is going to determine what happens with this pair, same as the US Canada. It’s just, again, these two charts are literally identical. And just for fun, this is one of the ones I always talked about over the years, is keep a close eye on Magna International. If the dollar tanks, I can tell you to a degree of about 92% that this stock is going to go up because there is about a 96% inverse correlation between Magna stock MGA stock and the dollar Index, one up, one down, right? All of these pairs, if the base currency is not the US dollar, you’re going to have a strong inverse correlation. We can see that between the British pound and the dollar Index, the euro in the dollar Index, New Zealand, us. So, if that dollar does not go higher, we have multiple, multiple other markets to trade here, and that is by definition intermarket technical analysis. So with that said, this is the Vantage Point AI Market Outlook for the week of January 29th, 2024.


