




Welcome to the Artificial Intelligence Outlook for Forex trading.
VIDEO TRANSCRIPT
VantagePoint A.I. Market Outlook
US Dollar (USDU)
Okay, hello everyone, and welcome back.
My name is Greg Ferman, and this is the VantagePoint AI Market Outlook for the week of July 20th, 2026.
Now, to get started this week, we’ll begin where we always do, with analysis around the U.S. dollar. Now, in this particular presentation, I am again using the U.S. Dollar Bull Fund, the USDU ETF. I believe this one has very accurately called the dollar in general over the last several months, or for the better part of the calendar year, without the volatility of the futures market.
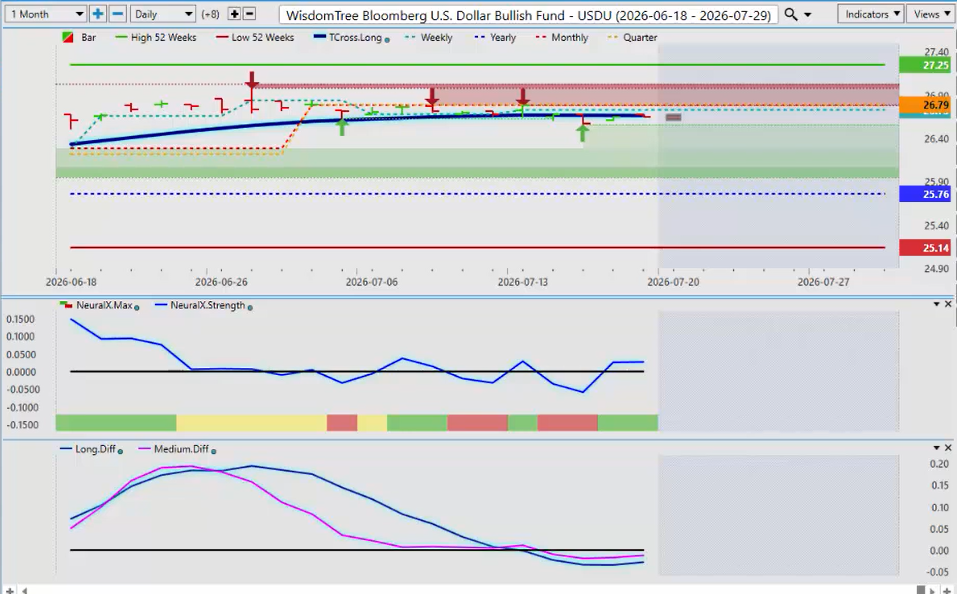
So right now, the primary trend is still up while we’re above 25.76, but you can see that we’re losing ground against the T-Cross Long. So, for next week, the key level here, looking at that T-Cross Long, is 26.67. If we can stay below that for the next several days, the dollar should come under pressure going into month-end.
But when we look at the primary indicators, we can see that the MA Diff Cross, we have a medium- and a long-term crossover, but they’re starting to slope upwards. But they are both below the zero line. Our Neural Index and the Neural Index Strength are still up, but you can see that we’re flatlining here. So, we want to watch that Neural Index Strength to see if it can push down.
Gold
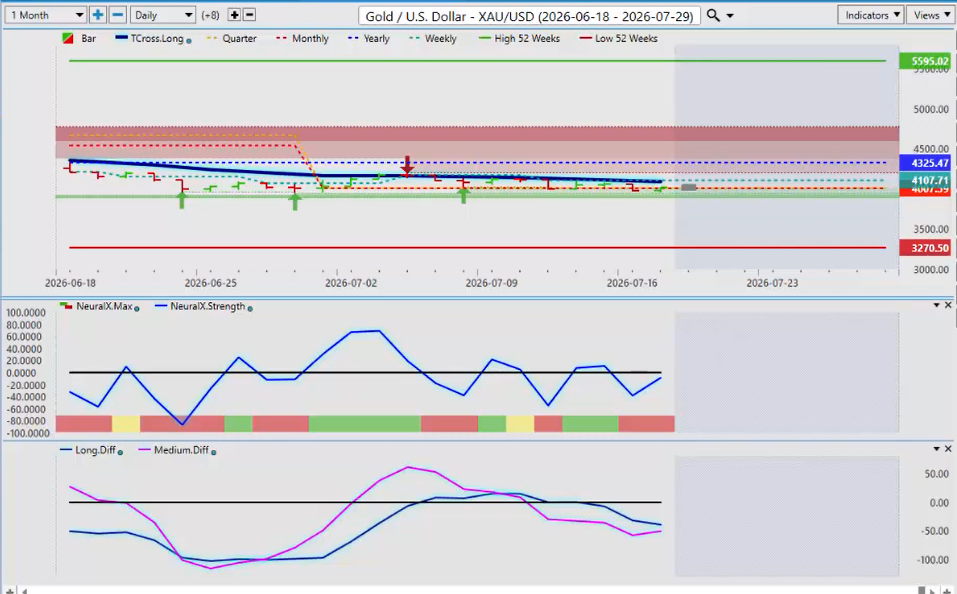
Now, with that, we’re looking to see if there’s any kind of bullish momentum building in gold. Now, it’s not there just yet. We are down near the 52-week low, 3270, but the T-Cross Long, again, 4,8740.
We need to clear that. So, ultimately, we can get back up above 4325. Now, that’s unlikely to happen in the next week, but it’s possible. But it would take a more catastrophic event or a risk-off event to get it moving.
But we know where the key level is. So, for the gold buyers, a buy stop above 4088 is a reasonable play. If we clear the T-Cross Long, then maybe we can extend higher.
But as you can see, for the last several weeks, gold has been contained by this single predicted moving average, making it a powerful resistance point. That’s good for both sellers, but also, believe it or not, it’s good for buyers because, again, we can put a buy stop. Myself, currently, I have a buy stop sitting above 4325.
Once I’m done with the downside and I get back up above the calendar yearly opening, my longs, I know, will work well into year-end. But I think we’re at least a month or two away from actually getting that kind of momentum.
Global DAX Futures
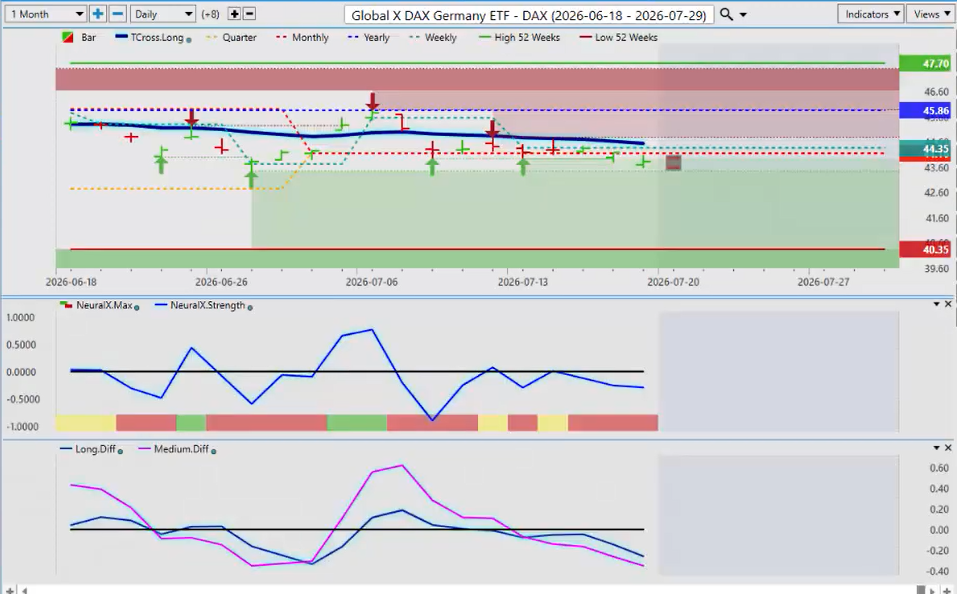
Now, looking directly at the equity markets, the Global DAX Futures here, you can see right now, following the euro lower, we broke down below the yearly opening price after a test of the yearly opening price at the beginning of the month.
So again, when we look at that, you can see that we’ve been struggling this entire time. We’ve come back up several times, only to go down.
So right now, for next week, our key-level pivot area is 4453. Bears would target selling into that area. Bulls would target above 4553, again giving something to both the bulls and the bears because, again, it’s not just about buying and selling, guys, because there can be opportunity on both sides of that.
So again, for now, we need to get back up above the monthly opening or the quarterly opening price and then retake the T-Cross Long if we have the opportunity to retest that 4586 area. But for now, the indicators in VP remain net negative.
Bitcoin
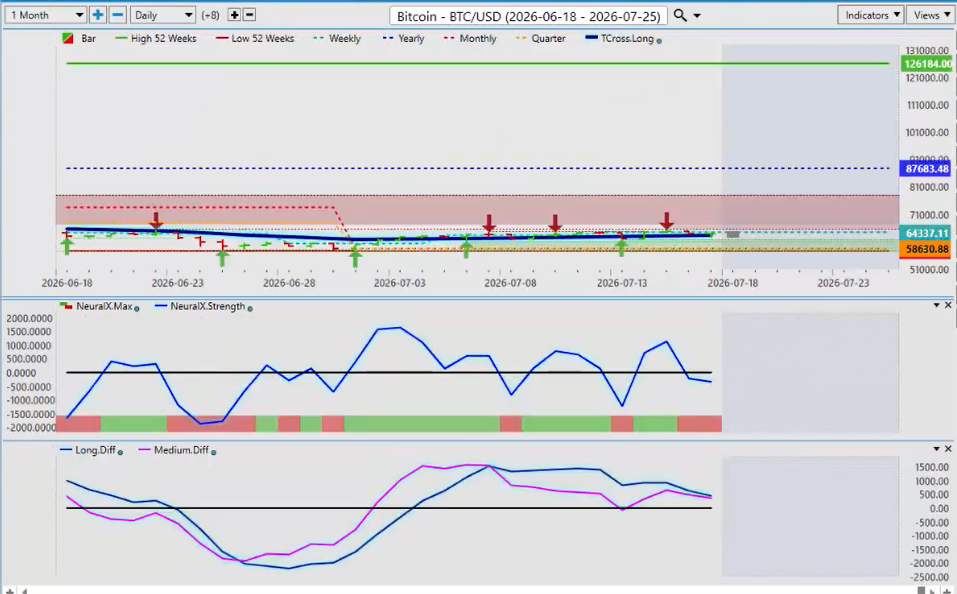
Now, looking at Bitcoin going into next week, we’re holding above the quarterly opening price and the T-Cross Long, 63,381. That is a key level. 58,630, an even bigger level that we need to hold above.
I believe, as I’ve said many times, Bitcoin’s going higher either way into the end of the year and next year. But for now, still some downside pressure, but it is looking a little bit better.
But we need to hold above these two key levels. And for now, I would prefer we stay above 63,381 if we have any chance of moving higher.
U.S. Equity Markets – SPY
Now, an overall look at the U.S. equity markets, a bit of a down day. Closing a little bit stronger, but a down day either way on Friday on the SPY.
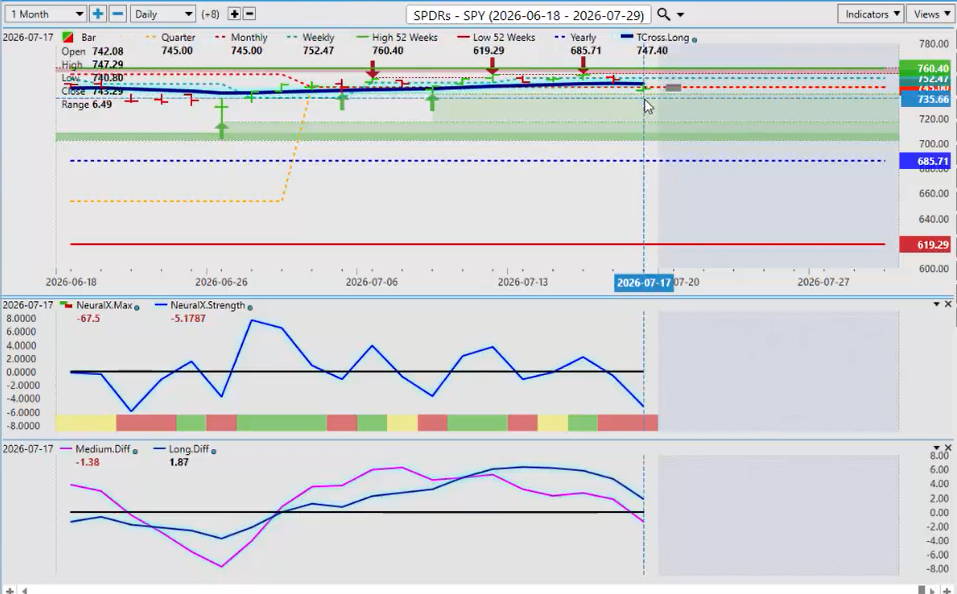
Right now, our T-Cross Long there is coming in at 74740. The question is, can we retake this next week?
We do have a medium-term crossover to the downside, and we are technically below the T-Cross Long. But what I prefer is two days, two consecutive days in a row, and then I would consider selling on the third day because we need confirmation. That’s only one crossover. The long-term crossover is still to the upside.
Now, the Neural Index is pointing down. But always remember how to identify that primary trend. 68571, we’re positive on the year. When you look back at this over the last six months, you can see that we only spent a few weeks below the yearly opening price. Then we immediately retook that yearly opening at 68571.
So again, another choppy week likely ahead with everything that’s going on with the U.S. and Iran. But if we can get back up above that T-Cross Long, we should be able to extend higher.
British Pound/U.S. Dollar
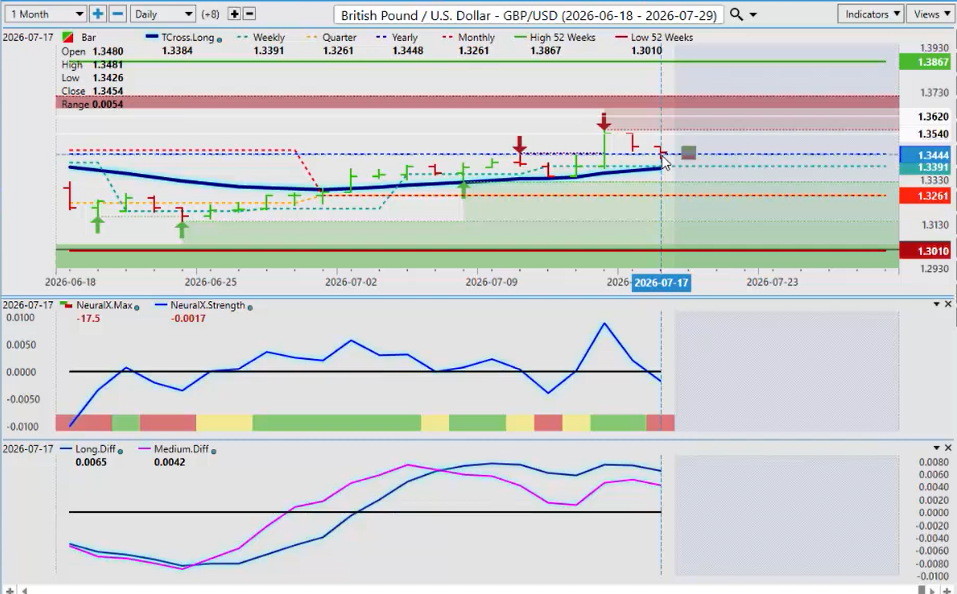
Now, looking at some of the main forex pairs, the British pound/U.S. dollar, again bringing in static points like the monthly, the quarterly, and the yearly opening. They help us determine what the actual trend is. We can’t really say something’s bearish on the year when it’s been positive during that period.
Now, the British pound has only been above the yearly opening price this month for three days, and we finished right on it on Friday. That is not exactly bullish, in my respectful opinion.
But if we can hold above that yearly at 13448, we can extend higher. But if we can’t, then the first downside target is the T-Cross Long, 133.84. Then the quarterly opening price at 13261.
Now, our short-term indicators with the Neural Index, they are pointing down, suggesting that the first move next week would be to the downside.
Aussie/U.S. Dollar
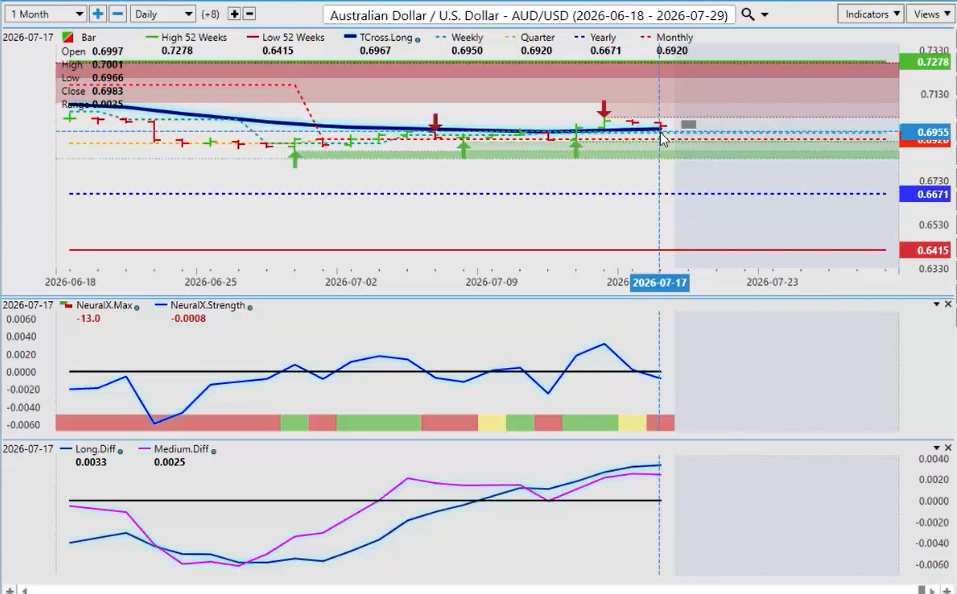
Now, the Aussie/U.S. pair, very, very high correlation to the S&P 500. And we can see we’re still holding above that important T-Cross Long, 6967.
If we can maintain momentum above here, it’s actually a positive for the U.S. equity markets, believe it or not, based on intermarket correlations directly. The Aussie is highly correlated to the global equity market.
So, there’s still hope for stocks right now, again, unless we break down below that important quarterly opening.
Euro/U.S. Dollar
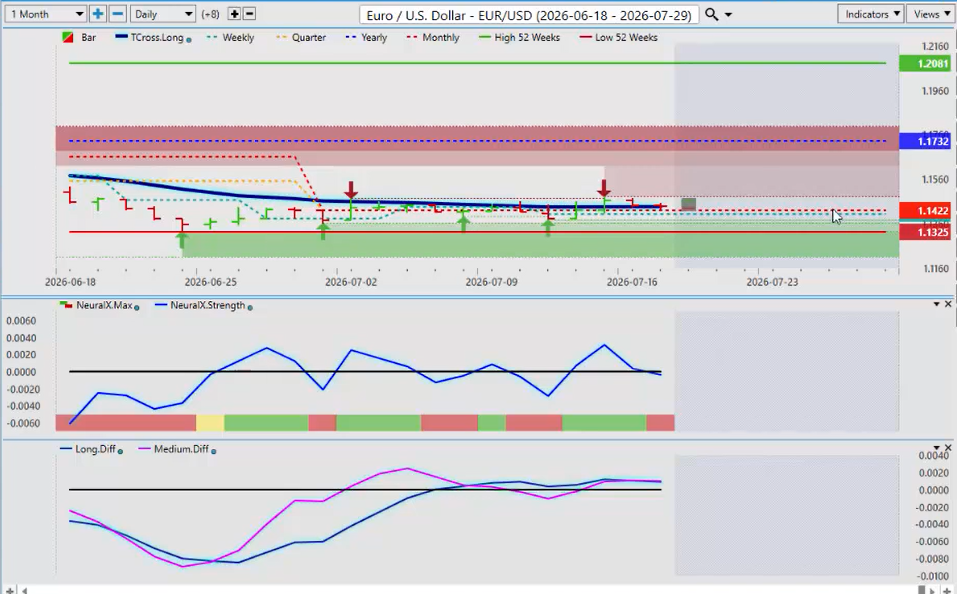
Now, in most cases, the Aussie/U.S. and the Euro/U.S. usually run about the same. They’re both trading against the U.S. dollar, but clearly the euro is the weaker currency here.
So right now, our key level, we’ve closed the week at 11437. The T-Cross Long, we’re closing 11439. Very, very slightly bullish, guys.
But we’ve just set a new 52-week low in the month of June, June 24th to be specific. So again, we’ve been rising since then. But I don’t know if we’re going to have enough momentum to push higher.
But if it’s going to push higher, next week would likely be the time when it does it because we know the U.S. dollar strength is stronger at the start of the beginning of the new month into month-end.
U.S. Dollar/Japanese Yen
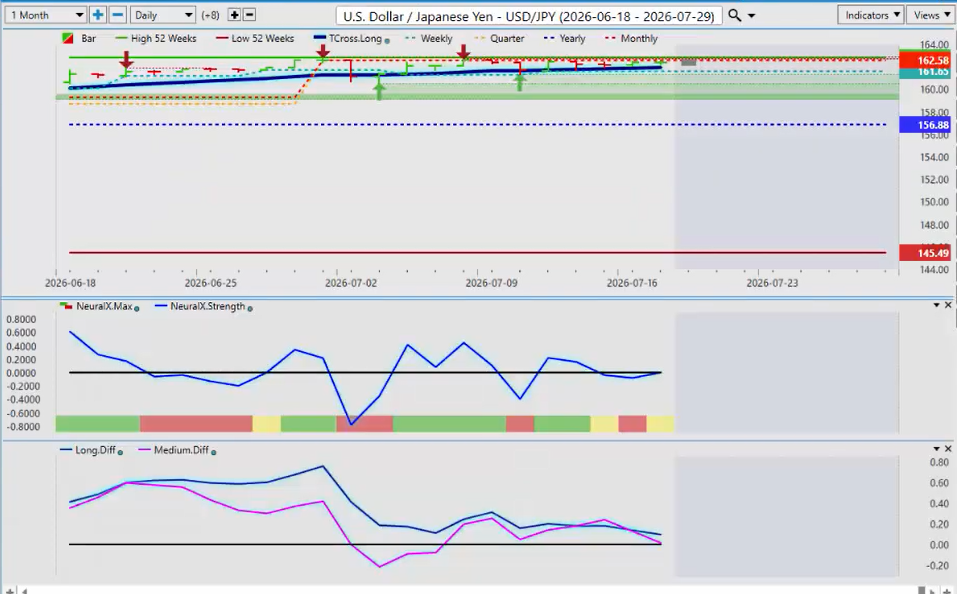
Now, the dollar/yen, again, hard to believe this thing is closing again at 16240. The Bank of Japan cannot be happy with this. But right now, the carry trade is still on, guys.
But the one thing I’ll warn everybody is we do have an MA Diff Cross that is occurring right now, but above the zero line and above the T-Cross Long. That’s telling me we’re going to correct lower to 16194.
If that holds, then it is possible we can make a new 52-week high yet again this coming week. But again, watch that T-Cross Long level at the 16194 area very closely.
Barclays – ($BCS)
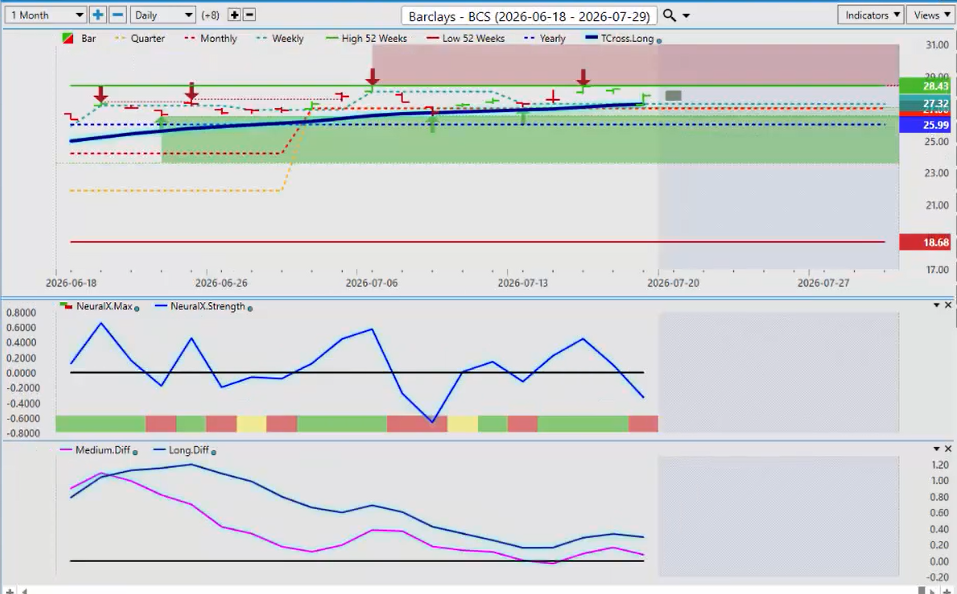
Now, throwing in a couple of stocks and ETFs into the mix, into the weekly outlook, to change things up, I think is reasonable.
So, BCS, Barclays, had a pretty nice run there last week for about three days. So again, you can see that, once again, right from the beginning of the week, we go up and make another 52-week high. Nice little move in the first three days of 3.38%.
Now we’ve come back and hit the T-Cross Long, and again, you can see that the medium-term crossover, and again, this is a good educational video. We’re still above the yearly opening price, and we’re still above the T-Cross Long.
So, the medium-term crossover to the downside, again, that would only be validated if it crossed below the T-Cross Long. The market must move below that T-Cross Long.
And I’m just simply demonstrating what a powerful pivot level this actually is. So, we’ve taken a rise higher, made another 52-week high. We’ve come back, hit the T-Cross again to the number, and I believe we have another long trade again for next week.
And I believe it’s very possible that we could make another new high. I don’t think it’s going to be excessive, but there’s still a play there either way.
Invesco BuyBack Achievers ETF – ($PKW)
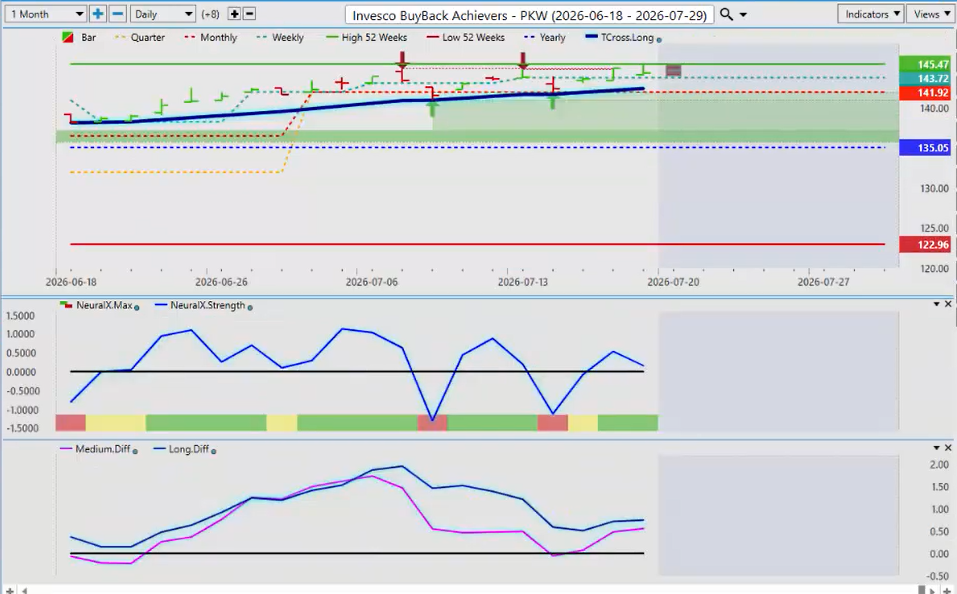
Now, the other one we’re going to look at is PKW, Invesco BuyBack Achievers.
Now, this one here, again, it’s pushing higher. We’ve come down, had a corrective move to the T-Cross Long, and now we’re looking for an extended move to the upside.
So right now, after that corrective move, we’ve been rising, and I believe we can extend a little bit further on this one. So, for now, longs remain in play while above 14242.
The T-Cross Long is intersecting with the quarterly and monthly opening price. The primary trend is up at 13505.
So, everything looks pretty decent here, but it would be an aggressive play to buy here. I would prefer to pick it up lower near that very important T-Cross Long level of 14242.
H&R REIT ($HRUFF)
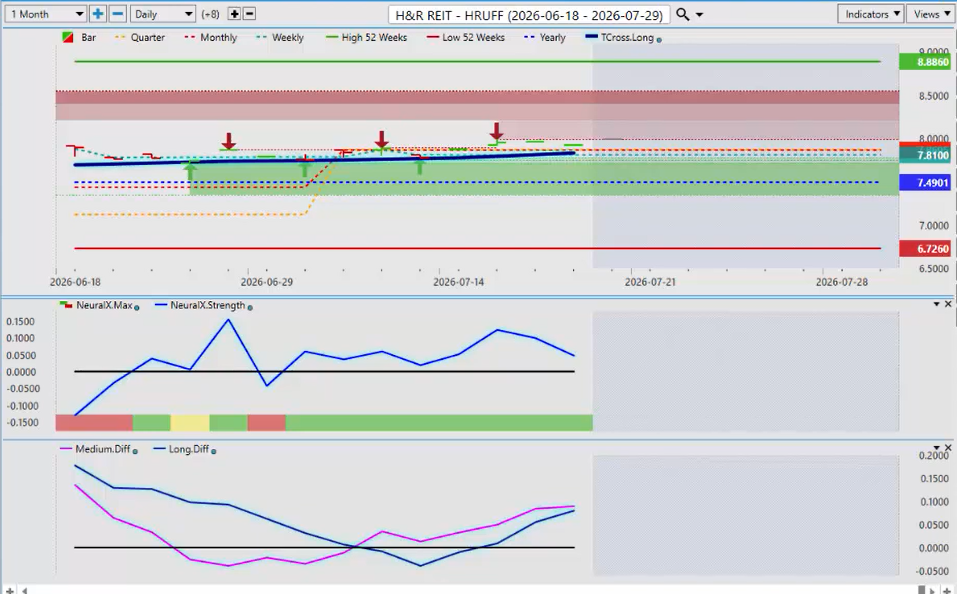
Now, on the ETF side, we’re going to look at, and the stock side, H&R REIT we’re going to look at here.
Now, once again, we’re above the yearly opening price, $7.49. And again, I like to show value shares, not just $300 shares. This one is value-based.
So again, we’re very close to the yearly opening price of 7.49. I like that we’re above the T-Cross Long, 7.83. This looks pretty good, and a potential price target of 8.88, the 52-week high.
So once again, the indicators in VP are moderately bullish on the predicted differences. We’ve got a medium-term and a long-term crossover to the upside.
A little bit concerning there that the Neural Index Strength is pointing down, but the primary Neural Index is still up. And again, the area for longs there would be 7.83 or potentially right off the opening.
But again, a slower mover, but I think we can move up potentially over a dollar a share before the month-end.
So, with that said, this is the VantagePoint AI Market Outlook for the week of July 20th.