


Welcome to the Artificial Intelligence Outlook for Forex trading.
VIDEO TRANSCRIPT
WisdomTree Bloomberg U.S. Dollar Bullish Fund ($USDU)
Okay, hello everyone, and welcome back. My name is Greg Firman, and this is the Vantage Point AI market outlook for the week of October the 6th, 2025.
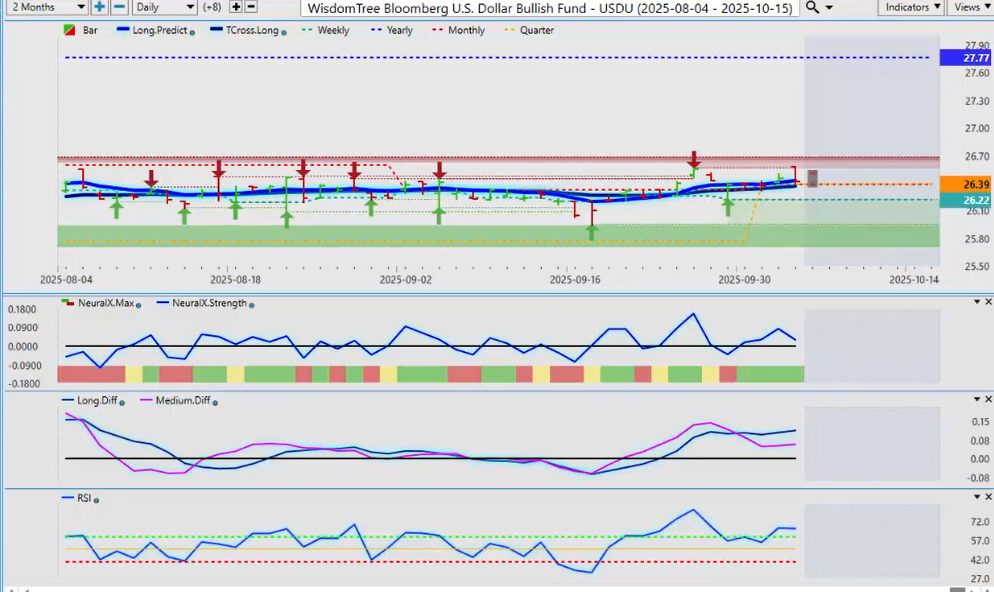
Now, to get started this week, where we’ll begin where we always do—with a very important US dollar index. Now, for this particular presentation, like many others, I am using the USDU, the wisdom tree Bloomberg US dollar bull fund. Now, we’ve had a corrective move back down to our T-cross long multiple days in a row, and now price is starting to rise. However, we do have the government, uh, shutdown in the US. We’ve got the Fed minutes coming up. A lot of factors, but you always must make sure, whenever you’re using, uh, any type of technical analysis, it should be done with fundamental analysis, meaning the announcements that are coming out. So, the government shutdown—kind of a big deal. Uh, seen it before. I don’t think it’s anything major at this point yet. Uh, the Fed is a bigger concern.
So, when we look at this right now, once again, we are holding above the Vantage Point T-cross long. We’re positive on the month. The seasonal pattern on the dollar is mixed, but for now, uh, the dollar is holding on to gains, surprisingly, but we’ll see how this plays out next week.
iShares $IEF (7–10-year Treasury bonds)
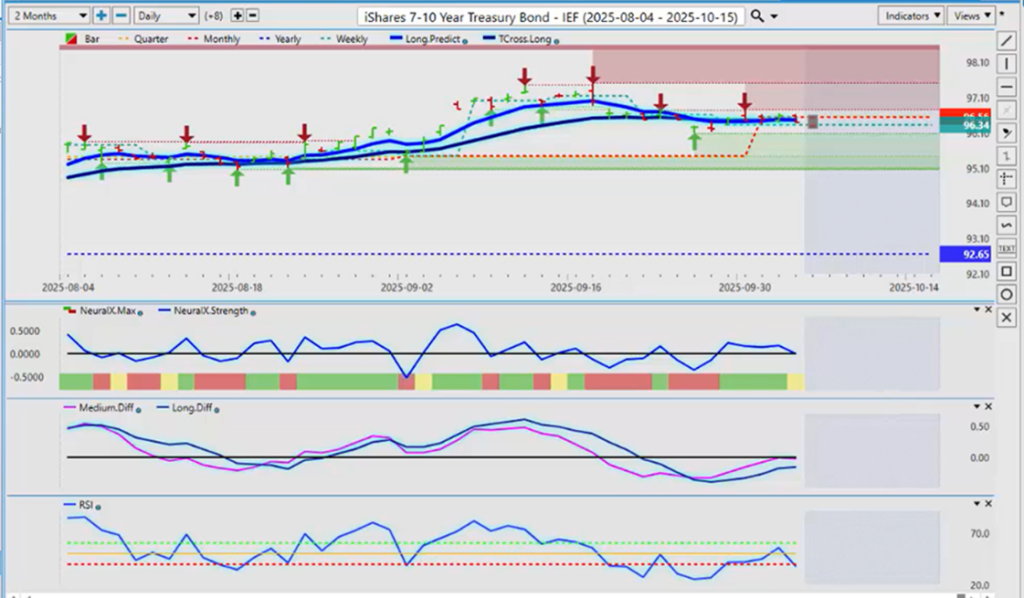
Now, I was asked about, uh, why I don’t do treasury bonds. Uh, one thing I will state here, guys, uh, is that there is a very strong inverse correlation. Uh, I’m using here the IEF 7–10-year Treasury bonds. Basically, if the dollar is going up, this is going down. What I can share with you, after having a quick look at it, is there is a substantially substantial seasonal pattern with this, where it usually goes lower, uh, and the seasonal pattern is very strong, over the la—particularly over the last 5 to 7 years, that, uh, approximately 89% of the time, this, uh, this ETF goes lower; and again, that’s the seven and 10-year treasury bond.
So, I can have a quick look at that for you. Uh, that’s not a problem from week to week. But you are—I am—indirectly showing it by showing the dollar index. Again, if it’s going up, this is going down. So, whichever way this plays out next week, uh, and you’re trading the, the seven and 10-year Treasury bonds, you want to keep an eye on that dollar index very closely, because if it goes lower, this will rise. Right now, we are negative on the month. You can see the dollar is positive on the month. Uh, the IEF is negative on the month. The signal here is somewhat, uh, mixed, but I would argue momentum is building on this already. 38.4 on the predicted RSI suggests, actually, indirectly, that the dollar is going to rise, and this is going to go lower. So, just a quick little side note this week from, uh, week to week. I can definitely look at that for you. Uh, but I am not a bond trader, just to be, uh, just to be clear there.
$XAUSD / Gold
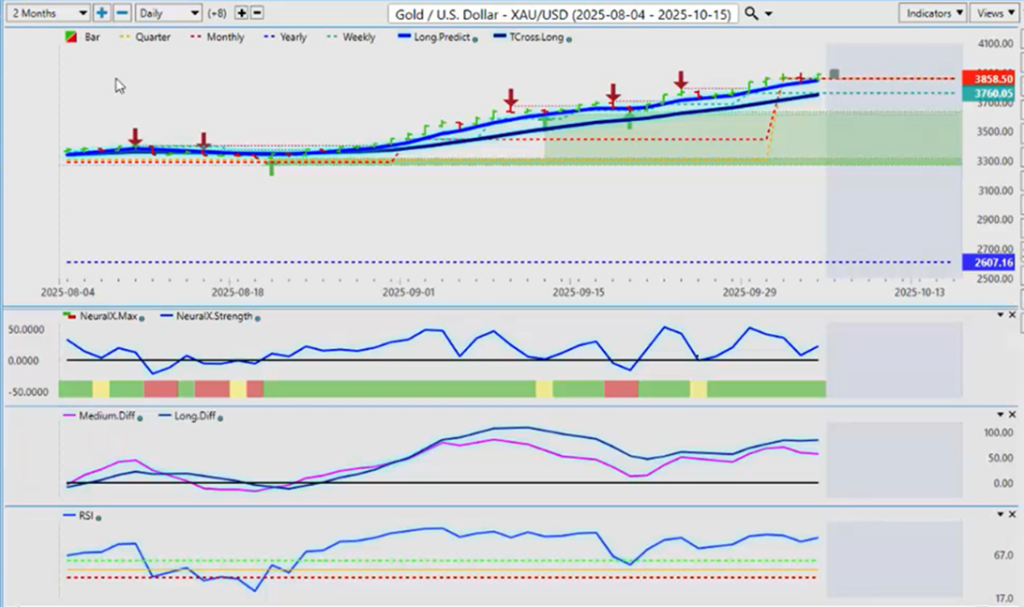
So, when we look at additional markets going here, XAUSD or the gold contracts—gold clinging to the monthly opening price—and, again, I think it’s going to be very difficult for gold to make a big move here. It’s going to need help from the Fed, but the indicators in VP are still showing a directional bias of up. And, and once again, uh, this is a weekly outlook, guys. We don’t go backwards and look at an outlook from a week ago or two weeks ago and apply the analysis to this week. Again, it’s a weekly outlook that’s updated each week. We’re looking forward, not in the rearview mirror. Okay? So, if you have questions about this specific, uh, presentation, absolutely type them into the queue.
But for now, our T-cross long—gold is still long while above 3748. The area you want to watch this coming week is 3845. Can we hold above that particular level? So, right now, the VP indicators say yes, we can. But, again, there is that strong seasonal pattern in both the dollar and, indirectly, in the 7 and 10-year Treasury bonds that, uh, you want to keep an eye on for sure.
SPDR $SPY (equities)
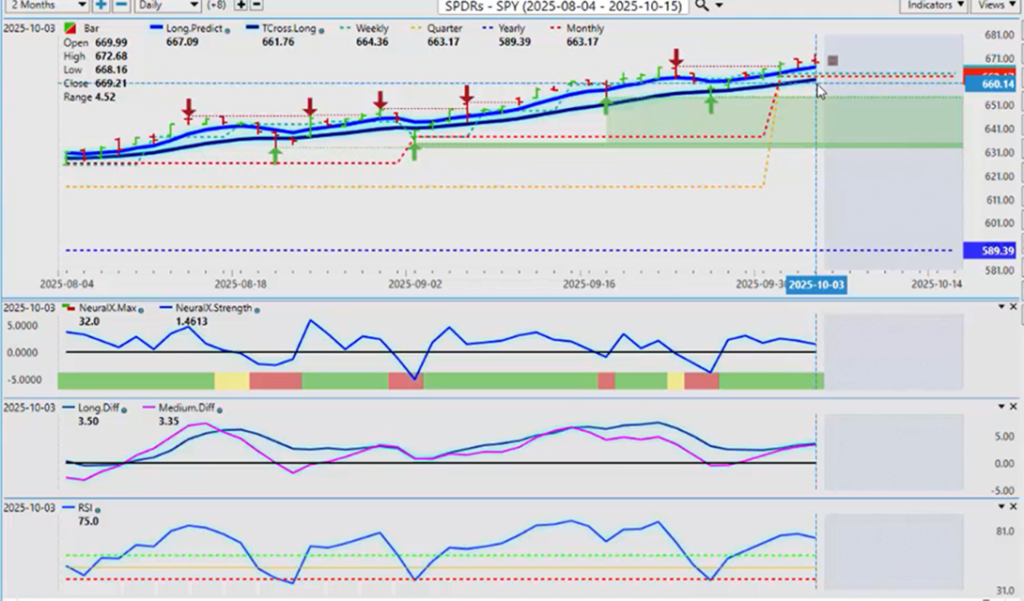
When we look at the equity markets for next week, again, the spies—right now, the spies continue to make all-time new highs. I’m not really sure how much longer this can go on for. There is enough risk-off in the market that should have sent this lower ages ago. But, again, uh, we can’t tell the market what to do here. We’ve got to, you know, follow the buyers and sellers, the bulls and the bears, and where they’re conflicted, and then manipulate that. But for now, uh, the, the T-cross long coming in at 66176. The monthly opening price is right there also. Uh, I would only remain long this coming week if we can hold above those two predicted, uh, those two projected levels.
The MA diff cross here is looking good, but I don’t have a completed crossover, meaning the pink line over that blue line, telling me that that medium-term strength is still there. The predicted RSI still looks quite good, but the slope of the neural index is a little bit concerning; as the market’s going higher, you can see that that, uh, predicted neural index strength is actually pointing down. So, a little bit of caution there, and, uh, right now the question is: can we hold above the current monthly opening.
Bitcoin
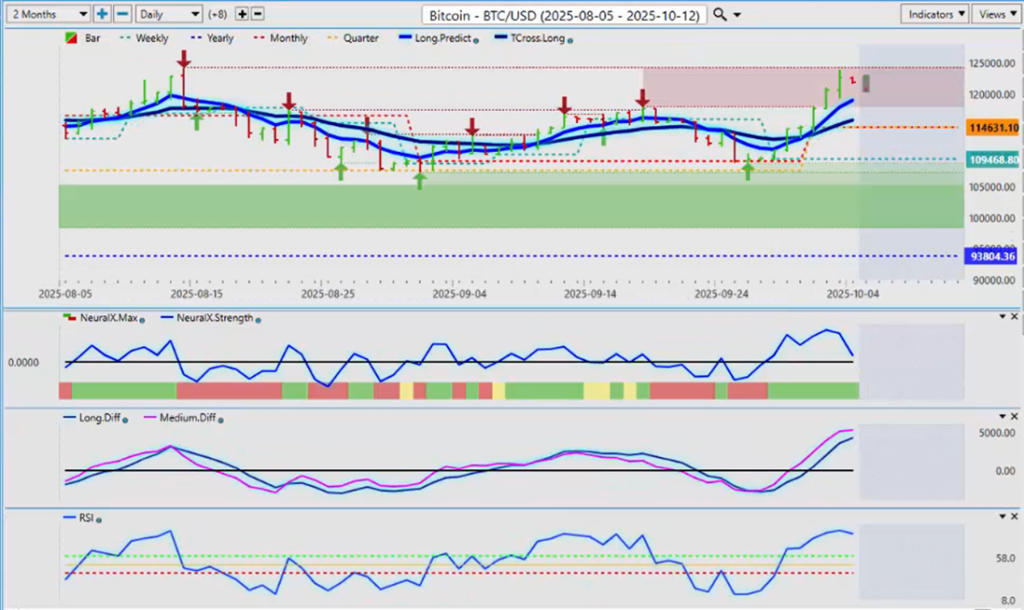
Now, when we look at Bitcoin once again, you’ve got to be very, very cautious as to what you listen to with this media. Uh, they were very, very negative on Bitcoin. I have been a strong advocate for months on here that October will be a good month for Bitcoin—a very strong month. So, you can see, right out of the gate, and I would argue very strongly that Vantage Point had predicted this move was coming—confirmed what this move was coming with that seasonal pattern that I’ve discussed in October. They flushed out all the stops, but they couldn’t push it below the monthly opening price in September. We’ve rebounded, uh, but, again, uh, the media now is very bullish on Bitcoin. They’re actually talking about how there’s a seasonal pattern in Bitcoin in October, but it’s, it’s funny that they never mentioned that prior to the move—only after the fact.
So, again, we have now made all-time new highs in the month of October. Any one of these outlooks can be checked to validate what I’ve been talking about on here for months: that Bitcoin, well, maybe next year is going to be a down year. We’re in the third year of a three-year cycle in Bitcoin. But, again, this move was predicted all the way back here at the end of September. We did this live in the Vantage Point training room. Uh, and again, a big push up. The question is now: is this it? Can we actually push higher here now? So, I believe we have already pushed higher, uh, with a new all-time high over here. But, again, uh, it is higher-risk longs up here. Uh, the only thing I’m seeing, a—that concerns me a little bit is that neural index strength is starting to point down. If I get an MA diff cross, then I would expect a corrective move, if nothing else, back to the T-cross long. That’s the one to keep your eye on with oil contracts.
USO / Oil / NATURAL Gas
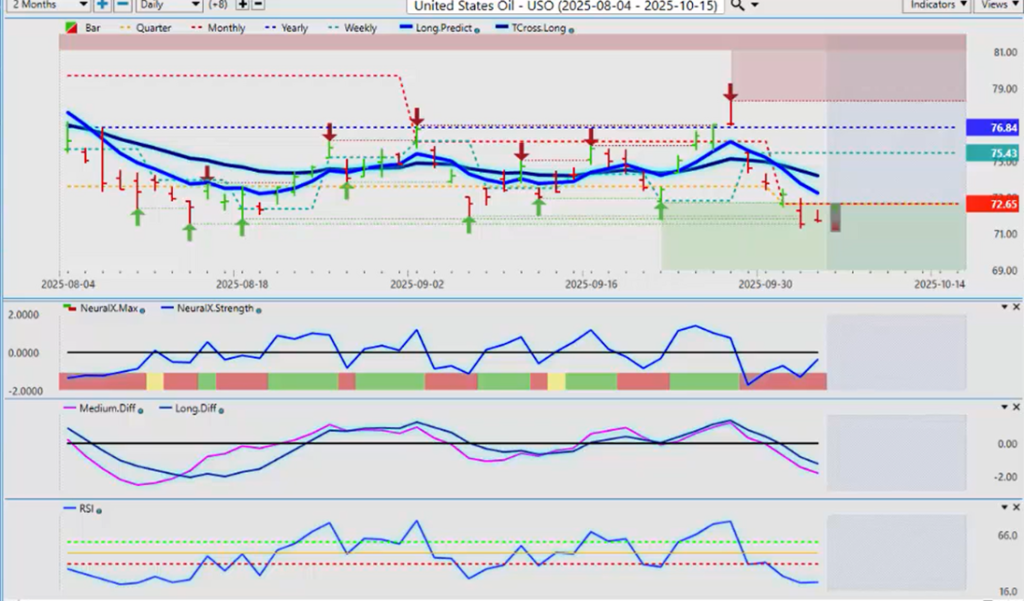
Once again, uh, not a very good seasonal play to be buying oil. It does look good value—like good value—down here, but again, we need a reason to buy it, not just because we think it’s oversold. So, what I would personally look for is: if I can get the predicted RSI rising and get it to, to move back over 50, then, and only then, would I consider longs. Usually, at this time of year, NAT gas is the play. Nat gas has made, uh, sub—several, uh, strong moves over the last couple of weeks, which was predicted ahead of time; but again, uh, yes, there may be a short-term, for day trading, longs here, but once again it would be a retracement back to the T-cross long, and that’s at 7418. But the main hurdle—oil USO needs to, to, to break—is that monthly opening price, which is 7265, if we any chance of getting back to that 7418 in the coming week.
DAX / S&P 500 / NASDAQ
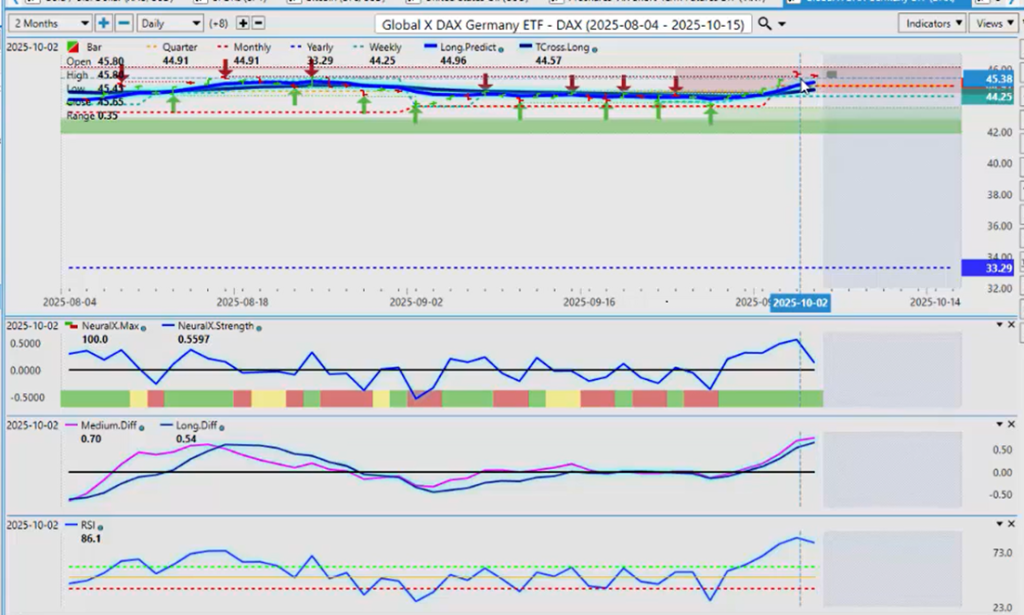
Now, when we look at the German, uh, equity markets once again, uh, the euro stabilizing is the best I can say here, but the global equity markets in general are doing quite well. So, the, the DAX looks pretty good here. We’re starting a new month. If we can, again, hold above the monthly opening price, $44.91, the T-cross long—that’s coming in at 4469. That’s where all your support is for next week. If we come back down, retrace back to that area—which I think we will, looking at that neural index strength—then, at that time, it would still be a buying opportunity.
But for my German friends, make sure you’re keeping an eye on the S&P 500, the NASDAQ, all of the, the US equity markets. If they’re stabilized and they’re doing okay, then the DAX should be fine also. But again, those are your key levels. Can we maintain positive momentum at these particular levels? I believe the DAX can, and actually may have a better shot of doing that than the US equity markets. Okay.
Euro versus U.S. Dollar
Now, again, what we’re going to do here is we’ll start in with some of our, our main forex pairs. Just a brief discussion here on the euro. There’s no reason to be concerned—or, excuse me, confused—about stop-losses and take profits, because none have been mentioned in any of these videos. Uh, one stop loss is not a one-size-fits-all here, guys. You’ve got day traders that will use the predicted high and predicted low; swing traders that will use the T-cross long and the other momentum indicators.
But back on the, the 22nd—back in September here—it was discussed that the euro is running out of steam. It’s been going lower ever since that webinar. But again, we’re not going backwards, uh, and reanalyzing stuff from two—something that was said 2 or 3 weeks ago. We’re looking at next week only. So, right now, the Euro US has an MA diff cross and is warning that we could have some upside strength here. Uh, I think that will be determined by the US, uh, government shutdown, the Fed minutes, and I believe we even have a Fed speak next week. So, there’s going to be a lot of fundamental information that you have to look at. But a stop-loss is account specific, and no recommendation is being made here to buy or sell currencies. This is for educational purposes only. And the main discussion is the directional biased, based on the Vantage Point indicators. The trader then is responsible to tip—to put in stop-losses, take profits, based on the size of their account. It’s not—again—it’s not a one-size-fits-all here, right?
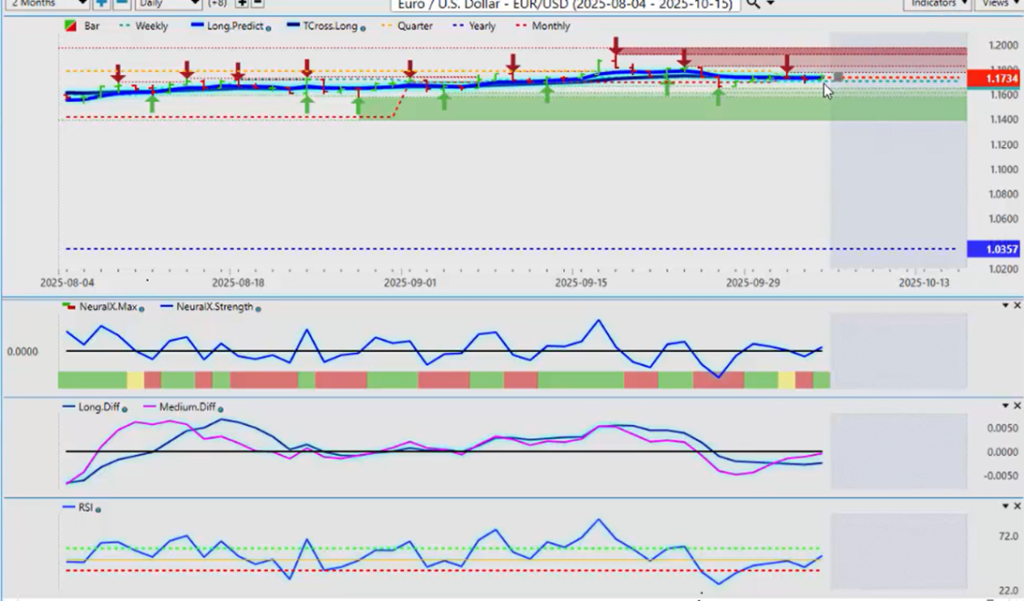
So, if we look at the indicators, we’ve got a little bit of momentum building here. We’ve got an MA diff cross. So, for next week, if the euro is going to go higher, we must clear and stay above 11731. Your targets on your upside are yours. And again, they are account specific. Uh, yes, there, there is a verified high here at 1179. There’s another verified zone at 11820, and a third potential target at 11919. So, those are three potential targets. One can be for a day trader, one can be for a position trader, and the other one can be for a longer-term trader. But again, it’s about, look, combining the indicators together and having a directional bias. Do I want to buy, or do I want to sell, this, this pair?
Respectfully, I think it will be very difficult for the euro to extend gains here, based on what I’ve already talked about with the dollar index and the inverse correlation to the seven and 10-year Treasury bonds—that there’s a very strong downward bias there. The inverse correlation to the dollar index rising—you’re, you guys, you’re actually looking at a euro, uh, a dollar index trade with eurous. Uh, again, this is a 99.99% inversely correlated to the dollar index. Meaning, if it goes up, this pair goes down. If the dollar index goes down, this pair goes up. So, hopefully that’s cleared up any confusion around what this outlook is every week. And no stop losses or take profits are mentioned, because, again, that is something that is account specific.
So, when we look at that for the euro, we, we look at this and say, okay, we’ve got a corrective move, but now we’re at a make-or-break area this coming week. Can we break through and stay above 11732?
Swiss Franc versus U.S. Dollar
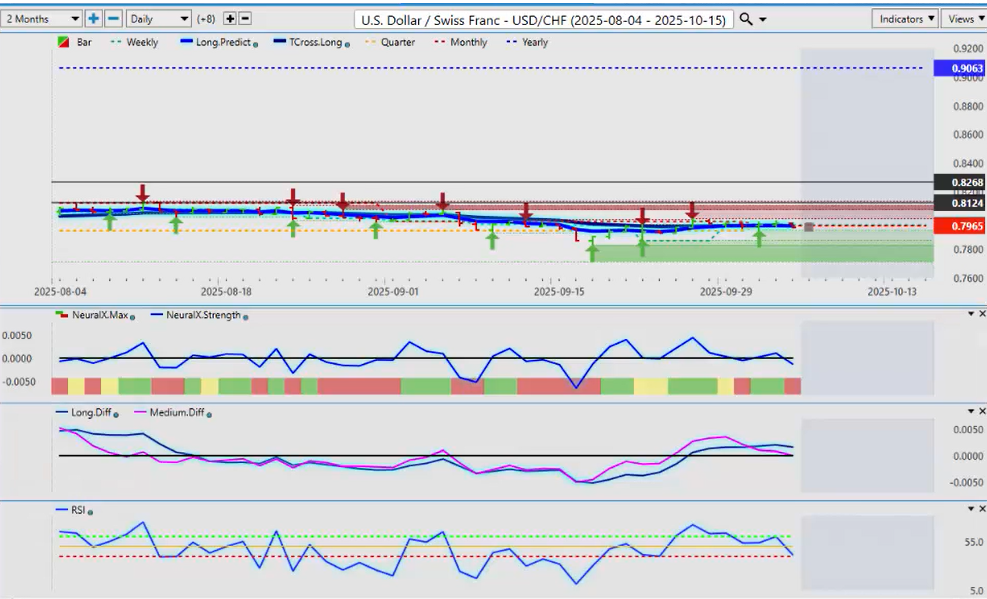
Now, the US Swiss Franc, once again, also a, uh, a US dollar. One thing that all these forex pairs have in common, guys, is they are all trading against the US dollar. We don’t want to overthink this or reinvent the wheel. It is that simple. If the dollar holds its ground, then it will put pressure on, on most of your forex pairs, other than maybe US Canada. So, when we look at US Swiss Franc, it mirrors the dollar index. It’s waiting for a confirmed break. And, in most cases, a fundamental announcement will cause that—meaning the Fed minutes this coming week; the Fed, uh, Fed speaking, I think, on Thursday or Friday; the US government shutdown—these are all fundamental drivers of currencies, equities, and commodities, right? So that’s what we have to watch right now.
Again, a warning sign—the MA diff cross is pointing to potentially dollar weakness. Uh, but again, the extent of that weakness will come based around what the Fed is planning on doing here. So, uh, once again, we need to get above that monthly opening price at $79.65, and the T-cross long is at the exact same level, which is 79.64. In most cases—not all—a government shutdown would be considered a risk-off scenario, sending equity markets lower and strengthening the Swiss Franc. That’s not happening. So, again, this is a new one. We’ll see how it plays out, but there is a slight directional bias to the downside.
British Pound versus U.S. Dollar
Now, the pound dollar had a brief—very, very brief—recovery on Wednesday last week. Once again, guys, this was a fundamental announcement for one of the Bank of England members that, that basically said, “Hey, I think we should hold.” Well, that’s one person’s opinion, and you can see that it caused a spike. The market reacted to it and then went right back to the primary trend, and stayed below and closed below the T-cross long. And when we look at that T-ROSS long level—13478—watch this level clearly next week. If we can get above it and stay above it, you have a long trade. You will then add your stop losses, your take profits. But again, that is on a, on a, on an account—on a per-account—basis, guys. One size in stop losses does not fit all.
And, and again, this is why Vantage Point has the predicted high and predicted low. That can be used with day trading, but a swing trader may not use that. He would focus more on the levels that I’m looking at, the T-ROS long. So, right now, we do have a medium-term crossover—this pink line crossing over the zero line. So, this should be interesting. We’ve got support at the predicted RSI—a 60/40 split. This suggests that the pound could break higher next week. The monthly opening price—134.445. Connect the dots. Make your decision. Enter your trade. That’s the way we would do it here, guys. Okay.
U.S. Dollar versus Japanese Yen

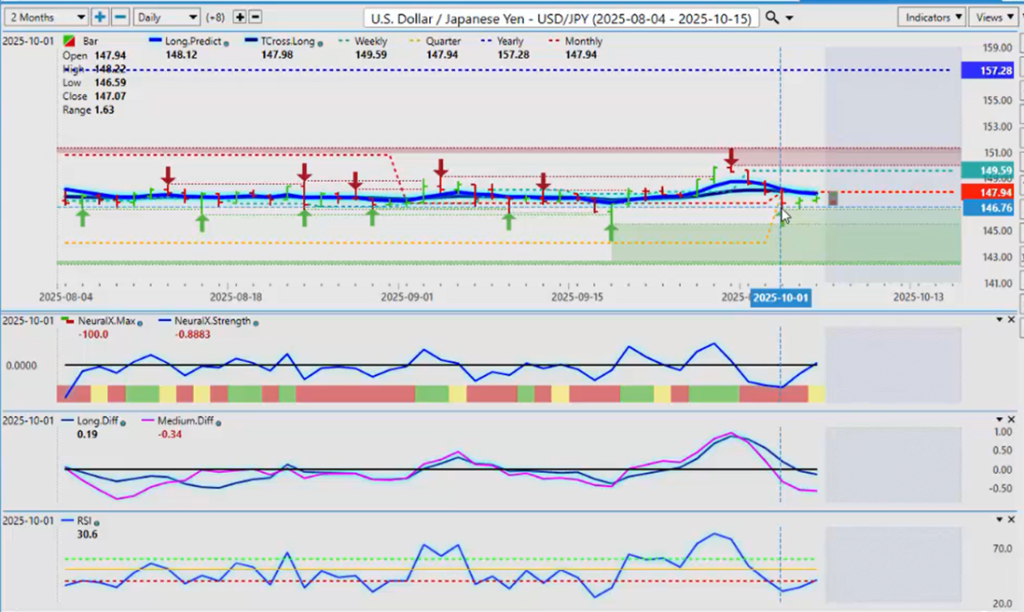
Now, the dollar yen, uh, the dollar yen is responding the way I would expect it to, uh, with being pressured to the downside. Uh, but again, uh, this is based on the US government shutdown—what the Fed is going to do. But for now, uh, in order to buy this pair, I think it’s, it’s a dangerous long, but there may be a long there. We’re negative on the year—15728. We’ve been negative all year on this pair. So, the primary trend, the bigger, broader primary trend, is indisputably down.
So, in my respectful opinion only, I have predominantly looked for areas to sell into a rally. I believe this pair to be grossly overvalued at 147. I’ve actually never, in my career, seen it this high. So, but that doesn’t mean it can’t go higher again, guys. And this is what makes a market, right? So, we’ll watch this area closely, but the T-ROS long and the monthly opening price are basically at the same level—147.87, 14794. One could take the technology here and say, “Okay, I’m going to put a buy limit order at 14810. And if it breaks through here, I’ve got a buy stop sitting there, ready to go, to go long.” But I, I think any longs will be very, very short-lived—uh, potentially a few days, maybe a week—and then it will start moving lower again. I believe the Bank of Japan will try and verbally intervene in this market again. So, this is a high-risk pair, whether you’re long or you’re short. But the indicators right now in Vantage Point are slowly trying to turn back up to the upside, but it has to be confirmed with a break of the monthly opening price at 14794.
US Dollar versus Canadian Dollar
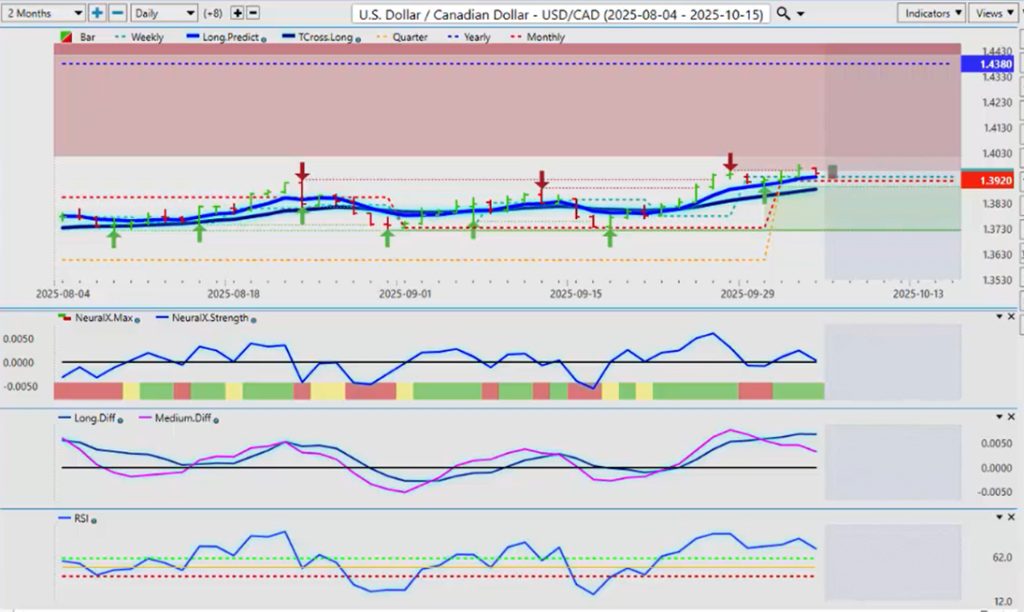
Now, the US Canadian pair, I’ve been a strong advocate of buying this pair. There is very little reason to buy Canadian dollars at the current time. Maybe, just maybe, there might be some kind of trade deal coming out of Washington this week between Canada and the US. And that, again—that fundamental—will be a driver here. If there’s any positive news out of that, that could be the trigger to strengthen the Canadian dollar. But that’s not going to change the, the current employment situation in Canada; the debt that’s being racked up by the new administration in Canada; no trade deal; tariffs. There’s a lot of negatives here. So, keep an eye on the, the, the trade talks between the Canadian prime minister and Trump. I believe he’s there on Tuesday. And if there’s anything positive comes out of that, that’s about the only thing that could send this, this pair lower.
But for now, again, your T-cross long is—and your monthly opening price are—the key levels to watch on the downside, and can they hold—13920, 138.884. It’s that easy, guys, if you know your levels. Okay.
Australian Dollar versus U.S. Dollar
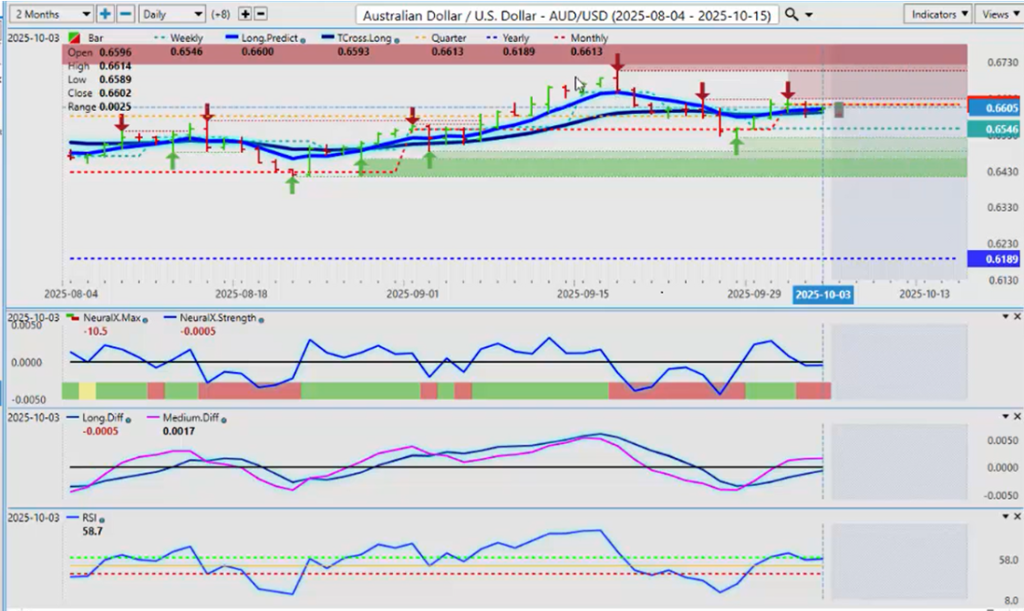
Now, the Aussie and the Kiwi, uh, both are under a little bit of pressure here. The dollar’s holding in there. The Aussie holding below the monthly opening price—6613. R-T cross long—6593. In my respectful opinion only, guys, the market is being prepped for a breakout. It’s coming. Either the dollar is going to, uh, take a lead here, or it’s going to get hammered by a number of different currencies; but they all have that in common.
So, the key level there to watch—again, if this turns positive on the month, another way of playing this is putting a buy limit order above—or a buy stop, excuse me—above the monthly opening price, where you’ve got an MA diff cross; we’ve got a medium-term crossover; price is rising; but that is the only thing stopping it from going higher—is 6613. So, again, I think there is a slight bias for a long here, but it’s going to be choppy.
New Zealand Dollar versus U.S. Dollar
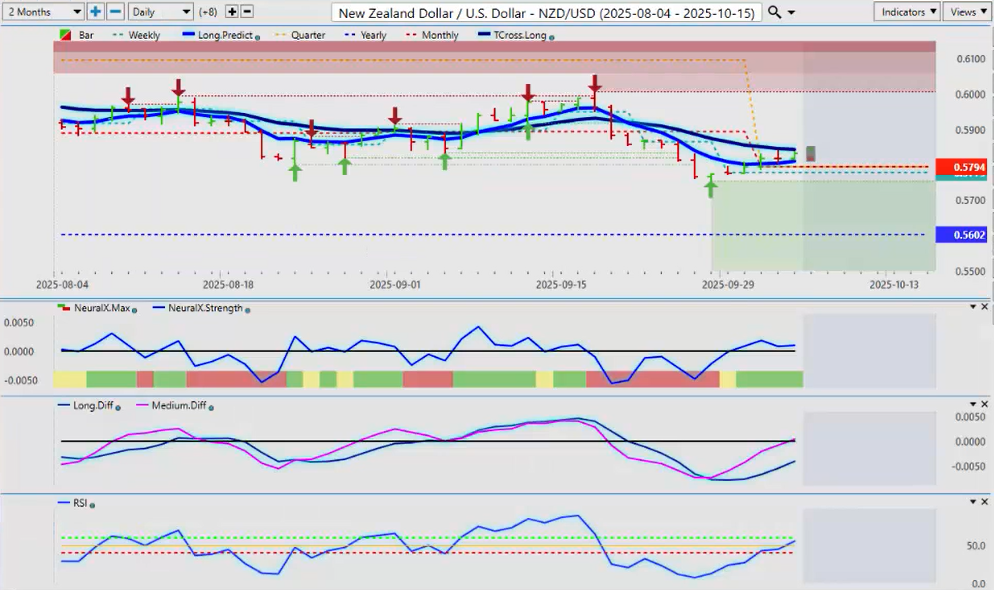
And the exact same thing is going to apply to the, to the Kiwi next week. Again, in my respectful opinion only, the Kiwi is grossly undervalued at, at 50—58 cents. Uh, but again, the primary trend is up here. We’re positive on the year. 5602 is the year-to-date opening price. January 1, 2025. If you bought the Kiwi then, you’re still positive on the year. And, and again, most of the time you will see different websites, etc., that move the goalpost. They, they—first they talk about year-to-date; then they say a random 30 days, or a random 90 days. No, no, no—we don’t do that here, guys. The current monthly opening price.
So, we are positive on the month on the kiwi. All we have to do is break through the T-ROSS long at 58.44, and you potentially could have a very good long trade here. But you always have that risk of interest rates with the, the Bank of New Zealand. That’s what the market’s worried about. But that’s what the media is telling them to be worried about. So, again, uh, they’re very quietly going back into longs here, right now. And the structural bias of this is starting to look rather bullish. We’ve got a medium-term crossover that just occurred, but once again, we can’t use a medium-term crossover by itself. We need to use it with the T-ORS long—5844. So, once again, another strategy—a buy stop limit above 58.44. Once it breaks free and clear of that—that’s clearly what’s stopping it—then you can have a buy order ready to go at that projected level.
So, I do expect another choppy, volatile weeks—a week. Uh, as again, what I’ve said here—what I’m seeing is that the market is being primed for a breakout, uh, in these currencies in one direction or the other. So, again, watch the key levels mentioned, and always remember—regardless of what happens—if you know your levels, there will be profit to be had.
So, with that said, this is the Vantage Point AI market outlook for the week of October the 6, 2025.


