


Welcome to the Artificial Intelligence Outlook for Forex trading.
VIDEO TRANSCRIPT
Hello everyone and welcome back. My name is Greg Firman, and this is the VantagePoint AI Market Outlook for the week of June the 14th, 2021.
U.S. Dollar Index
Now to get started this week, we’re going to begin again, where we always do, with that very important US Dollar Index. Now, as we can see here, as predicted in last week’s weekly outlook, that the dollar is usually very weak the week after the non-farm payroll number. Now we’ve come down lower all week within this range. Then on Friday, we can see we’ve had some profit-taking ahead of the Fed next week. Now, we did get a hot CPI number on Thursday, but as you can see, that had very little effect on either the stock market, the S&P 500, the Dow, the NASDAQ, or gold. A number of different other markets were basically unphased by that very strong CPI number.
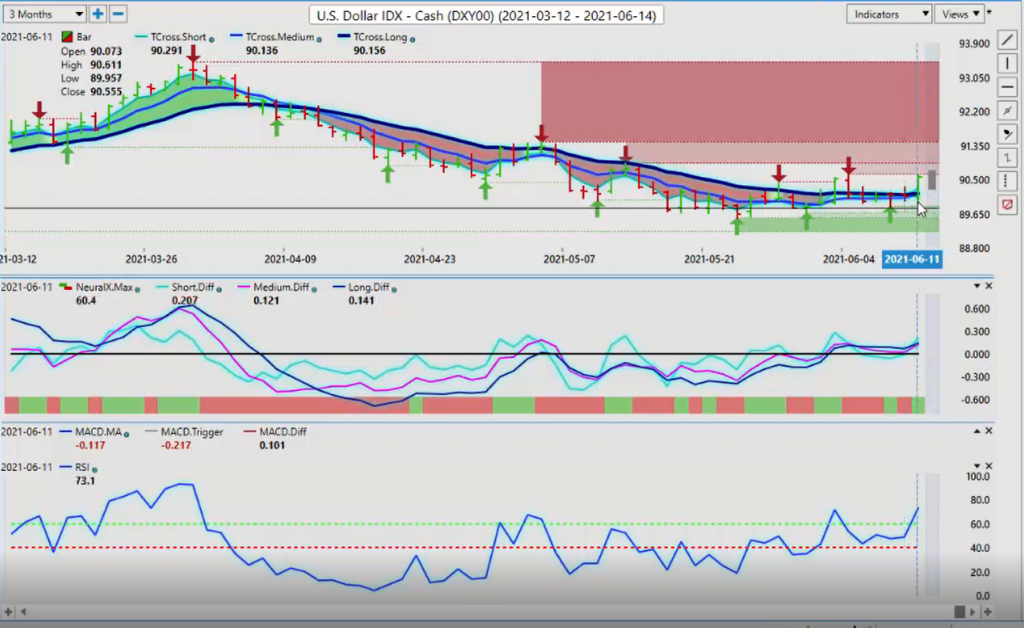
Now, the next big leg up or down in the dollar, is going to come via the Fed on Wednesday when we hear their monetary policy. Now again, we’ve got a very, very vindictive Fed. This Fed does not like being criticized in any way, shape, or form, and he’s really pushing back against the growing number of calls to start raising rates here and he refuses. So again, I would expect him to put additional pressure on the US dollar next week. I think again, as you can see the dollar index move lower for the better part of the week, only recovering on Friday in thin, illiquid markets. Now the current signals from VantagePoint are suggesting that the initial push to begin the week will be a little bit more dollar strength, but as you can see here, we’re still unable to even close two days in a row above 90.44.
We’ve pushed above that area up to the 90.62 area, only to fall again and come right back up to that newly formed verified resistance zone and fail yet again. So if the dollar is going to push higher here, in my respectful opinion only, it’s usually not until September, October, that the dollar starts seeing real demand again. So I can expect more sideways trade. But if the Fed is even slightly hawkish here, that will push the dollar higher. But my optimism with this particular Fed, remains heavily guarded. I believe he will actually sink the dollar and send equities and potentially gold higher. But again, we can see, we’ve got a number of verified zones up here, and that resistance goes all the way up to 91.43, but the big hurdle that we must clear, we’re looking for a two-day close above 90.44 and the 90.62 area.
If we can get that and our predicted differences continue to rise, then we could see additional strength, but that will be 110% dependent on the Fed’s statement. Now, if we get a break higher on the dollar, what we to do is, look at potential markets that will go up with it. The top 10 correlated markets ProShares Ultra Short, obviously. We’ve got Gold Miners Bears 3X, US/Canadian pair, Domtar, CBOE Holdings, Verizon. These are just some of the markets that will advance with the dollar. Now, in the inverse side of that, the inverse correlation, these particular stocks would go down if the dollar rises. So again, that would be Major Drilling Group International. We’ve got Equinox Gold, Euro/US, the Euro, Futures Contract. So again, it’s very interesting when we look at things from inside a neural network, to identify where some of these trades are.
So, as you can see on the futures side, we have Gold, Light Sweet Crude Oil, Swiss Franc, Japanese Yen, New Zealand Dollar. Again, on the ETF side, the neural networks can identify these markets for us and save us the time and the work by just going in and identifying where these positive and negative and inverse correlations are. So again, if we think that the dollar is going to go higher, then we can identify what markets will likely follow the dollar up and that’s these markets right here. And again, I’ll pause here for a minute, this is being recorded. But this is very interesting stuff because the basis of inner market technical analysis, is it’s not just one trade, it’s multiple trades that will spin-off either a dollar rally or a dollar sell-off.
Gold
Now, as we look at the additional markets that again, are going to be big movers next week is, of course, gold. Now, a lot of traders looking for this seasonality in gold, to again, come to fruition, but we’re really struggling up here. The yearly opening price, 1904, that I’ve repeatedly talked about all year long. The dollar index yearly opening price, 89.80. We must break down below that guys, if gold is going to break above 1904, But the Fed is likely going to be the catalyst here. If the Fed pushes this again, pushes further dollar weakness in saying, rates are staying the way they are. They’re not raising them until 2023, 2024, that will push gold higher and the dollar lower. That’s what we would look for.

Now, we’re holding on our TCross Long, 1882, but this verified support’s low, which is coming in at 1855. That’s the line in the sand for us. If we break down and close below that level for two days in a row, then that would signal we are likely going to see dollar strength, Euro weakness, but that is certainly not the case just yet. But the indicators in VantagePoint, the predicted differences are down, the neural index is down and our RSI is warning us that we’ve got momentum building to the downside. Now, once again, I believe a lot of that is just profit-taking from Friday, we will see. But if gold makes a big push down and the dollar makes a big push up on Monday, look for a complete reversal on both, on Tuesday.
I’ve often warned traders of this in the VantagePoint Live Training Room with my own direct clients and here on, excuse me, Vantage Point AI YouTube, of that reversal Tuesday trade. So just be cautious of that, but mainly know your levels.
S&P 500 Index
Now with the S&P 500, we’re just going to go down here to the actual cash prices here. Once again, when we’re looking at the S&P 500. Sorry, I just want to get the right chart up here. Once again, we are challenging this resistance, this verified high at 4234. The market continues to push up above that, closing the week at 4247. Most of the indicators here are warning that we still have further upside, but once again, comments, the Fed press conference, that’s what you want to watch this week.
If they’re starting to talk about raising rates, tapering QE, then again, that could be detrimental to the stock market. But I don’t think that this particular Fed is going to budge. I think he’s going to continue to say, the CPI number was transitory, the unemployment numbers are transitory. He’s going to keep pushing this narrative, in order to keep the stability in the market or to simply fend off some of the people that are challenging his direction in this current environment. So we shall see here. But right now, when we look at this, so once again, you have a lot of different markets that can actually spin-off of this.
If we look at the internals through the neural networks, if the S&P 500 continues to advance, then you can see these markets here, they will also advance. But if the S&P 500 does not, then this lower section of the inverse correlation, ProShares UltraShort, FTSE Europe, we’ve got the VIX Index, all of these will turn around and go higher on that inverse correlation. Once again, when we look at things through the eyes of a neural network, we see things very, very differently here. When we’re talking about science-based trades, institutional money, again, we don’t want to follow impulse wave buying and selling, we want to follow institutional money, where are they putting their money?
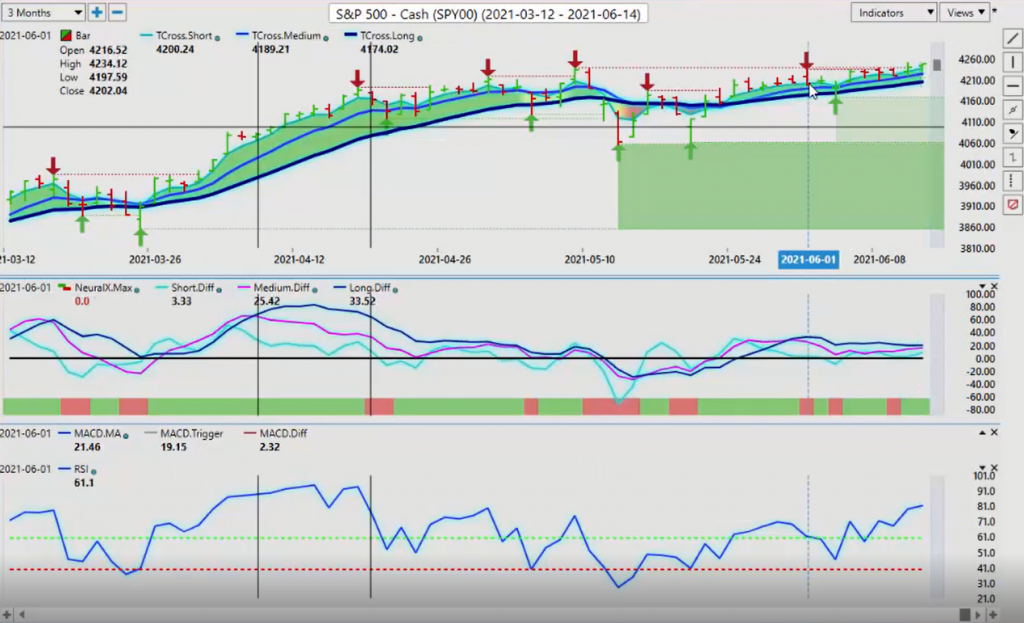
Because again, when we look at impulse buying and selling, these are not traders that we want to follow. We don’t want to follow that type of trading, because they usually don’t have enough power to move the markets, where the institutional guys do. And we try and track exactly which markets they’re putting their money in. We don’t want to beat the market here, guys, we want to join it. So we just have to figure out, where are they putting their money? So, again, right now, they are pretty much all in on the stock side, but that could change very quickly, if the Fed changes his position. So when we look at our key line in the sand here now, 4205 is the level we want to watch to start the week.
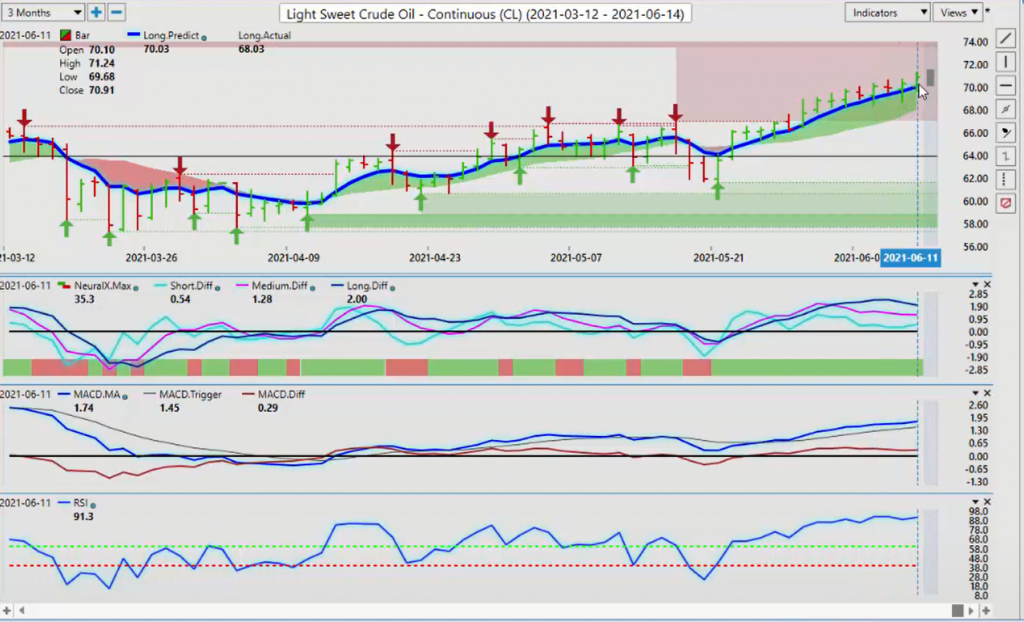
If we click on our F8 and use our predicted moving average, this is very similar to taking candy from a baby here, guys. Using that predicted moving average as a daily pivot area to buy from, every single day, this is all the market is willing to give us. So we take what we can get, take profit, wash, rinse, and repeat, is something I often say. Just keep doing it until the market shows that it’s getting ready to make the next leg up or down. We don’t care which, we just want to be able to track it when it does. Now, with the equity markets, moving higher, Light Sweet Crude Oil continues to advance. And again, we’re up to 68.14 on our key TCross Long. We’re holding above that.
But once again, when we click on our F8, you can see on a daily basis, how we can get in using that predicted moving average as a potential entry point. And on a daily basis, it does do very well. Now, where I have some concern, is this is telling me, on the predicted difference, the medium-term trend is weakening against the longer-term trend. That is absolutely concerning, and it could be a warning sign that oil and the S&P is getting ready to pull back. But that’s going to be the Fed that triggers this on Wednesday, in his press conference. And I don’t think he’s going to do anything to disrupt what’s currently going on in the markets, and he’s going to try and keep it at the status quo.
Bitcoin
Now, one of the markets that’s certainly causing the Fed problems, along with other central banks is, of course, Bitcoin. And now I’ve been a strong advocate for buying Bitcoin for many years now, since early 2008, here on Trader Planet AI and the VantagePoint Live Training Room. And most recently, we’ve got El Salvador that’s actually taking Bitcoin on as a legal tender, that they’re accepting cash payments. Now, one of the comments that I did find interesting, that their president stated is, one of the main reasons they’re doing it is because the central bankers there have made such a disaster of the El Salvador economy, that their own currency is virtually worthless. They will not be able to manipulate Bitcoin that way.
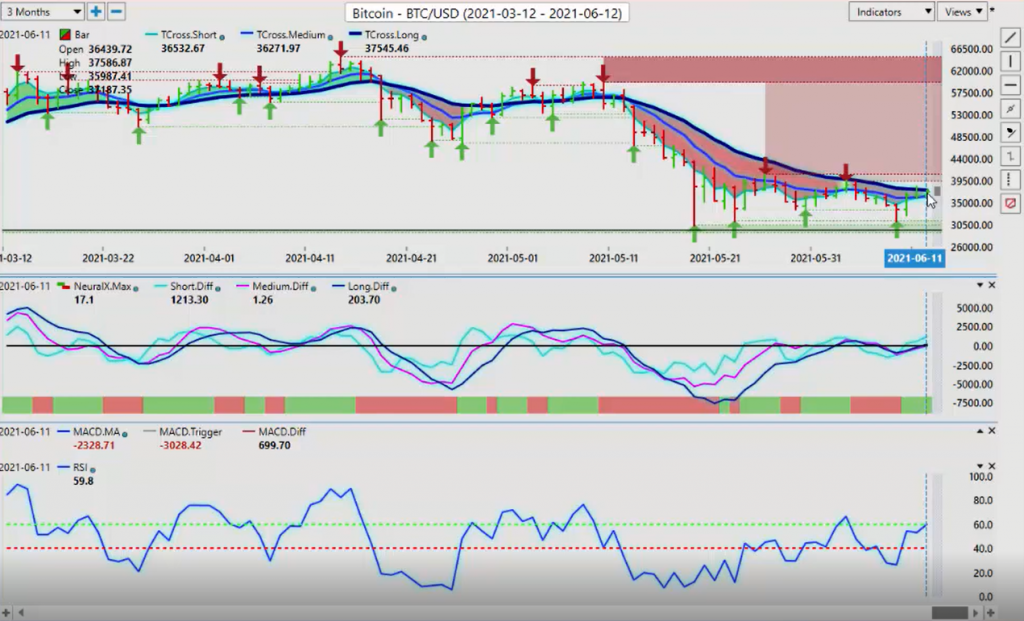
And again, right now, they’re primarily using the US dollars. So they’re all in on Bitcoin, whether that will continue to push Bitcoin higher, that’s left to be seen. But I do like the way they’re thinking, for sure. So I expect Bitcoin should push through the 37,545 mark and start to advance, but we must get through these verified resistance highs, 39,500. And again, at 40,771. You can see, that if we break through these two verified zones, then that opens the door back to 59,000 and that’s what we would be looking for. Our predicted differences are rising, our predicted RSI is showing we’re gaining momentum at 59.8, but with the neural index and the predicted differences, starting to move above the zero line, we could be just on the cusp of another breakout to the upside on Bitcoin.
Euro versus U.S. Dollar
Now, as we look again, at the Euro/US pair, the number one traded for X pair, we want to make sure we’re looking at the internals here. So if the Euro/US is going to go higher, or if this pair is going to go higher, then obviously, the Euro futures are 99% correlated, El Dorado Gold, SSR Mining, TSX, Major Drilling Corp., there it is again, Equinox Gold, there it is again. You can see, we just looked at that in the dollar index, and these markets are driving factors. The inverse correlation US CAD, Verizon, you can see the similarities between the Euro/US pair and the US Dollar Index and that’s because they’re so incredibly highly correlated.
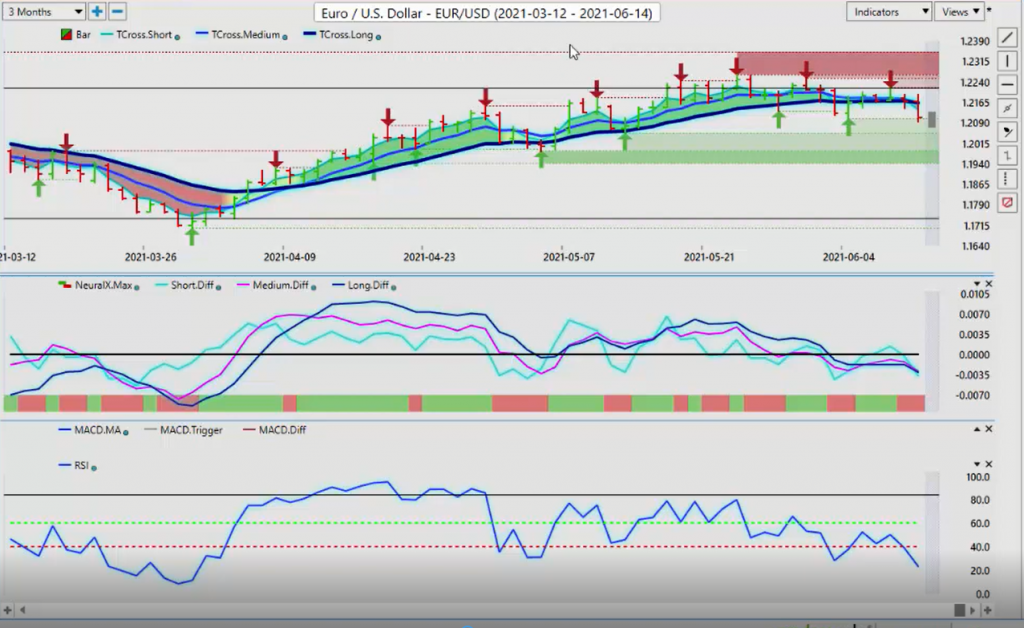
So once again, when we look at the Euro via what a neural network looks at with the Euro/US pair, it’s looking at the Dow Jones. It’s looking at gold, Canadian dollar, natural gas, British pound, Dollar Index, all of these different markets. It’s an amazing thing to look at here guys, when we understand what the basis of intermarket analysis is. So in short, what I’ve stated, I’ve put the US dollar and the Euro and Bitcoin and gold into two different camps. You’ve got the dollar and Bitcoin, which seemed to go into one camp and you’ve got the Euro and gold, very highly correlated to each other, in the other camp. That will be the battle this week.
So right now we pushed lower, but only on Friday, did we have this big push down, the remainder of the week was basically flat, to slightly bullish. So again, we’re looking to see if these zones down here can hold. We’ve got 1.2104, which we closed just above. Then we have additional verified support at 1.2052, followed by the current immediate range bottom, which is 1.1986. Excuse me. Now, if we lose 1.1986, obviously we would make a pretty quick run at 1.1704. But again, it will be dependent on what the Fed’s current position is and what his forward guidance is going to be. So, if there’s a little bit of light at the end of the tunnel on interest rates, that will boost the dollar but again, it will be up to the Fed.
The key levels to watch to begin the week, 1.2164. If we retake 1.2164, then we’re likely getting ready to extend higher, meaning gold would follow. We click on our F8 in our VantagePoint software, that key pivot area there, is 1.2156. So to start the week, we know exactly where our resistance is, right around this 1.2060 level. And if we break through that, then we’re going to likely go back after that yearly opening price at the 1.2240 level. But we must take that level out and gold must breakthrough 1904, if both of these two are going to extend higher.
British Pound versus U.S. Dollar
Now with the British pound going to next week, once again, it’s holding its own here, right along our verified support, low at 1.4083, likely going to come under a little bit of pressure, but ultimately, this particular pair will follow the Dollar Index. If the Dollar Index breaks down and collapses off the 9060 level, that will push the British pound back up over 1.42, I suspect by Thursday, that’s where we’ll be. Because again, we’re starting to see a pattern with this particular Fed.
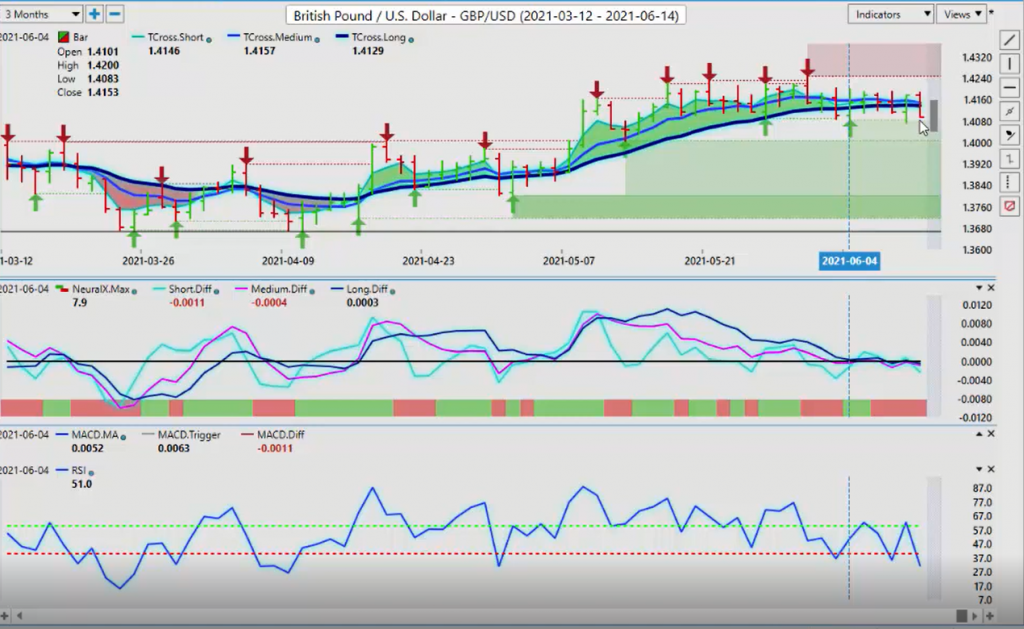
But the main thing is, looking at these indicators and watching things very closely. Our neural index is still down. So, the immediate indicators to begin the week, suggest that the initial move on Euro/US and pound dollar will be to the downside. But the question is, will they pause and reverse going into the Fed on Wednesday? So once again, 1.4138, if we click on our F8 in our software, our key pivot level there is 1.4148, So we know exactly, just like Euro/US, where our resistance is. You can even put limit orders to buy, at say, 1.4175, if it breaks above these predicted moving averages, it’s likely going to break higher and we’ll see further dollar weakness. That’s what we would be looking for.
U.S. Dollar versus Japanese Yen
Now, with the dollar/yen, once again, with the dollar/yen, back and forth, it goes. And you can see, all week, it played in a very tight range, largely between the high of 109.65 and a low down around the 109 area. So we’re continuing to play this game with this particular pair. When we look at the internals of this particular pair, this is an easier way to figure out what it trades with. When we look at it inside the neural networks, we can see those correlations. But if we break them down to very specific correlations, we can see, International Flavors and Fragrances has an 85% positive correlation, meaning, if dollar/yen goes up, so will that.
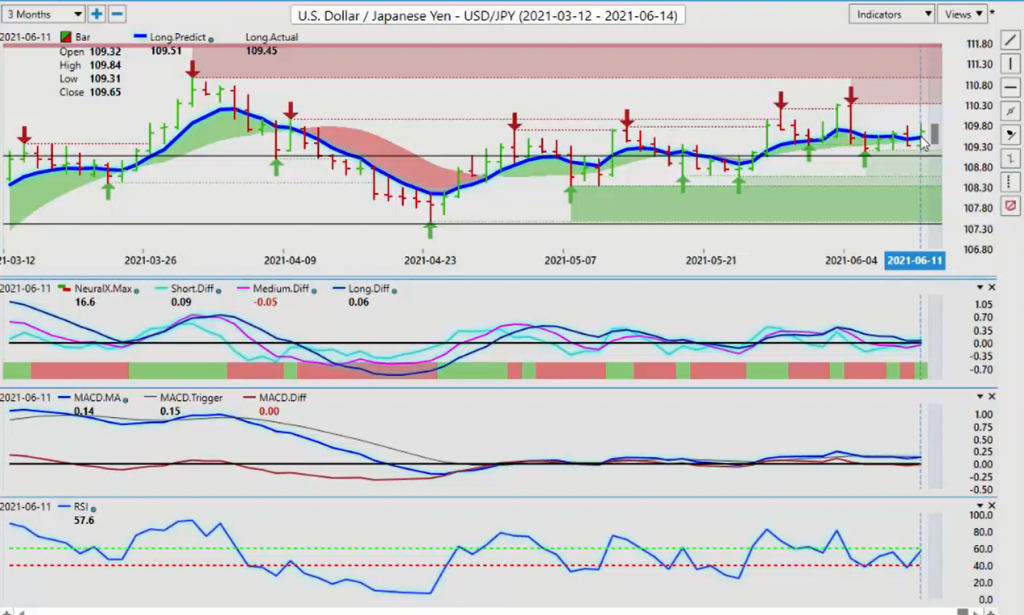
The Box, we’ve got Sprouts Farms, Werner Enterprises, Scorpio Tankers, a very strange mixture, but having the neural networks at our disposal to find these markets, that’s half the battle, guys. Then we attach an actual percentage to it. What is the correlation? The inverse side of that, we can do the exact same thing. So once again, if the dollar/yen actually breaks lower than the Euro CAD would be a buy trade, this is what we’re actually looking for from that inverse side. But again, if we look at the dollar/yen, we can see that via the dollar/yen, there’s actually 20 other trades, 10 that are positively correlated, meaning, if the dollar/yen goes up, these ones will go up. If the dollar/yen goes down, then this group of 10 will go down.
And that is exactly the basis of advanced inner market technical analysis, is to identify not one trade, not two trades, not three trades, but upwards of 15 or 20 trades, all at once. And again, when we understand these things, then we can trade them. We certainly don’t have to trade 20 markets at once here, guys, but we can trade two, three, maybe even four or five, and we can do it with a degree of certainty, that we’ve got that inner market correlation to support us. So for now, this week, 109.41, that’s the level to keep our eye on. When we click on our F8, our key VantagePoint, peak long-predicted, excuse me, 109.51. Our indicators are basically running sideways right now. This pair like many other pairs, like many other asset classes, is sitting, waiting for a catalyst.
And of course, the catalyst will be the Fed on Wednesday, the press conference, that’s the one you want to watch for. What is Powell’s real position? That’s what we’re waiting to hear. Then we should get into some type of a trending move before we get into summer trade at the end of the month.
U.S. Dollar versus Canadian Dollar
Now with the US/Canadian pair, once again, the US/Canadian pair had a large spike up, but on a Friday, in thin, illiquid market, it’s been down the better part of the week, just basically sideways. Once again, it didn’t react very well, either to the US CPI number, it still continued to trade sideways. Now, we’ve closed rate on a verified resistance high at 1.2177. So if the US/Canadian pair is going to fail and move lower, it’s likely going to be around the 1.22 area.
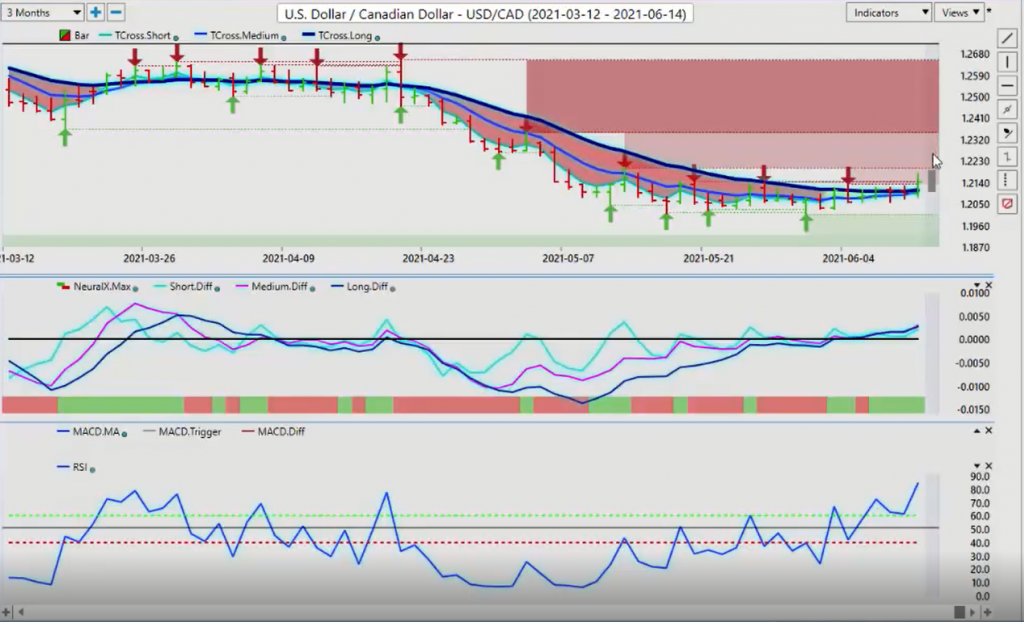
We would look for oil prices to continue to advance higher with the S&P 500, that would put strength into the Aussie, the New Zealand, and the CAD, but for now, at least for the time being, VantagePoint is accurately called that this is moving up. So when we look at that TCross Long, it’s now 1.2108, is our critical level. When we look at our TCross Long by itself, or our long-predicted, the long-predicted, 1.2109. So we know that all of our support is at the 1.21 level. So the probability, that we slide back to that area by early Tuesday is very, very high. Barring any breakdown in the equity markets, gold sells off, oil sells off, stocks sell off, that’s what would push US/Canada higher. But again, I don’t think we’re going to get that until after the Fed, but I would expect a retracement on Monday or Tuesday, back into the 1.21 area and we can reassess once we get there.
Australian Dollar versus U.S. Dollar
Now, once again, with the Aussie/US currency pair, we’ve got another potential opportunity at the lower end of this range, the yearly opening price coming in at the .77 level. On the last push lower on the ADP report, it pushed the pair down, all the way to .7646, but that represents our support for the week and a potential buy area. So again, if it’s a buy the rumor, sell the fact, if the market believes that the Fed is going to have to acknowledge inflation, and the Fed is going to have to acknowledge that he’s wrong on the interest rates in general, I don’t think that this Fed is going to do that. And I don’t even think he’s going to hint at that in this meeting. I think he’s going to say, that all of this is transitory. So again, as some of these payers move lower and higher, we’ve got buying and selling opportunities.
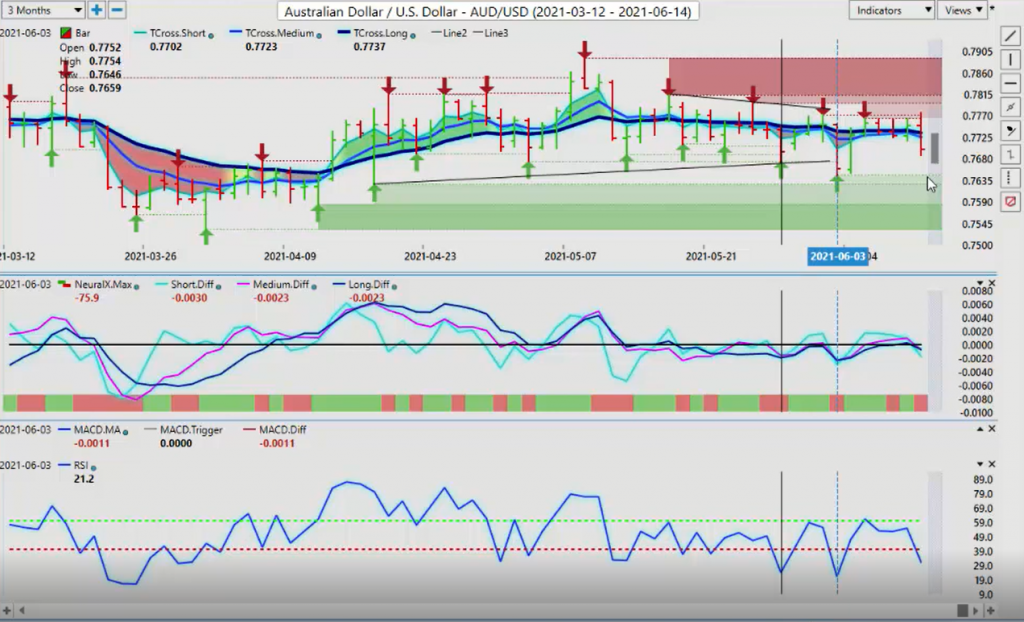
So to begin the week .7737 is the area we want to retake. If we click on our F8 in our software, we can see that that long-predicted .7724. So again, to begin the week, we know exactly where that resistance is around .7736. When we look at the internals again, inside that Aussie pair, these are the positive markets that will go up if the Aussie goes up. Designer Brands, Barrick Gold, NCR, Chart Industries, Mountain Province Diamonds, Royal Gold, Japanese Yen, Aussie Canadian Dollar, the Inverse Side, British Pound, Japanese Yen, Singapore Japanese, Hydro One, British Pound/US Dollar, US/ Japan. So the neural networks tell us what these markets are both positively and inversely correlated.
Once again, if we understand those correlations, that can spin off to multiple trades, but to simplify it down, if the S&P 500 continues to advance, then it’s very likely the Aussie will follow.
New Zealand Dollar versus U.S. Dollar
Now, not only will the Aussie follow, its counterpart, New Zealand, would likely do the same. Now, New Zealand’s taken a bit more of a hit, but it’s come right back down, this is the bar from the ADP report from the previous week, that it sold right off.
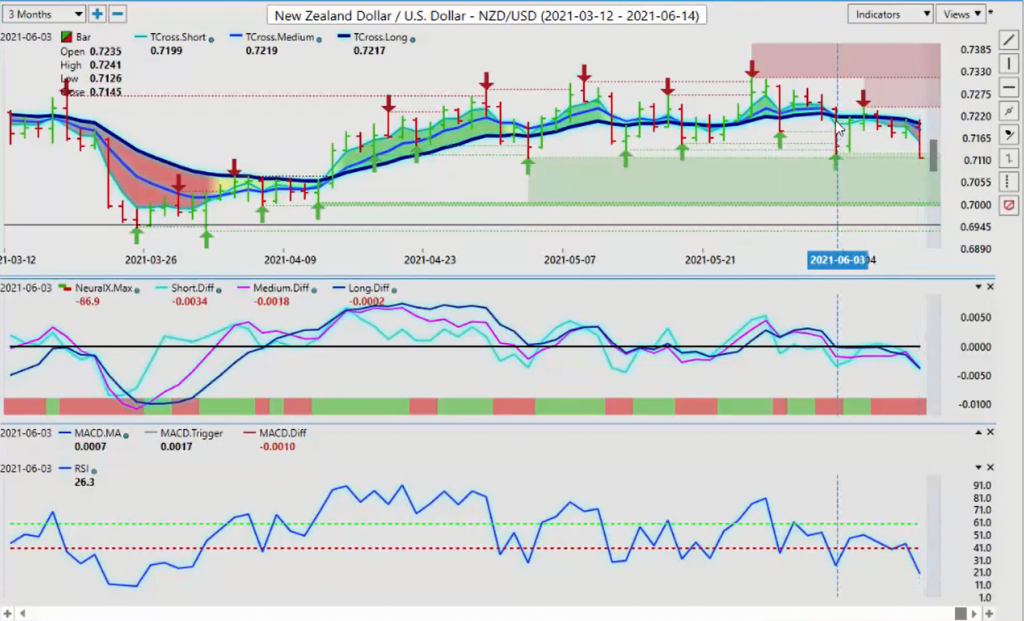
But whenever we see these large bars like this, whether they be up or down, very often, within the next day or two, it goes the opposite way. Classic stop-loss, hunt this is profit-taking at its finest. So, we will continue to monitor to see if this is just a temporary move and profit-taking on Friday. And the major market participants, if they are getting ready to move back into US dollar, shorts. So with that said, this is the VantagePoint AI Market Outlook for the week of June the 14th, 2021.


