


Welcome to the Artificial Intelligence Outlook for Forex trading.
VIDEO TRANSCRIPT
Hello, everyone and welcome back. My name is Greg Firman, and this is the VantagePoint AI Market Outlook for the week of July the 20th, 2022.
U.S. Dollar Index
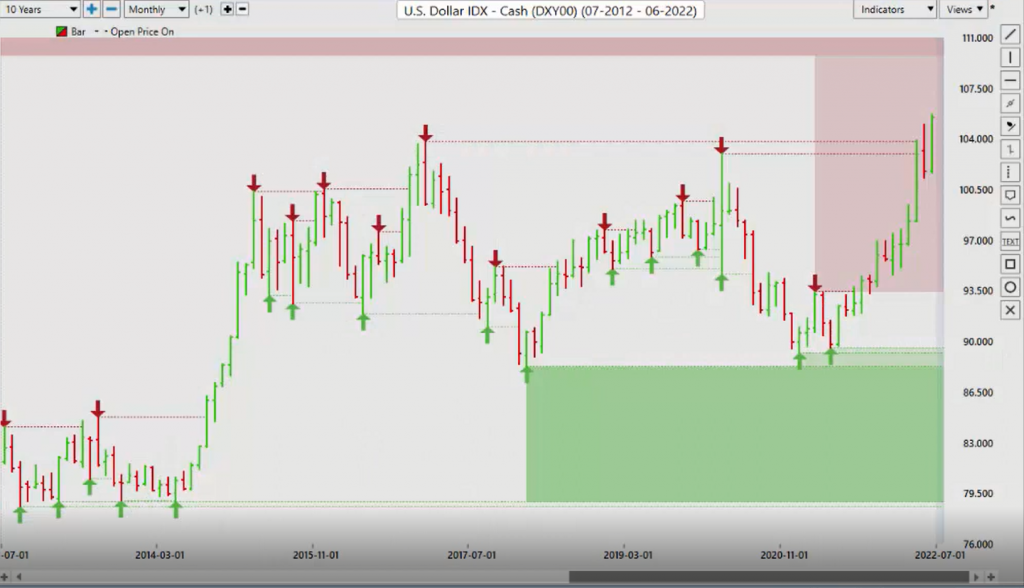
So what we got was exactly what I stated last week. And that is why we saw the Euro/U.S. rise, the pound/dollar recover, Aussie/U.S., New Zealand/U.S, they recovered, but the trend didn’t change, which I will discuss throughout the video because there does seem to be some confusion around this, that the Neural Index is the primary trend when it’s not.
So when we look at this going into next week’s trading, we see that we have a conflicted signal here. We are above the VantagePoint T cross long. The Neural Index on the dollar is red. So again, these two indicators are conflicted. But to be absolutely crystal clear, you’re looking for these two to match. So if we’re above the T cross long, in order to buy dollars, we would also be looking for the Neural Index preferably to be green. But if it’s not, then that’s not relevant. You can see that we came down on Thursday, crashed lower. There is no verified zone here. There is no Fibonacci level. There is nothing here other than the VantagePoint Predicted Moving Average. This is used as a pivot level.
So again, I want to clarify this to assist traders for educational purposes. Again, no recommendation is ever been made to buy or sell currencies in here. This is not a trade signal service. This is an educational website to assist the many VantagePoint users in developing new strategies. And if they work for you, that’s great. If they don’t, then that’s fine too.
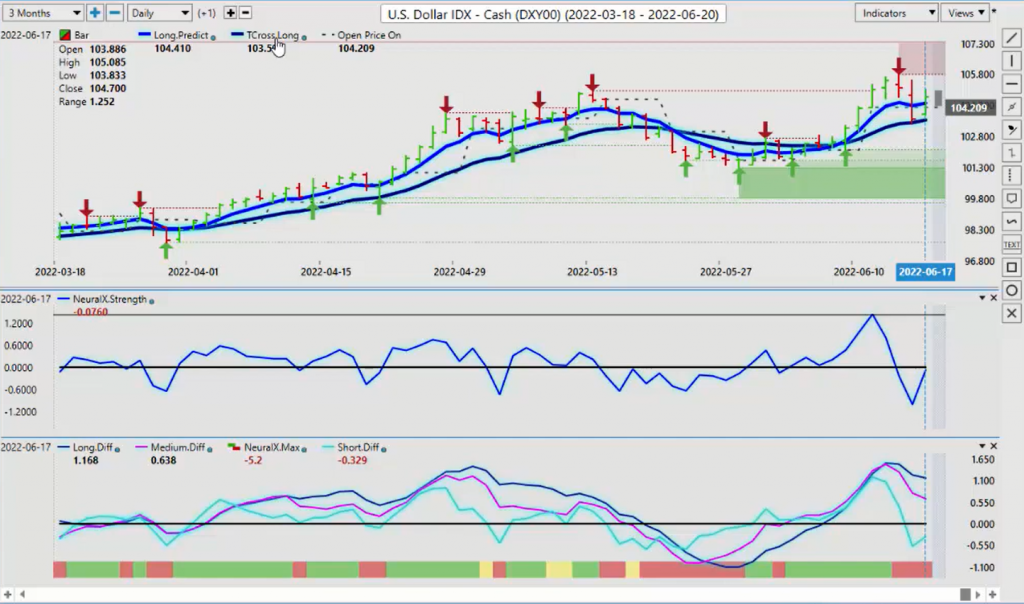
So when we look at this right now, we’ve come down. We have hit the VantagePoint T cross long to the number, 103.46. You will see this throughout this presentation, that while I was hoping the dollar would sell off further, we’re not there yet. So in order for the dollar to weaken further here, guys, we must break down below the T cross long. And again, what I can even do is, for people like Mark and some of them, I can highlight this for you so it’s maybe easier to understand. So what I will do is go like this and say, okay, when we look at that, you can see I’ve locked my cursor. That is your T cross long. You have the exact pivot level, which is identified right here, as we did last week, as we’ve done every week, and what I will do again this week.
So right now, in order for the dollar to accelerate losses, we must break down below this area. The Neural Index, again, it plays a very small part in that because it’s a short-term indicator. Stop-losses would never be put near the predicted high or predicted low. They would be put above or below the T cross long. So again, if we have a predicted high and low for the Dollar Index on Monday, you can see that there’s a fairly substantial gap between the predicted low at 104.32 and the T cross long at 103.83. But as long as we’re holding above 103.83, the dollar trend is primarily up. We’re above the yearly opening price, and we’re above the VantagePoint T cross long. That’s the way we would look at this.
Gold
Now, when we look at gold contracts for next week then, as I had stated last week, we need for this to get moving here. Now, what I will point out to everybody, seasonalities are not a guarantee of anything. But I believe the U.S. is going, globally they’re pushing us into a recession. I think 70 or 80% of the time when the economies go into a recession, gold goes higher. There is a known seasonality in gold in the end of this month actually, or the beginning of July where gold rises. I’m not saying gold is going higher or gold is going lower. This is not a trade signal service here, guys. Again, no recommendation is being made to buy or sell gold or buy and sell the U.S. dollar. I’m simply pointing out where these levels are and how to properly read the VantagePoint software from a medium-to-longer-term perspective. If this was a daily service or a daily educational service, then we would be looking at the predicted high and predicted low and matching it to the Neural Index, but the strategy wouldn’t change.
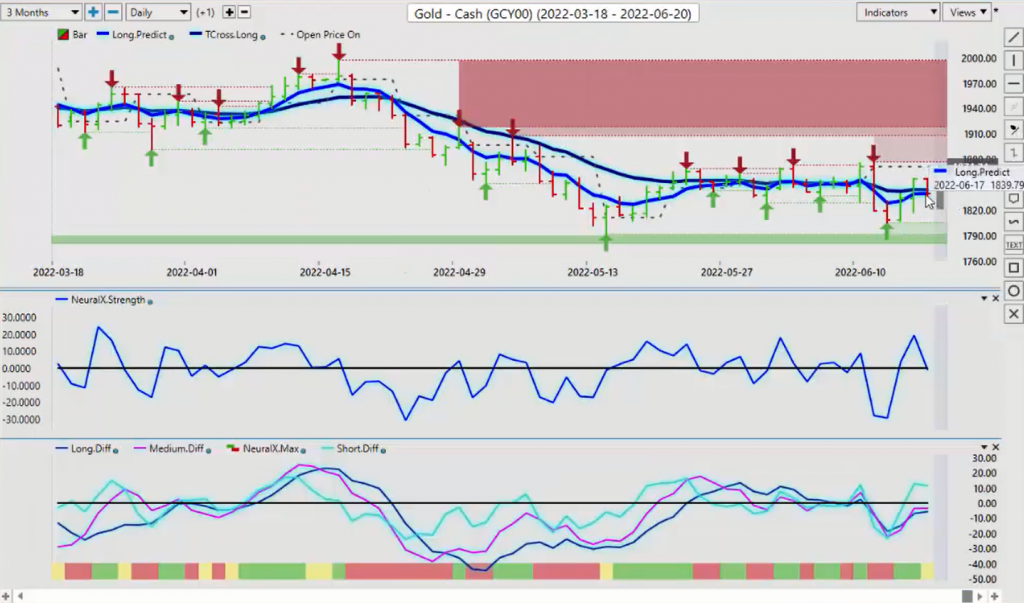
So in this particular case, the gold contracts are trying to get back up above that T cross long, 1844. The strategy doesn’t matter what market it is. It’s all the same, guys. So at 1844, if we can overtake 1844 this coming week and stay above it, then gold is likely to move higher. 1828 is the yearly opening price. So if I go into my properties here and I click on my point in time and move this to the yearly price, then I can do even further analysis here. So the yearly opening price on gold, which is one of my favorite non-indicators, that level is coming in, the point in time, as you can see, is coming in at or about the 1828 area. So these are the levels that we want to make sure that we’re keeping, 1829, open price on 1829.
So if gold can remain above 1829, then that seasonality at the end of this month would still have the potential to move higher. And again, if it does get moving and more recession talk continues, then that fuels gold long contracts in my respectful opinion. Yes, it could be wrong. I’m just simply pointing out that this is what I’ve seen over the many years that I’ve been doing this. And betting on longs on the U.S. dollar over the last many years has not been necessarily the best trade.
So once again, with the gold contracts, we can see we have an MA diff cross, which represents the medium-term crossover and the long-term crossover. So that trend to the downside is weakening. The Neural Index in this particular case has gone to yellow, meaning caution. But again, that is a short-term indicator, one or two days. The primary trend is determined. You want to match the primary trend to the Neural Index and try and trade in that direction. So there is a slight bias for gold to go higher.
But again, that’s still going to be affected by the U.S. Dollar Index. We’re still looking for the Dollar Index to remain flat or down on the month. If we look at the seasonality standpoint on the Dollar Index, normally it peaks at the end of June, and then it basically goes sideways until September 1. There’s a brief period of about a month and a half of strength, and then it sells off again into November. So these are patterns that we can follow.
S&P 500 Index
Now, when we look at the S&P 500 and stocks in general going into next week, they’re quite ugly to be perfectly honest. But in my respectful opinion again only, the people that are crying out for 1% hike, 2% hike, some even want it 3% hike, the reason why a lot of these fund managers say that is for their own purposes. And I don’t necessarily disagree with what they’re saying because the Fed is causing all of this confusion in all of these markets. So their theory is, at least the ones that I work with is they just want it over and done with and say, okay, if you say at the end of this cycle you’re going to be at 3.8%, then why don’t you just go there now and stop all this volatility? And then the stocks will recover.
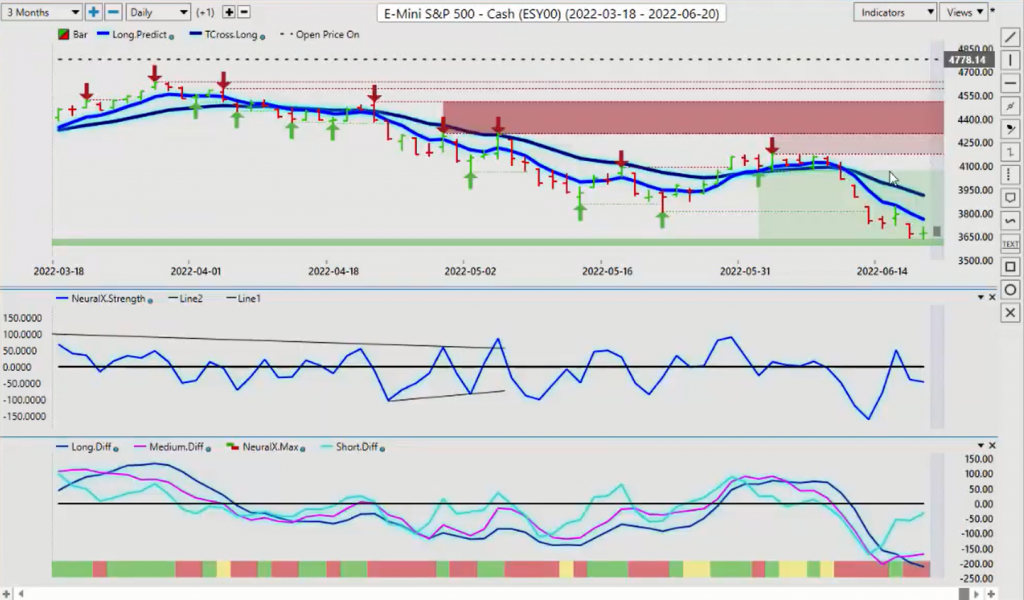
So a lot of people are looking for guidance from the Fed. That’s like the blind leading the blind here, guys, especially after listening to… I was very disappointed in the fact that Powell caved to the pressure where I still don’t necessarily agree that rate hikes is the cause or the fix of all of this because you weren’t hiking pre-COVID. You were actually cutting pre-COVID. So all of this inflation we’ve actually allowed the governments to create by locking the economies down. So again, there’s likely more pain ahead for the stock markets. But for now, right now, you can see that we’ve got a bit of a neutrality here coming in around the low at 3636. But as I stated in last week’s Weekly Outlook, I was really looking for the 3720 area to actually hold. And it didn’t. So we’ll see how the week starts out.
But for now, what I can say looking at the VantagePoint software is that we do have an MA diff cross here. But it’s not with the Neural Index or the Neural Index Strength. Our key pivot levels, the first one is the long predicted at 3761. Then we have our T cross long at 3910. Once again, as I stated at the beginning of the presentation, the further we move away from the VantagePoint key pivot level, the T cross long, the more likely it is we’re going to retrace to it. So what do we need for stocks to move higher? We need the dollar moving lower, the U.S. dollar moving lower.
So again, expect another very choppy start to the week here. But to just say that we’re in a bear market territory now, like some of these analysts are saying, I will remind everybody what I have discussed from January 1 is that if the stocks are going to have a decent year, we need to hold above the yearly opening price. That price on open is 4778. This is in a fairly substantial down trend here at least in 2022. So again, watch for these retracement points because the MA diff cross is warning us there may not be as much downside as what some of these pundits are saying.
Crude Oil
Now, when we look at light sweet crude oil going into next week, once again the verified resistance zones up here were unable to be breached here. Once again, that stronger dollar helping to push oil prices down a little bit. Where I’m a little bit confused, I must say, with the current U.S. administration is to me it would be very easy to bring oil prices down. All they have to do is do what politicians do best, lie. All Biden has to say is, “Look, we’re thinking about revisiting Keystone Pipeline and maybe reopening that. We’re no longer accepting foreign oil. We’re going to start doing this here.” All that type of job owning would force at least some of the speculators out and say, “Uh-oh, we pushed this a little too far.”
So I’m hoping that he will start doing that, or someone in this U.S. administration will start doing that. Just job own it. And like I said, do what they do best and tell half-truths, part-truths, or just lie because we know he is not reopening Keystone. We know he’s not doing this or that. But the speculators don’t know that for sure. And over the years, I’ve seen this done many times and it’s been very, very effective.
So if we start hearing that kind of rhetoric out of the current U.S. administration, then that will push oil prices down because they, quite frankly, it has gotten to a fever pitch here. Now, that could also be said with real estate prices, with car prices, with all these other things. Everything is just inflated. So if this inflation starts coming down, or we all go back to normal and say no more lockdowns ever again, we’re moving forward, then things should improve. And ultimately, oil should go lower.
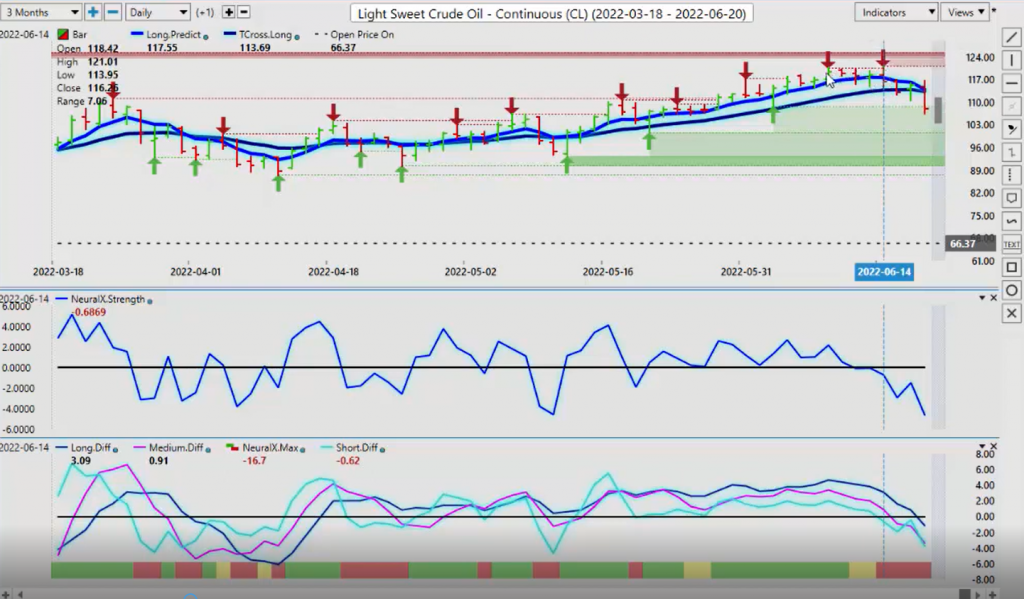
But going into the summer season, there is still room for further upside. We’re within the range. But once again, focus on the key VantagePoint pivot points. So if we’re to look at this and we’re to use the Neural Index properly, not as some people are attempting to use it as a standalone indicator. The Neural Index and the predicted high and predicted low to be clear are not standalone indicators in my respectful opinion. The first goal is to identify the primary trend. So if we close below the T cross long, this is quite easy to do here, guys. We have a number. VantagePoint’s giving us a number, 113.29. We can all see it. I do this every single week, right?
So when we look at that key number, in this particular case we have closed below the T cross long. 113.29 is our key area. Our Neural Index Strength is pointing down and Our Neural Index is down. So all three of these are in agreement. So then what you would do is what we would normally do under normal conditions. Remember, oil prices are firmly above the yearly opening price. 66.37 is the yearly opening price. So we’re firm. It’s still in a very strong uptrend. But this has the makings for a stronger corrective move because all of these indicators are in line.
But if I wasn’t looking at the T cross long and all I was doing was looking at the Neural Index and the predicted high and predicted low, I would be looking at 30% of what the VantagePoint software offers to me. And again, for educational purposes only that’s why this is discussed. And that’s why it’s a weekly outlook, not a daily outlook because people are getting far too caught up with the media, with intraday trading, and they’re not seeing the forest because of the trees. It’s always good to take a step back either way. You’re never going to get every trade right. There is no holy grail out there that’s 100% correct. But we can as speculators, we’re all speculators in the financial markets, including the banks, so we try and get as much of the speculation out of it as possible by connecting these powerful indicators.
Bitcoin
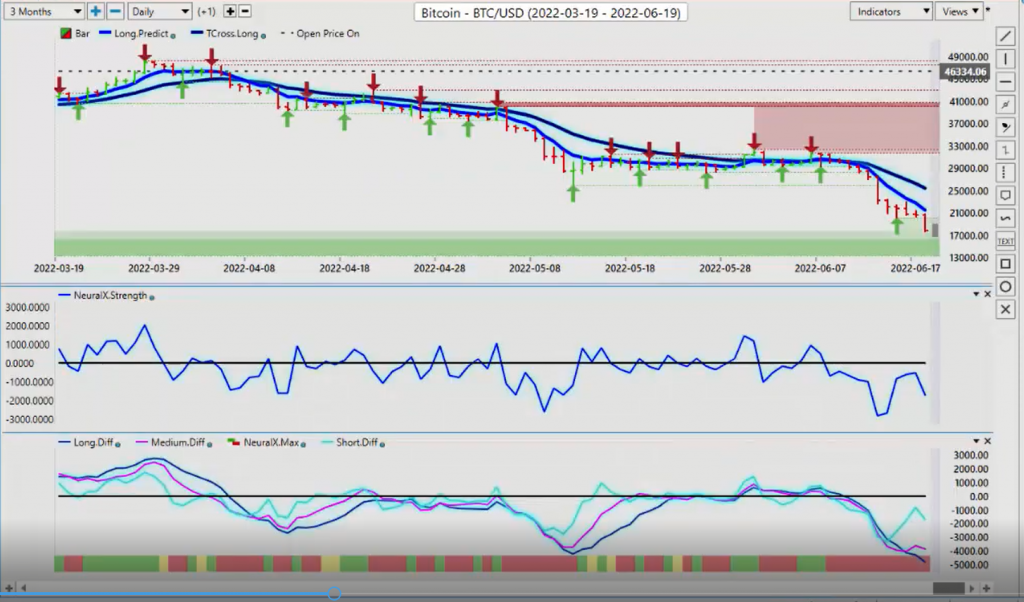
Now, Bitcoin, again, you’re getting a lot of jawboning on this. Even this morning, Sunday morning here in Canada, news stations are going on and on and on about Bitcoin. Yes, it is down. It’s down like the stock markets are down. Bitcoin has about a 90% correlation to the NASDAQ, to the S&P 500. Could this be a leading indicator that the stocks are in for even more trouble? Yes, of course, it could. But once again, if we look at this and we bring in pattern recognition or you can call it seasonalities, whatever you prefer, then we see that Bitcoin is normally down. As I’ve said over the last two months, I’ve been saying this, that Bitcoin is normally down until July anyway. That’s the seasonal pattern, right? So I believe that if at any point the stock market can turn around, which could be as early as the end of this month, or maybe even next week, then Bitcoin can turn around also.
But don’t forget, guys, that while they’re bashing it again now, over the last 10 years the annualized returns is about, 240% is the annualized returns on Bitcoin. The second-best investment is the NASDAQ at about 28%, but that’s a far cry from 240. So again, I will update everybody as we go along. And again, for educational purposes I’m pointing this out that this move lower is something I’ve seen in most years with Bitcoin. So again, keep that in mind.
Euro versus U.S. Dollar
Now, as we turn to some of the main Forex pairs, once again, as I had discussed last week, I identified the support level using the verified zones, 1.0350. I had stated very clearly that I don’t believe that the Dollar Index will hold above 105 and it didn’t. So if the Dollar Index cannot hold above a critical level, then places you would look immediately, I think, I believe I used the word fire sale last week, and I used it in the VantagePoint Live Training Room, which I would encourage people to have a look at, to come in and visit the room even on a trial basis so we can do even more advanced strategies because I only have so much time in here in the Weekly Outlook.
But if we look at this, again when the Dollar Index failed above 105, the Euro immediately recovered. But once again, guys, we look at this not just using the predicted high and predicted low and the Neural Index. That’s not a strategy that I’ve ever taught or I’ve even suggested on this Weekly Outlook. And I’ve been doing it for almost 10 years. So again, I’ll do it slowly again so people like Mark can grasp this because I keep getting some of these… The comment section is there. And I really enjoy talking on the comment section with Sam and some of the other guys. But some of the comments do need to be addressed if they’re categorically false. Right?
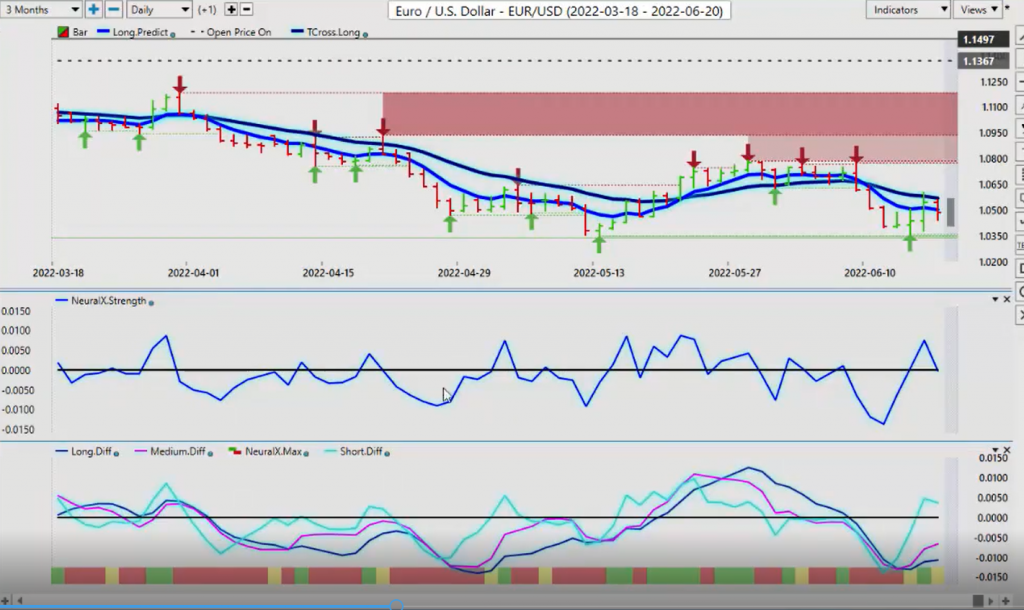
So when we look at this, once again, like the Dollar Index, the Euro has come right up to the VantagePoint T cross long. It has hit that to the number and failed and fallen off of this. So if we look at this to start the week, we identify the T cross long is 1.0570. The Neural Index is yellow, meaning what? If you look at a traffic sign, what does yellow mean? It means caution, right? So we are cautious on this.
But in order for the Euro to go higher or to buy the Euro, we have two options. We can look at potential longs in the verified zones, which was obviously very effective last week after the Fed. But the Euro did not break through that key VantagePoint pivot level of the T cross long. So in order for this thing to really get moving, we need to move above this. So what I’ve said many times also in the Live Training Room and on here that using that T cross long can also be used as a straddle point. So we can sell right up into 1.0570, and then we can have a buy limit order or a buy stop ready to go. So we cut the short and go long above 1.06. That’s a reasonable play. This is exactly what happened last month after the Fed. And I said the same thing then, that be careful down here, right?
So is it possible that this same pattern could repeat itself this month? Well, yes, it could. As I had stated, we have a known seasonality in gold. We know that the Euro is correlated to gold. We know that we have a similar pattern here. And we know we have a very confused and conflicted Fed as to what his plan is. Again, I’m not going to spend a lot of time on that. I think I would encourage everybody to watch if there’s a video of it. I don’t know really what he’s saying. We’re hiking for sure, but maybe not. It’s data dependent. We’re hiking for sure, but maybe not. We don’t know. Could be 25. Could be 50, 75. I don’t know. He was all over the map. You know?
So at any rate, you can see we’ve got a reverse check mark in the Euro/U.S. But again, the MA diff cross, as I stated crystal clear in last week’s Weekly Outlook, that that signal is very seldomly wrong. It was right yet again. But this is a corrective move higher because the primary trend, we’re below the yearly opening price, we’re below the T cross long, so when the Neural Index turns red and you’re close to either the long predicted or the T cross long, those are used as pivot levels to short. So again, as long as we’re holding below 1.0570 and closing below 1.0570, there’s still a slight bias to the downside. But I would straddle this. And again, giving something to the bulls and giving something to the bears. The bulls, you just have your limit orders ready to go. I would argue above 1.0590, 1.06. We get up above that, we close above that, then we could move considerably higher.
U.S. Dollar versus Swiss Franc
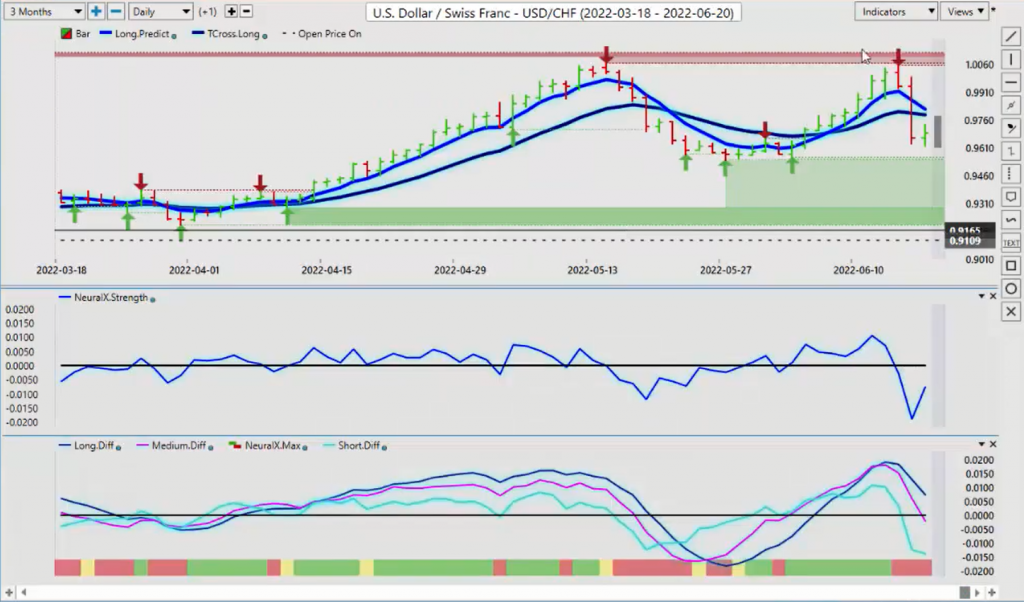
Now Swiss National Bank, once again a bit of a shocker they raised 50 basis points. But they did. And it is the winds of change were coming here because the Swiss National Bank has done a lot of things to protect their currency, to shrink, keep their currency weak. So again, that was way too much. Even with a 75 basis point hike, the dollar got killed here. When the Dollar Index dropped, U.S./Swiss franc dropped. But the MA diff cross, once again I will point this out. This is the two medium-and-long-term crossovers. They already warned us this was coming. That’s why I stated in last week’s video Weekly Outlook that if the Dollar Index drops, this pair will go with it. So it did.
But once again, we’ve got verified support down here. I would anticipate that this is going to be challenged because, again, the Swiss currency is also a safe haven currency. So if those stocks continue to collapse, that will again, that could definitely strengthen the U.S. dollar, but at the same time it would strengthen the Swiss franc. So be very careful with this one. But for now, it would suggest that we still have further downside.
British Pound versus U.S. Dollar
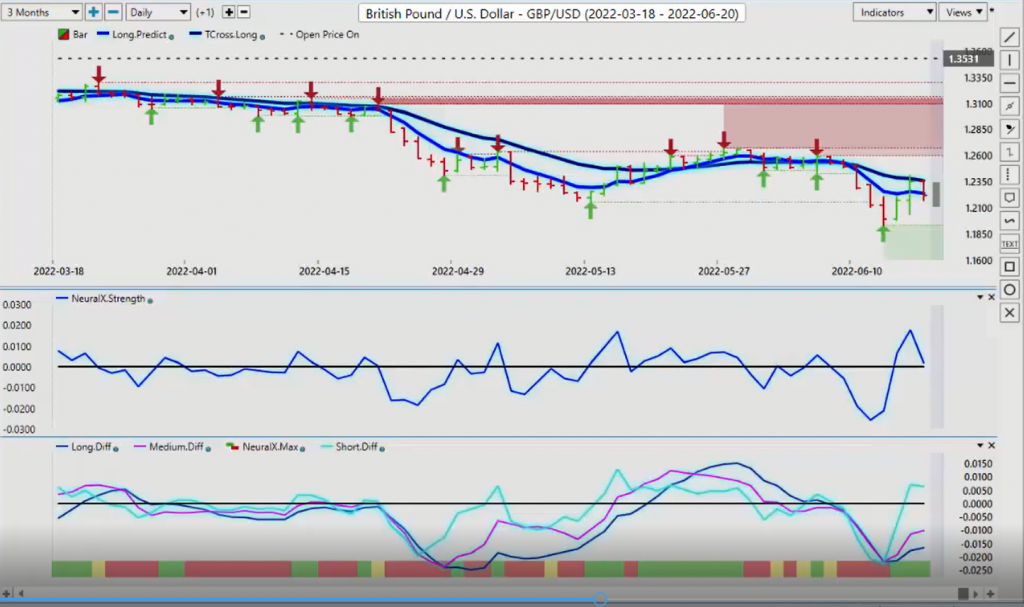
Now, the British pound, as I stated, again, last week, that to begin the week, that we’ve got further downside. But once again, we’ve got our MA diff cross. Now, in this particular case, once again we’ve got a green Neural Index. The MA diff cross, the Neural Index Strength is rising after we had a failure after a breakout point. In my opinion, the pound/dollar was grossly over, that was an exaggerated move last week on some of the Brexit news, the Bank of England. So the Bank of England hikes less than everybody else at 25 basis points and their currency goes up.
But once again, let me be clear about this, guys. You can see that the Neural Index is green for Thursday and Friday trading. The reason the pound/dollar did not move higher, as I’ve said many times, is the Neural Index does not determine this, does not solely determine this. The primary trend on the pound/dollar is down. We’re below the yearly opening price, and we’re below the T cross long. We came all the way back up, hit the T cross long. So as I’ve said on here before many times for the person that’s focusing on what I’m saying and understanding what I’m saying is the reason it can’t move higher is because it’s all tangled up in the T cross long.
So again, in order for the pound/dollar to break out to the upside, we must get above this. We must close above 1.2363. So again, I’m going to highlight this so people can see it and understand it. I think the majority of people do understand what I’m saying. There are just a couple of bizarre comments on the section there that absolutely need to be addressed. Because, again, this is a weekly outlook, guys. I’m not really even talking about the predicted high and predicted low, to be honest.
But if we look at it from this particular standpoint for Monday, you’ve got a green Neural Index. There’s your predicted high for Monday, which is 1.2335. Okay? So in this particular situation, then shorts would still be viable even though the Neural Index is green as long as we’re holding, but a premium short. And then once again, this is easy, you can straddle the T cross long by having a buy limit order ready to go, say, just above 1.24, 1.2380, something along that line. But we need to close above this level two days in a row in order to take the pressure off the downside.
U.S. Dollar versus Japanese Yen
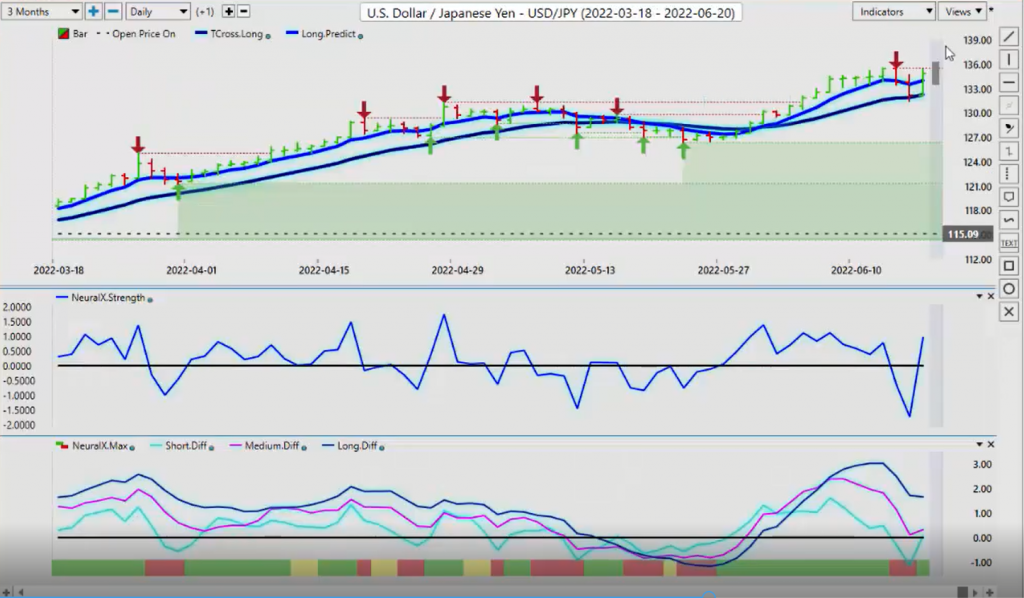
Now, as we move into the dollar/yen, once again, as per the Weekly Outlook last week, I’m just doing this week’s Weekly Outlook and doing a recap as a reminder for certain people as to what actually happened last week. So once again, when we look at the dollar/yen, just give me one moment here while I find it here. Where are we? There we are right there. So let me bring this up. So again, last week I had talked about the dollar/yen, and I had stated we have very stiff resistance up here and we are likely getting ready to retrace back down.
So once again, this still points towards dollar strength against some of these pairs and maybe in the Dollar Index itself too. We’ve come all the way back down, hit the T cross long, and then bounced out of there. So if the Neural Index is red or green, then that is secondary in nature. The first thing we do is determine the trend. So clearly, the trend is up. We’re above the yearly opening price at 115. We’re above the T cross long. So we came all the way down on Thursday, hit the VantagePoint T cross long to the number again, and then rallied out of there.
So focusing on only the Neural Index and the predicted high and predicted low, that would be like, basically, you can’t see the forest because of the trees. The first step in any good trader’s bag or basket is identifying what the primary trend is. So this primary trend is clearly up. So the opportunity to buy off that T cross long on the end of day Thursday or early Friday produced a fairly significant spike. But once again, I believe we are getting a little toppy up here. And if the stock markets really crash, then that’s going to put downward pressure on this pair, on the dollar because the yen also is a safe haven currency.
Now, our predicted differences are rising. Our Neural Index is up. But you can see, to start the week two of the worst trading days in any calendar month or any calendar week is Monday and Friday. Be very careful on those two days. And I would even argue late midday, 12 noon on Thursday to start being careful because you have profit-taking. So you’re not looking to take big positions on Monday or on Friday. On Monday. I’ll tell you guys what I tell my own direct clients. Wait for all markets to come in, which would be at the very earliest 8:00 a.m. Eastern Standard Time on Monday. And I usually wait till about 9:00, 9:15 before I take anything.
U.S. Dollar versus Canadian Dollar
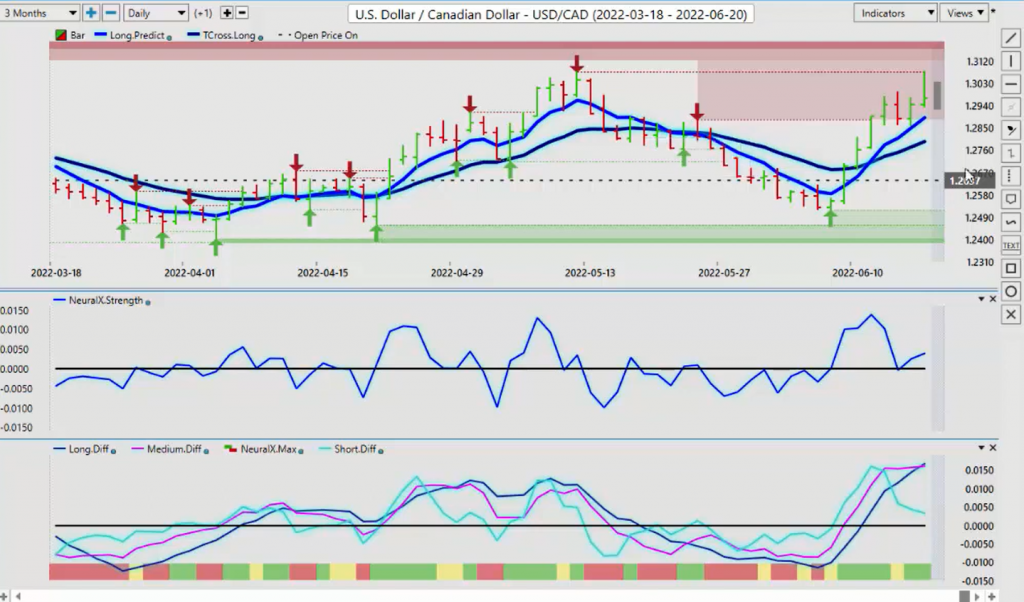
Now, as we look at the U.S./Canada, once again clarification needs to be made on this obviously for certain members of the group in here too. Because what I had said last week was pretty clear, U.S./Canada is moving higher. We already determined that from last week. So what I did was is I identified two potential sell points or areas where this could reverse and more specifically areas of resistance that are going to be problematic. So you can see that we came up to the level I said at 1.2890, got all tangled up in there, dropped down about 50 pips from that one.
But this is the one I talked about in last week’s Weekly Outlook at 1.3076. And I suggested in last week’s Weekly Outlook that it’s unlikely at least for last week that we will breach that. So as you can see, we came up and hit that to the exact number of 1.3076, and then had a significant drop of almost 100 pips. That’s about as easy of a trade you’re going to get. Now, again, somebody complaining about losing money on U.S./Canada, but I can’t even follow the spelling mistakes in the comment, couldn’t even spell my name right. So I don’t know if it’s just a troll or what it is. But these two levels were listed clear as day. No mention was made of the Neural Index. No mention was made of the predicted high or predicted low.
Now, if we look into next week, we have a conflicted signal here. We are above the yearly opening price, and we are above the VantagePoint T cross long. But again, a secondary concern that I’ve already mentioned is that the further we move away from the T cross long at 1.2795, the more likely it is we’re going to retrace to it. Okay? So if that happens, again I could see Monday trying to push above, run some stops above 1.3076 only to reverse on Tuesday or Wednesday.
But oil prices and equities drive the Canadian dollar. If oil recovers and goes back up, if the S&P recovers and goes back up, the Canadian dollar will strengthen, meaning this pair will drop. That is exactly what I said in last week’s video Weekly Outlook, that if after the Fed the stocks can’t hold gains, then U.S./ Canada is going to go up or down. It’s going to follow the S&P 500. You must understand these intermarket correlations, that regardless of what any indicator says, that if stocks reverse and go higher, U.S./Canada will immediately reverse and go lower. But if stocks really crash and oil really crashes, then U.S./Canada will go higher.
But again, we watch these key levels to begin the week. Again, we’ve got a significant gap between the predicted low. And the predicted low is 1.2929. The T cross long is 1.2892. That’s not too bad. But the T cross long 1.2795, that’s a considerable gap from the predicted low. So longs are not attractive to me up here. I need some kind, if nothing else a retracement closer to 1.2795, and then and only then match it to the predicted high and the Neural Index. But again, that MA diff cross, the pink line crossing over the blue line is warning of, if nothing else, a potential retracement.
Australian Dollar versus U.S. Dollar
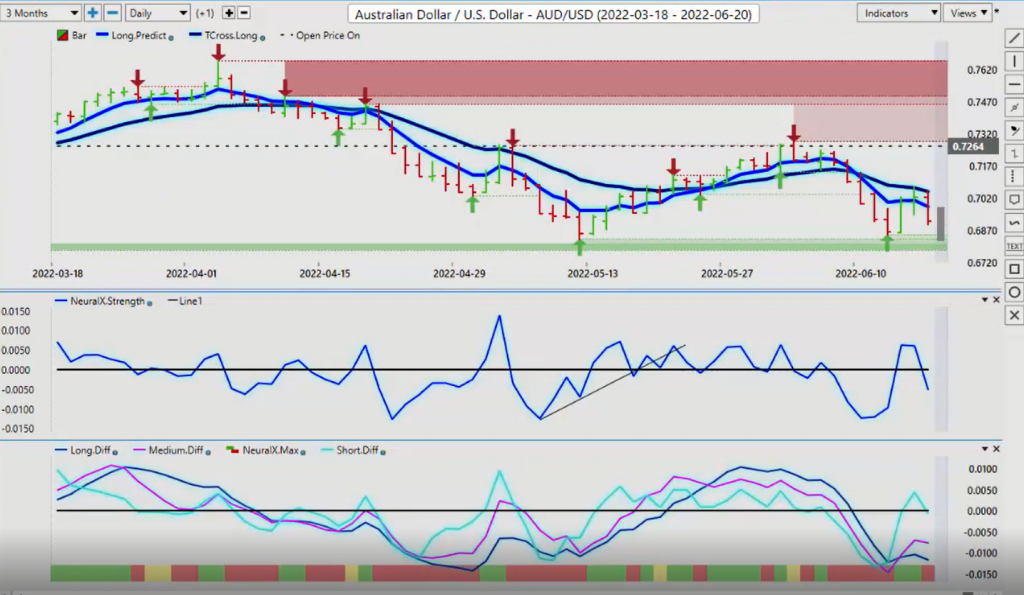
Now, Aussie/U.S., once again I think some real serious clarification needs to be made on this one because it was suggested that what a horrible call VantagePoint made on Friday when that’s just simply not true if you’re following these videos every week because, again, I do the same thing almost every week. The primary trend on the Aussie/U.S. is down. The Neural Index goes from green to red, picking up on short-term intraday strength and weakness. It’s a short-term indicator. So when you apply this methodology and say, okay, well actually the primary trend is down. So the way I would want to trade this is short. So I would look for the Neural Index to match and get as close to either the long predicted or the T cross long as I possibly can.
So once again, you had the fire sale of selling U.S. dollars in this corrective move. But again, there’s no Fibonacci here. There’s no Wave’s. There’s no anything here other than that T cross long. It hits it to the number. The very next day it collapses. But again, I will warn everybody, the purpose of combining these indicators is that that is still saying that we could have some strength in the Aussie. But here’s the deal, guys. The Aussie, the New Zealand, and the CAD, these are equity-based currencies that we work on in the VantagePoint Live Training Room, we work on it in a seminar in Tampa, that it is at the mercy of the S&P 500 regardless of indicators.
If all of a sudden the S&P 500 plummets on Monday, Tuesday, Wednesday of next week, then Aussie/U.S. will absolutely go lower, much lower I might add. But if stocks recover and the dollar sells off, then Aussie/U.S. will, again, attempt to challenge the T cross long. The predicted low for .6826 is the predicted low for Monday. There could be a potential long there, but that would be against the trend. The whole purpose of this session here today is for everybody to know how and learn how to identify the medium-to-longer-term trend using that T cross long. So once again, this is dependent.
New Zealand versus U.S. Dollar
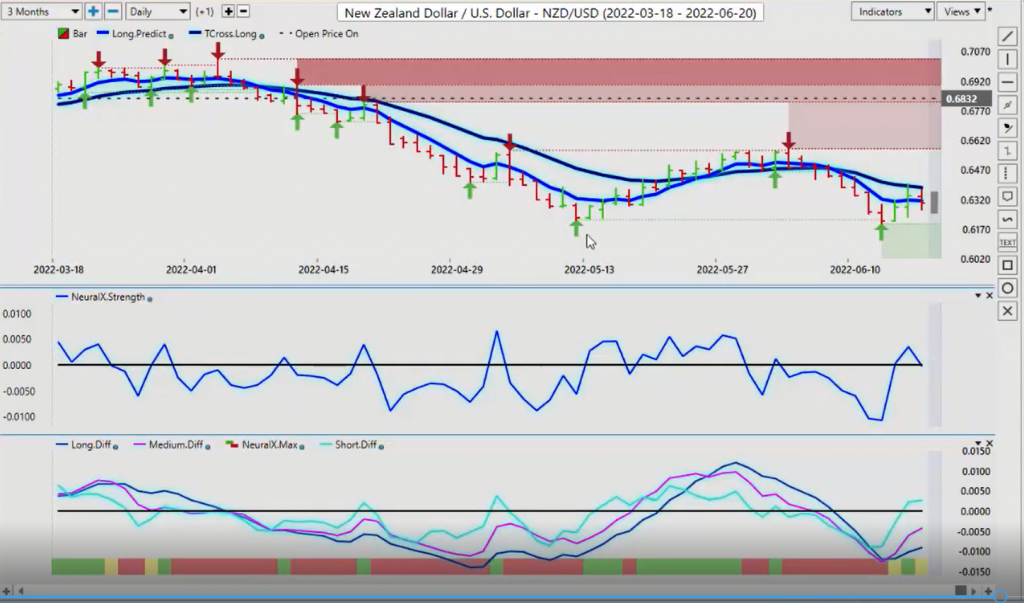
The same exact trade almost is New Zealand/U.S. And as I had stated last week, you got a fire sale here on selling U.S. dollars, at least for last week. But this pair, like all of the other pairs I have shown you, this is what is blocking it from going higher, the T cross long. So when we understand how to first identify the primary trend, then and only then do we work that in. And furthermore, I will further point out this is the most generic, common setup in VantagePoint, the blue line crossing the black line. So to be clear, none of the primary trend indicators in VantagePoint said that the Aussie/U.S. was in an uptrend on Friday. Not one single indicator in here said that. The Neural Index said green, meaning it could have an up day or it’s got a slight bias to the upside.
So it’s Friday trading, guys. Friday trading is like Monday trading. It can’t be trusted. It’s thin illiquid markets. The big banks aren’t even in there. They’re not taking new positions. So it’s all retail traders. Often, this reverses on Monday. So once again here, guys, this is a weekly outlook here, and the idea is that we use all of the VantagePoint indicators, not just some of them.
So with that said, this is the VantagePoint AI Market Outlook for the week of June 20, 2022


