
VantagePoint AI Market Outlook for the Week of June 22, 2020
VIDEO TRANSCRIPT
U.S Dollar Index
Hello everyone and welcome back. My name is Greg Firman, and this is the VantagePoint AI Market Outlook for the week of June the 22nd, 2020. Now to get started this week, we’re going to begin where we always do, with that very important US dollar index. Now, as we can assess here, the dollar is starting to rise off of the verified support level. However, we are sitting at a major resistance level to VantagePoint T cross long, which is coming in currently at 97.50. So if the dollar is going to fail, it’s likely going to be between 97.50 and the 98 level. But when we look at the predicted differences, moving above the zero line with the Neural Index, it looks good for an extension of dollar strength.
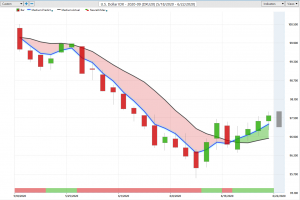
Now, when we back this up and we look at our key pivot area, our long predicted using that predicted moving average is a daily pivot area. We can see that the market is hugging this blue line on a daily basis for about the last three trading sessions. But again, we have a significant level of resistance that again is coming in at around that 97.50. So we need to make a push through this level, if we have any chance at all of getting towards the next high, the swing high at 99.42. But again, the position of the predicted differences, the RSI is showing we’ve got momentum building on the dollar. But in many cases, the dollar often weakens in the third, and just before the fourth week of the month, as we prepare for the beginning of the new month with that known period of dollar strength. So we should expect some dollar weakness at some point this following week.
GOLD
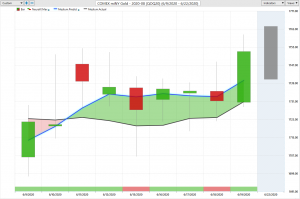
Now with that, gold is rising also, but gold also hitting into a very strong, powerful, verified resistance. Now that resistance is coming in at 1754. We have additional resistance at 1761, but the resistance that I have my eye on for a bigger move on gold is if we can break the 1788 mark. Now, this is going to be a tall order. When we look at this, our medium term is flattening out horizontal. We are above the zero line, but you can see that this pink line is trying to cross back down to the downside. And so we want to be cautious of this. If the dollar rallies further, that could put some unwanted downward pressure on gold. So that inner market correlation needs to be observed. But again, in the current environment that we’re trying to trade in, with COVID, the riots, all these different things, gold and the dollar can move up and down together, but this will not continue, one or the other will likely go higher.
S&P 500 Index
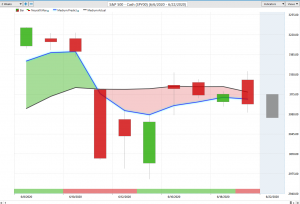
Now with that dollar pressure moving higher and gold also extending, we can further assess that this is putting downward pressure on the equity markets, more specifically the S & P 500. Now it’s a very difficult call here, looking at this. The RSI has stalled right on the 40 level. Now, once again, in a number of the seminars I’ve done, the VantagePoint live trading room, I’ve offered an alternative way to use the RSI that is different than conventional ways. And that manner is that using the overbought and oversold instead of 70 and 30 or 80 and 20, I’ll use a 60/40 split. And I’m looking for momentum to build below 40.
This is a proper way, in my respectful opinion only, to use the RSI as it’s designed, as a momentum indicator. So momentum is building here. We’re below the 50, but we’re not breaking down below the forties. So this has me very cautious about shorts here. We’ve got a very strong, verified support level. That’s coming in at 30.10. We’re closing very close to this level at 30.59, but I would anticipate your order flow traders are going to at least take a shot at longs at this particular level.
Crude Oil
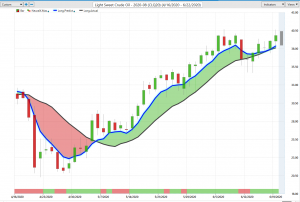
When we see oil, now oil continues to advance surprisingly. So this could be simply profit-taking on the S & P 500 on Friday is what is send it lower because oil is still holding its gains. We’ve got our predicted differences rising above the zero line. The Neural Index is fully supporting this move, as is the predicted RSI. So when we look at this, we also have to further assess that just because we have the blue line crossing the black line does not mean per se, that this is going to keep going.
This swing high, verified resistance at 40.75 is going to be very formable resistance for oil. So we have to take this with a grain of salt and say, “Okay, maybe this is not the best place to be buying oil at this level.” However, if the equity markets continue to move lower, ultimately we’ll drag oil down. But remember, that goes the other way, too. If oil extends higher, that could assist the global equity markets to extend their particular respectful gains.
Bitcoin
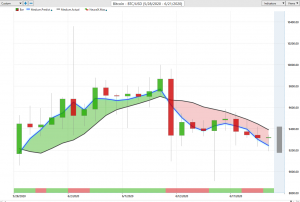
Now again, what I always like to do and work into the outlook for a more complete outlook, is also look at Bitcoin. Bitcoin has again been an excellent investment in 2020, just like it was in 2019. We’re under a little bit of pressure here. That’s indisputable, but we’re continuing to hold here. Our medium term, crossing our longterm predicted difference is warning us, several days in advance, that Bitcoin could be getting ready to turn around. So we want to watch these key levels. Right now, we have resistance on Bitcoin at 9434.
If we click on our F8 and use our blue line only, we can see that we’ve recovered on Friday and we’re challenging the long predicted at 9348. So we want to see if we can break above 9348. If we can, that would suggest that Bitcoin is going to extend its rally. We’ll be waiting for the Neural Index to go from red to green, and we’ll be looking for the RSI to start to turn back up. And again, a simple way of looking at this, guys, is on a break of 9348, Bitcoin is likely to extend. If we can’t get above 9348, then we would see Bitcoin continue to slide down, probably back towards this verified support zone at 8912, which of course we would be waiting for longs.
EURO versus U.S. Dollar
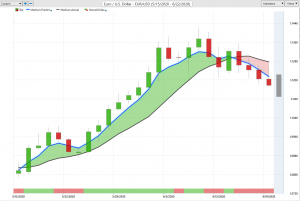
Now with our main Forex pairs, looking at the Euro US, we do have a sell signal forming here. Now it hasn’t completed yet, but we are closing below the T cross long at 111.99. My concern is that we’re doing this on a Friday, and while we’re looking at our predicted differences, they are in the perfect setup for an extension of a further Euro losses. But again, we’ve got to be cautious with this pair because there’s a lot of activity around this 112 level, the yearly opening price, the VantagePoint T cross long, a number of them.
In my respectful opinion, this was the better trade over here. When we started breaking down and we closed below the blue line or the long predicted at 1286, we’ve had multiple opportunities to get short again, looking at how the market responds to the predicted moving average. Every day, it comes up to it, kisses it, and then get slammed lower. So for this coming week, if we break above 112.34 here, guys, and we stay above 112.34, then that would tell me the break to the downside is false. We would want to get long immediately. I will respectfully submit that the likelihood of that is at least 60%, and we would see a reversal probably by mid to the latter part of this week. So keep an eye on the reversal indicators in VantagePoint, because I think there may be something there.
US Dollar versus Swiss Franc
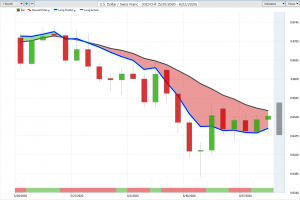
Now, as we look at the US Swiss Franc, the counterpart to Euro US, we can see that I’ve drawn a line here. We’ve got good support building down here. This is coming in at, or about the 94.63 area. So as long as we’re about 94.63, the VantagePoint indicators are actually supporting longs here. We’ve got our RSI that is now extended above the 60 level. Our predicted differences are moving above the zero line and our Neural Indexes turned green. So this also suggests that the equity markets could be getting, more specifically the S & P 500, could be getting ready to turn around.
And this is the way we look at this, guys. This is not a recap of something that already happened. This is an AI weekly outlook of what we’re talking about what is likely going to happen, not something that’s already happened. To be clear, because I often get questions about this. So what we’re doing is we’re looking at identifying critical levels via the VantagePoint software and then playing these levels, using the additional indicators. So right now I know where my resistance is. It’s at the T cross long at 95.76. If I click on my F8, you can see the additional resistance using the long predicted as 95.42. So on a break of 95.42, and a break of this verified resistance zone high of 95.53, we should see this pair start to move towards the high of 96.50. I’ll again respectfully submit, there’s a very strong possibility that this will happen this coming week.
British Pound versus U.S. Dollar
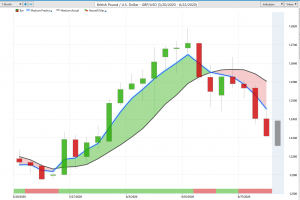
With the pound dollar, the pound dollar also under pressure as the US dollar strengthens across the board against all the major currencies, not just a few, pretty much every one of them. When we look at this breakdown, whenever the market breaks down and we have a two day rule where we close below this level, we immediately look above at the critical VantagePoint level 124.99. That is again, the T cross long and a pivot area to which the market is likely going to come back to. We then transfer that to the blue line by itself and we look at 124.80, so we can pre-identify where the resistance if we’re going to short this pair, that’s the decision we are making, then this is the level we want to focus on.
Our predicted differences are below the zero line. Our Neural Index is down. The position of the RSI is getting a little bit overextended at 18.3, but that doesn’t mean it can’t move lower. I would anticipate we would probably come down and test this low somewhere just below 122, where I would advise that longs are more than reasonable at that particular time as we move towards Wednesday, Thursday, and Friday of this coming week.
U.S. Dollar versus Japanese Yen
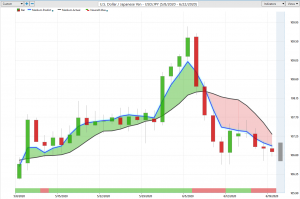
Now with the dollar yen, the dollar yen continues to be unable to break through this verified resistance at or about this high of 107.63, but we’re not breaking down below the verified support level at 106.58. So once again here, guys, if we click on our key pivot area, we know where these levels are. The retracement areas, which have nothing to do with Fibonacci, 107.48 is the level we want to watch. Now we have a medium term crossover taking place, but again, this verified resistance zone is what you need to be very cautious of selling down in this 106.58 or the 105.99 area. So be very cautious down here, particularly when we see a signal like this, one of the most powerful indicators in the VantagePoint software, that’s at least 85% accurate. The pink line crossing the blue line and the Neural Index is in agreement. And we combine that with a verified support level. This is a huge warning sign here, guys, that we potentially are going to fail here.
Now, if we get more news with COVID and all this other stuff, that could send the dollar yen lower, but if you’re trading the dollar yen here, guys, watch gold very carefully at the levels that I discussed. If gold breaks through those levels, then the dollar yen is going lower. But if gold fails at the current level where it is now, under the 1788 mark, then dollar yen is likely getting ready to reverse.
U.S. Dollar versus Canadian Dollar
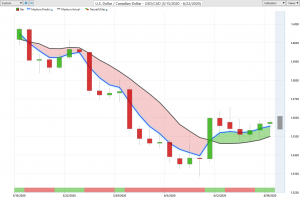
With the US CAD next week, once again, using the powerful daily pivot areas, using the VantagePoint software, we can see that we are continually hitting up against this VantagePoint T cross long, and we are repeatedly failing at this level. Now, what I also will point out to everybody is once again, the medium term crossing the longterm predicted differences, trying to warn us and say, “Look, the medium term trend to the upside is not strong.” So that again tells me that the equity markets could be getting ready to turn back higher on Monday, and oil could extend higher. These are the inner market correlations that we want to watch. So this resistance level is 136.12.
Be very, I’ll warn everybody on here, the same way I do with my own direct clients is be careful with US Canada on Monday. Whatever it does on Monday, it very often does the exact opposite on Tuesday, a fake price on Monday, the real price, Tuesday, Wednesday, Thursday. So again, as long as you know your levels, guys, then you, you can play this. There’s nothing wrong with shorting off the 136.12 area, because there are indicators in the VantagePoint software that are very conflicted. It’s not a clear cut case. This is further warning me, using that T cross long, that again, we simply have no one willing to buy this thing at 136.12, so we can short it and we can play a break. If it breaks above it, then our upside target there is going to be the next verified resistance at 136.85, which is again, very formable resistance.
Australian Dollar versus U.S. Dollar
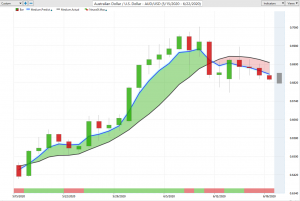
When we look at the US Canada counterparts, so Aussie US and New Zealand US, you can see that as US Canada is pressured to the upside, Aussie US and New Zealand US are pressure to the downside. These are the former commodity currencies that I now call equity currencies because these three currencies follow the S & P 500. If the S & P 500 is going up, the Aussie, New Zealand and CAD are strong. If it’s not, they’re all weak. And that’s what’s happened going into the end of the week. But once again, with the Aussie US, we must break down below 68.28. And guys, we need to close below this level, at least two days, to confirm that we are going lower.
New Zealand Dollar versus U.S. Dollar
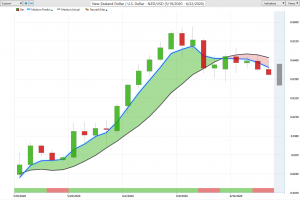
It certainly looks good for shorts, but if we look at the medium term predicted difference in how it’s running flat, completely horizontal for days, that is not indicative of a powerful move to the downside. It’s going to take a big move on the stocks to move the Aussie. Now, it will take the same to move the New Zealand. You can see that it’s the exact same trade here, guys. If we can break below 63.85, close below this level two days in a row, then we could see further downside pressure on the New Zealand, which would indirectly mean further downside pressure on the Aussie and further upside pressure on the CAD. When we know these correlations, then we can trade them. The key thing here, guys, with any type of trading is know your levels.
So with that said, this is the VantagePoint AI Market Outlook for the week of June the 22nd, 2020.
Are you using A.I. yet?