


VantagePoint AI Market Outlook for the Week of March 1, 2021
VIDEO TRANSCRIPT
Hello, everyone and welcome back. My name is Greg Firman and this is the Vantage Point AI Market Outlook for the week of March, the first 2021. Now, to get started this week, we’re going to begin where we always do with that very important US dollar index. Now, increased volatility this past week with the Fed testimony. But again, the market, a lot of market participants falling for this with the dollar, buying into this dollar weakness and some of the gold strength and some of these different things. But when we look at our inner market correlations, these are the driving factors that tell us which way we want to play the dollar, the euro, some of these other currencies, and indirectly, even the S&P 500.
So when we had this big push down on Thursday, what was very interesting at this particular time in live trading conditions is that gold was not moving up on this dollar weakness. The euro had a very large spike, but gold was not going up. Gold was moving down as the euro, US currency pair was going up. This tells us that the move is likely fake; that the banks, as I stated in last week’s weekly outlook, we would probably see this dollar strength towards the end of the week based on real money flows, but the banks need to push the market in a certain direction to get a better price for their clients. When we look at this, indisputably, the Vantage Point verified support zone provided that support that we needed along with the yearly opening price. We’ve come right down to this level. As I’ve stated many times, we must close below the 89 level at least two days in a row.
U.S. Dollar Index
Now, the dollar on the flip side of that coin also needs to now break above this 91 level. You can see we have another verified zone on the upside. The market is trapped between these two verified zones. Again, when we have a verified zone that’s identified by a swing high, two bars to the left and two bars to the right that are lower than that highest point. The same thing on the reverse side.
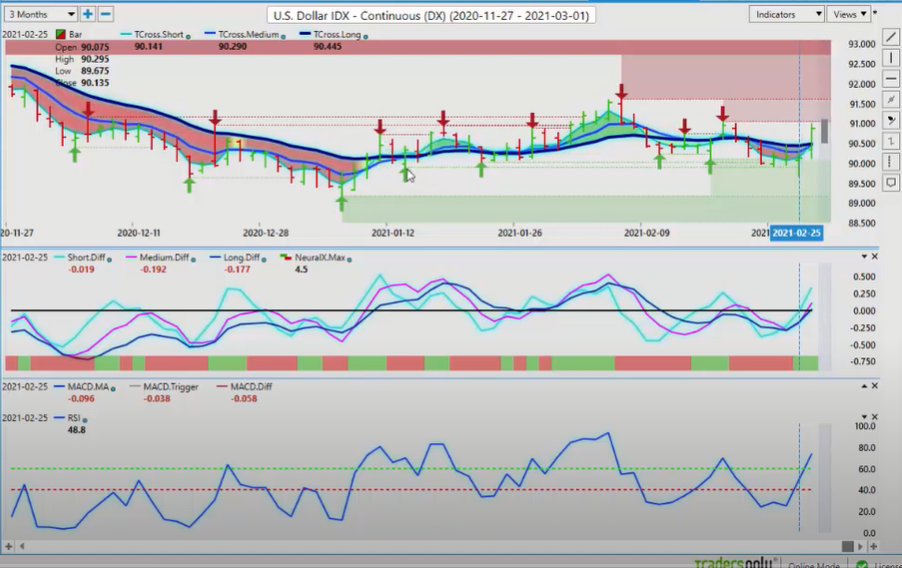
So when we look at this right now, our neural index is up. We’ve got momentum building on dollar longs, medium term crossing our longterm predicted difference. This should see the dollar make further gains as we get into our known period of dollar cycle between the end of the month and up until about the 10th of the new month. I’m not going to split hairs on exact days. I’m just warning you that you have real money flows coming into the dollar as I’ve demonstrated many, many times on here over the years, that it’s usually in that eight to nine day period at the start at the very end of the month into eight or nine, 10 days into the new month, the dollar is usually at its strongest.
Gold
So what they’ve done is they’ve baited the retail traders in to take shorts on the dollar. You’re looking at another lagging report, the Commitment of Traders report. You can see that the dollar longs in there too … or the dollar shorts, excuse me. This is a very, very lagging indicator that we would use. But the inner market correlation to gold, we can see that gold as was forecasted last week, the gold is getting ready for likely a bigger move to the downside as money pours into Bitcoin. We’ll talk about that in a moment but for now, once again, you can see using these predicted differences, this zero line in the Vantage Point software is incredibly important because if we move above that zero line, then there could be life in gold. It did try to push through the Vantage Point T cross long, but ultimately an epic failure. A very, very good short opportunity this past week and, to some degree, going into next week.
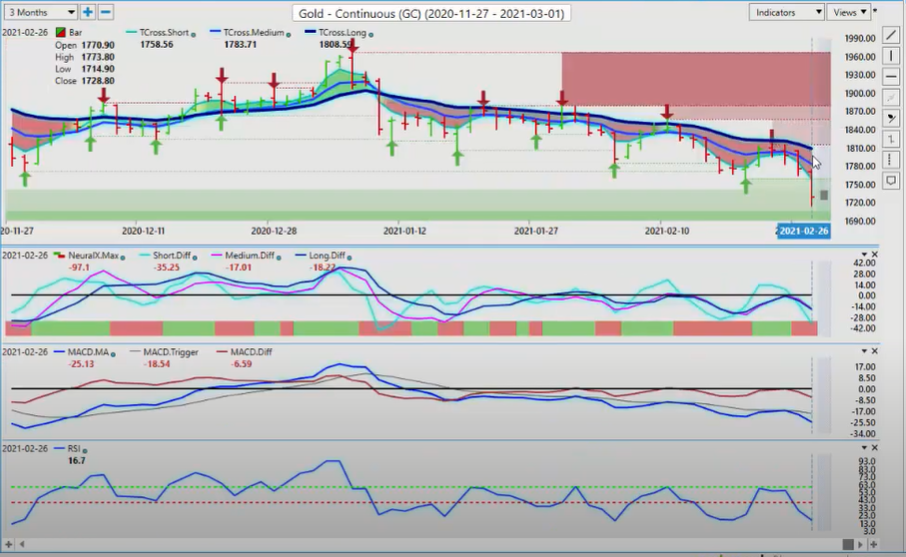
Now, we also want to look again, we want to come out a little bit further here, we don’t want to just rely on that. When we look at these verified zones, there’s more than one. The one that I’ve got my eye on is this one rate. Actually, we’re going to go back just a little bit further, and we’ve got above the 17.06 level. I’m just having a little bit of trouble finding that. Sorry, guys. I think it’s right there. No, that’s … Oh, yes, it is that one right there. When we look at this, the swing low from June 5th, 2020, we are basically on that level right now. But as you can see, if we lose 17.06, we are likely to move down towards the 15-1600 mark, potentially very quickly, especially if Bitcoin recovers. But this zone down here, I would be, I would recommend caution with shorts.
But again, when we look at the dollar index, the fake price that they tried to sell us on dollar weakness, it turned around at the beginning of the month as we anticipated. That put a lot of excessive pressure on gold. When you come out and use the Vantage Point software, these zones go back many, many years, and as you can see, this is why I’m sitting on a bit of a cliffhanger here at 17.06. If we lose that level, then we would be targeting the, again, going back into the April, 2020 low, which was coming in at 16.42. Very, very likely that we’ll be heading in that particular direction.
Now, when we look at one of the other major players here, as you can see Bitcoin is moving up in my books, it’s getting in front of the S&P now, even. We’ve had another big push to the upside this past week, but then we’re failing and coming back down. Now, again, I think it was Berkshire Hathaway had its annual meetings here recently, and the vice chair there, Charles Munger I believe his name is, Buffet’s right-hand man. But they’re saying that the Bitcoin is never going to … They’re still saying the Bitcoin is going to be nothing. They’re not investing in it. I would point out here, guys, that Berkshire Hathaway Buffet and his vice chair, they haven’t beat the S&P 500 in 10 years. If I’m looking at a trade in technology, that’s the last place I would look for advice here.
Bitcoin
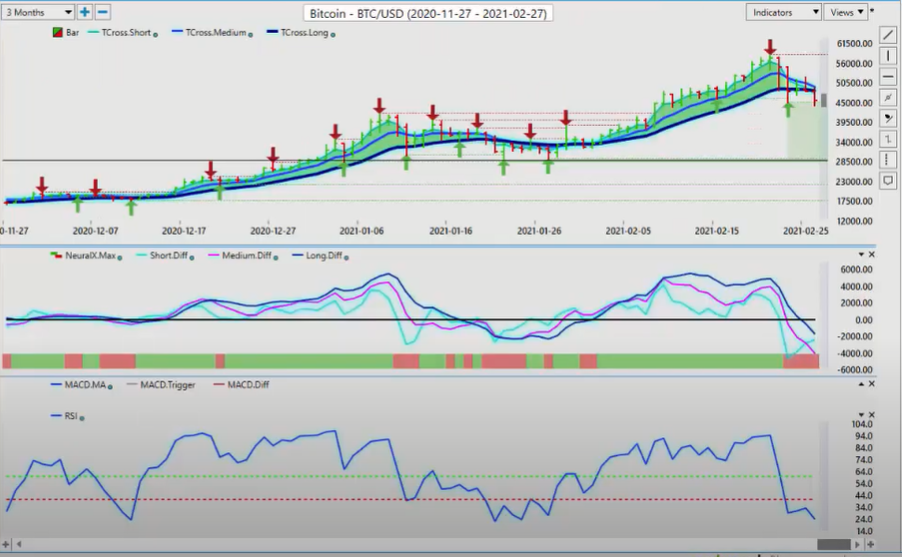
Bitcoin has been a solid investment. Nothing goes straight up and nothing goes straight down. We move back and forth, back and forth. That’s the way trading works. The market’s only trending 20% of the time. 80% it’s back and forth. So we’re coming into a period of known dollar strength. I would strongly recommend that we look for a bottom here on Bitcoin, potentially by the end of next week. It would be yet another terrific buying opportunity in Bitcoin. Again, I’m not going to listen to the Warren Buffets of the world because Buffet said the same thing about the currency market. He then almost bankrupted the company by investing in Caterpillar and some of these Sears Roebuck stocks. Then, he had to officially announce to the world that he’s entering the Forex market. He made a killing in there. He did very well. But he should have seen that in the first place. He’s repeating that mistake, in my respectful opinion only, with Bitcoin. He’s continually bashing it. Again, it’s doubled every year for the last 10 years. What professional investor would not want to look at Bitcoin more seriously?
If we get a recovery in Bitcoin, there’s several other blockchain stocks you can look at. HIV, HUT.TO, there’s numerous other trades that spin off at Bitcoin. So, to ignore that simply would not be wise. We’ll look for Bitcoin to stabilize towards the end of the week when the dollar rally is complete.
S&P 500 Index
Again, when we look at the S&P 500, it’s had a tough week too, but it’s definitely overvalued. But we’re still well within the norms here. Now, we are getting oversold. I don’t ever recommend trading off of oversold or overbought conditions. We’re telling the market to stop at a certain place and turn around. I definitely would not go down that particular road. So when we look at this right now, we don’t have a lot of signs of a turnaround here, but we’ve seen this a lot, the S&P 500 selling off towards the end of the week only to recover by mid to late day Monday or early Tuesday.
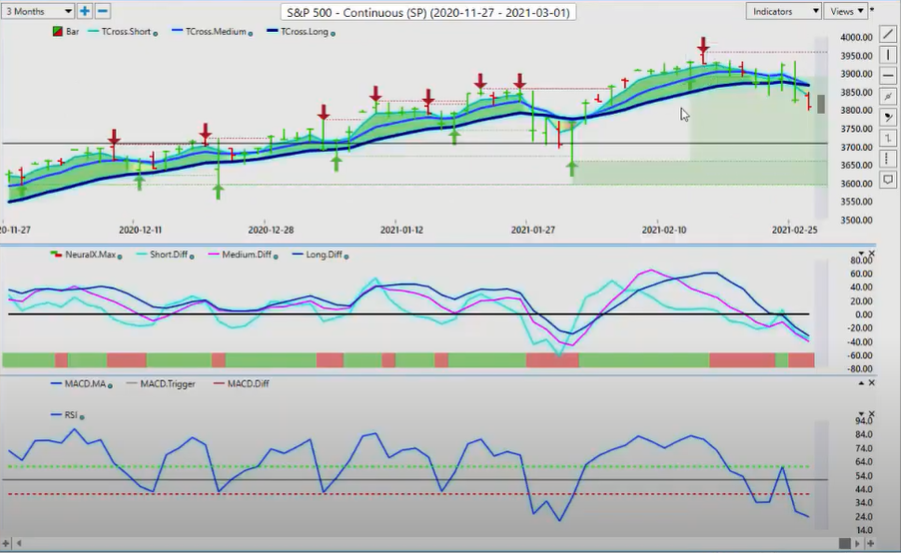
People are nervous right now to hold positions over the weekend but when we look at this right now, we can see the vantage point level we want to watch very closely, which is 38.67. When we click on our F8 in our software, we can see our intraday pivot area or a long predicted 38.63. Now, again, just coming back to gold briefly, we look at that same pivot area. That pivot area has absolutely zero lag. If we click on our F8 and gold, we can also see the same thing. We cannot hold above this predicted moving average. This has the correlation of 31 other markets. This level is very important that the market holds above it, but if it can’t get above it, it’s a very easy sell. So you can see gold struggling along here, just like the S&P 500. Then, it turns ultimately. It turns down. So, we’ve closed two days below the blue line, but we need to hold below this. To start the week 38.63 is the level you want to keep a very, very close eye on.
Crude Oil
Now, as we look at oil going into this week, oil is getting another boost here, pushing it, still pushing it higher, which is a little perplexing here in my respectful opinion. But it could be a leading indicator to tell us that the move on the S&P 500 is simply corrective in nature. There’s at least a 60% probability that that is the case. We would need oil to push below 59.43 to confirm a longer term short on the S&P 500. The level you want to watch is this one. You bring up your F8, your predicted moving average by itself, and you will get that pivot area, 61.84. This is the level we want to watch, guys. If we continue to hold below this, it will also confirm that we may have a longer term short coming on the S&P 500.
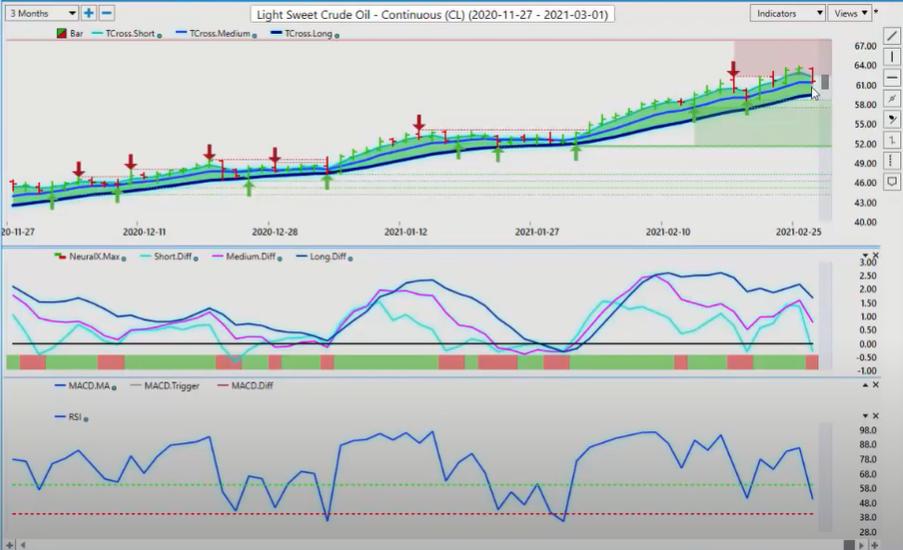
But my optimism on that at the current time remains heavily guarded. We don’t have a lot of downward momentum on the RSI using a 60-40 split and a 50 level here. The 50 level is a key level. We must get below it, but if we have any chance of building momentum on shorts, on the S&P and on oil, oil needs to break down below the 40 level, and at this time, I’m unable to confirm that this is nothing more than a corrective move.
Now, when we look at our currencies, once again, we have discussed this, or I’ve discussed this on here, I don’t hear a lot of analysts discussing it, but the euro, the yearly opening price on the euro currency is about 123.38 … 122.38, excuse me. We put this on the chart the other week.
Euro versus U.S. Dollar
Now, I do this exercise in the live training room all the time here, guys. As you can see, the market came up. When the euro-US pair rallied extensively on Thursday for no real reason, there was a couple of things going on there. The yield on the US 10-year note was going over one and a half percent. The highest it’s been in quite a long time. Gold was still moving lower. These inner market correlations tell me that this is a fake price. Up here, you can see, we have no Fibonacci. There’s no waves up here. There’s no anything up here. It’s just a dark hole up here, but that line is the yearly opening price. The euro-US came right up to the yearly opening price, touched it, and utterly collapsed, and gold was the leading indicator to tell us that that was going to happen.
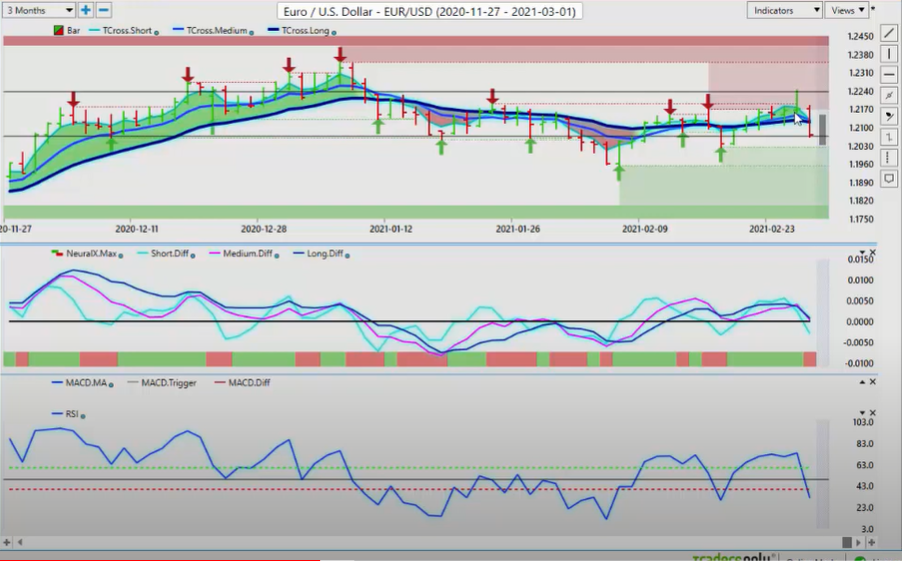
But if the yearly opening price is not on your chart, then you would never have seen that level. Or you wouldn’t even know it because again, there’s no real Fibonacci here. There’s no conventional indicators of any kind. The conventional indicators were actually telling us to continue to go along the euro.
When we click on our F8 to begin the week, we can pinpoint the level that we need to monitor. That’s 121.23. I would expect it will retrace to this level on Monday. Then, that is the area that we would look for continued shorts with making sure that all stops are above 122.40. In my respectful opinion, I would be above 122.70. Give it some breathing room. We’re talking about one 100th of a cent here, guys.
That’s the way we would look at this. The indicators are pointing down. We’ve got momentum on the RSI, but we’re still above that zero line here in the Vantage Point software. Once we get below that zero line and stay below it, we should see the euro probably return under the 120 level barring any kind of interference from the Federal Reserve.
Now, again another place of value to look to buy US dollars at this particular time, little overdone here is the US-Swiss franc; but again, we’ve had and as I’ve talked about for the better part of the calendar year, that we have certain places where we like to buy dollars and certain places we don’t. Places we like to buy dollars are US-Swiss franc, dollar-yen, selling euro-US, and maybe going along, US-Canada.
British Pound versus U.S. Dollar
British pound-US dollar? Hmm, be careful with that one. Aussie-US, New Zealand-US, these are equity-based currencies now so we have to be very cautious. Now, we broke above the swing high, but very often, with a high like this at 90.45 level, usually we put another high-end relatively soon, and then we turn around. The major support level here from Vantage Point is 89.80. When we click on our, again, our F8 in our software, we get an exact level. You can see on Friday, the market came right down to the blue line, the predicted moving average by itself. There’s very little to be confused with this, guys. It’s a very simple strategy. We buy while it’s above, we sell when it’s below, and we can actually straddle that blue line to some degree. But we also use it as a daily intraday pivot to look for long trades or short trades, depending on the other indicators in Vantagepoint. But the indicators and vantage point, the neural index, has been firmly green here.
We’ve got a little bit of a mixed signal there so I would expect a corrective move lower, but not a trend reversal at this time. The US-Swiss franc is firmly above its yearly opening price. We can expect a corrective move. 90.36 is that level we would look for.
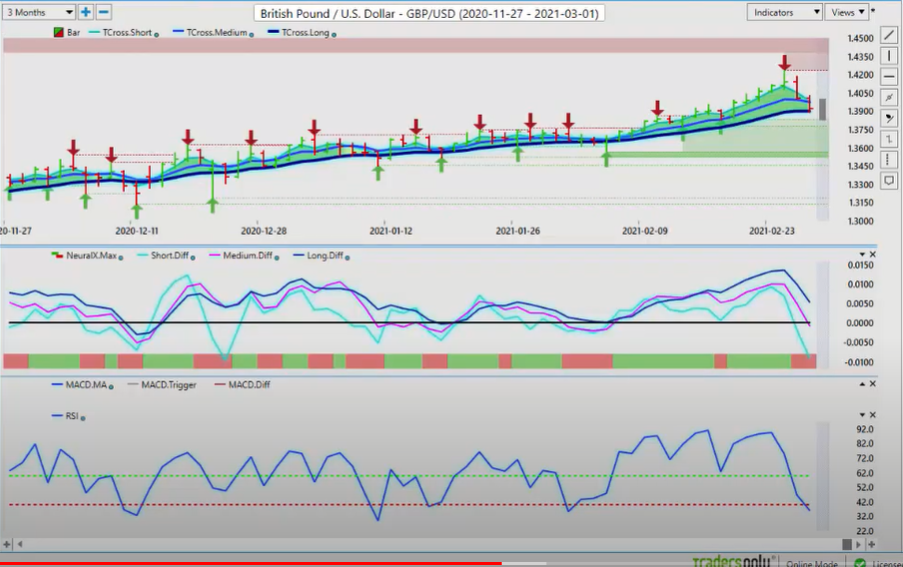
Now, as we look at the pound-dollar going into next week, the pound dollar, we’ve retraced right back to the key vantage point level 1.39. The line in the sand here for the British pound-US dollar is 139. If we break down below that and close below it, we could see a deeper corrective move, but it would still be corrective while above the yearly opening price. When we click on our F8 in our software, you can see that we’ve closed here two days. Well, that one’s a little … Well, actually it did close below the blue line. Then, you can see we closed below it on Friday.
That would tell me that we could very well have an accelerated move right off the open on Sunday night and into Monday trade. Because usually in a scenario like this, when we close below that blue line two days in a row, the third day can be very, very nasty. It’s either going to get back up above this blue line and stay above it and close below it, or it’s going to take a significant move lower. In my respectful opinion, you want to watch the euro-British pound currency pair very, very closely guys. If euro Great Britain gain strength, then that will put additional downward pressure on this particular pair. But for now, the indicators in vantage point are telling us that momentum is building and the pound is likely going to come under selling pressure next week.
U.S. Dollar versus Japanese Yen
Now the dollar-yen, not one of my favorite pairs, but it makes it easier trading it with the vantage point software. These corrective phases that we go into, we’ve had several of them, but you can see with using the verified zones, these arrows are pointing to our resistance points, are moving higher. Our corrective point would be down to 105.35, but once again, the dollar-yen surprisingly is moving up even though the stock market is moving down. That tells me the S&P 500, the downside on the S&P 500, is likely very limited. So our key support level 105.35, but again, clicking on your F8 in your software and using this blue line by itself, it really does provide some fantastic entry points, particularly when you combine it if the predicted low of the day can be close to that.
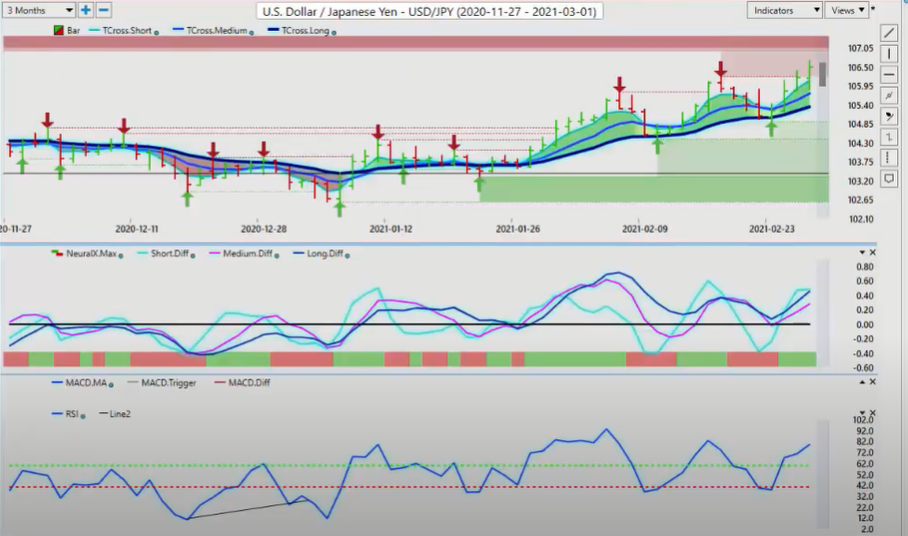
In this scenario, we’ve got the predicted low at 105.95, and then we’ve got our key pivot at 105.86. Somebody had asked me a question about why don’t I use the predicted low in this weekly outlook. That’s because it is a weekly outlook. It’s not a daily outlook. I can only show this bar for one day. I usually don’t talk that much about it, but I will speak to it on this particular case and how I do like to use it when I combine it with that individual blue line or the T-cross long. In this particular setup on Friday, somewhat of a no-brainer long there, and the neural index for firmly in support, predicted MACD is good, RSI above the 60 level. It’s a go, right? That’s the way we would look at this.
U.S. Dollar versus Canadian Dollar
Now, as we move to the three main equity-based currencies, I could likely spend the next 20 minutes talking about these pairs, but these pair can be, are frustrating a lot of people. I’m not going to lie to you, this US-Canada pair has been frustrating me, too. The fundamentals do not support a strong Canadian dollar in any way, shape or form. But the Canadian dollar has latched on to the S&P 500, just like the Aussie and the New Zealand. They are dependent on the S&P 500 recovering. If they do, then the US-Canada will fail at this particular level. But you need to watch the S&P 500. If it continues to sink, then the US=Canadian pair will rightfully move higher here because again, Canada, going back into lockdown, again starting on Monday, things are not going well here. Shortage of vaccines. There’s a whole list of things.
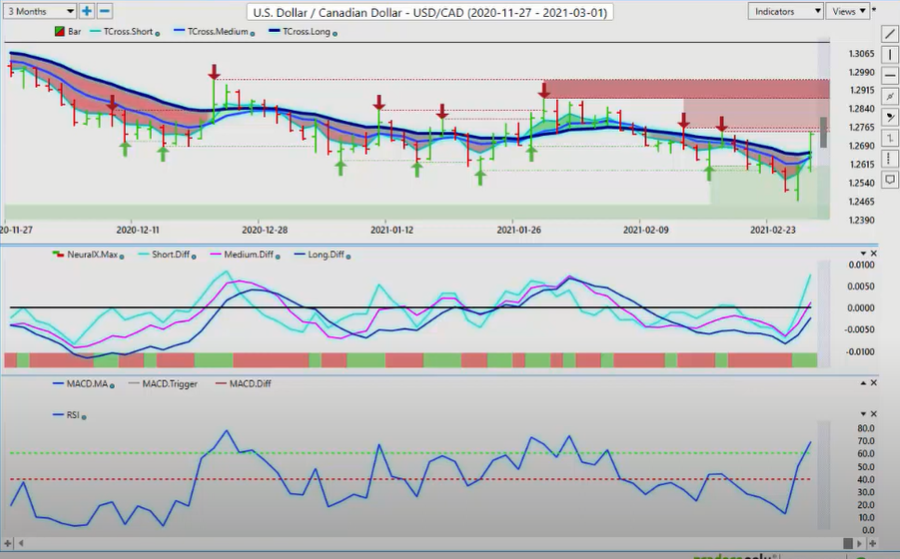
Now, the Canadian dollar is getting a boost from oil prices. That’s a positive, but remember if oil ultimately follows the S&P 500, and they both go down, that is the kiss of death for this particular pair. It will blow through here. A very strong piece of advice I can give you is don’t ever touch the US-Canadian pair until at least 9:30, 10:00 AM, Monday morning. Let all markets come back in and see where we’re at, but there is where our resistance is. We also have, I will further point out here that we have the yearly opening price on the US-Canadian pair sitting at about 127.19. So be very, very cautious in this, in my respectful opinion. This is significant resistance up here.
Now, again, if I click on my F8 and use my predicted moving average, you can see that that pivot area is 126.35. In this case, the predicted low is one 126.83. Your buys zone on US-Canada is between that predicted low and that blue line. That’s the way I would play this. I’m giving it a little bit more advice on how to use that predicted high and predicted low, but again, this is a weekly outlook. That’s why I haven’t spent a lot of time, but to show this at least for one day, or to show you the strategy of how to do that. Then, you can move forward the rest of the week. But if you’ve got a big gap between that predicted moving average pivot area of 126.35 and the predicted low, then if you want to buy this thing, you would target somewhere between those two levels. That’s the way I would play this. But you must watch the S&P 500.
Australian Dollar versus U.S. Dollar
Same deal here with Aussie-US. The Aussie-US is actually sitting on or about its yearly opening price. As you can see, there’s a number of things going on here, guys, that could suggest that that S&P is going to turn back up. If it turns back up on midday Monday, then you want to get long Aussie-US very quickly. Short US-Canada, long New Zealand-US. But again, if the S&P 500 holds below those key vantage point levels, then you’ve got potentially a trend shift here on all three of these equity-based pairs: Aussie-US, New Zealand-US, US-Cad. Right now, the VP level that we want to watch, we broke down below this. Again, you click on your software, you get that T-cross long, 77.
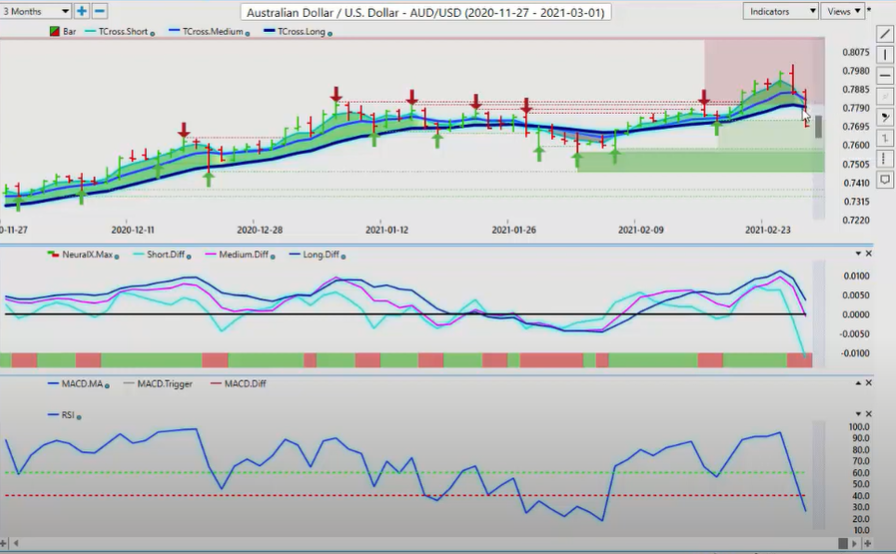
When we click on our F8, we get our additional pivot here and there it is, again. You can see, we close below the blue line, the very next day, it’s just boom, down it goes. There is zero leg in this strategy, guys. Zero. This is why you want to watch that. While at the same time, let me be clear, combining it with the neural index, the predicted MACD or the RSI, or the predicted differences, the predicted differences are in free fall here but they’ve got to get below that zero line. Same deal with New Zealand-US. New Zealand has actually been a little bit stronger than the Aussie and my advice on that is that if you get a bigger sell-off in the S&P 500, the Aussie currency is going to take the brunt of that and so is the Canadian dollar.
New Zealand Dollar versus U.S. Dollar
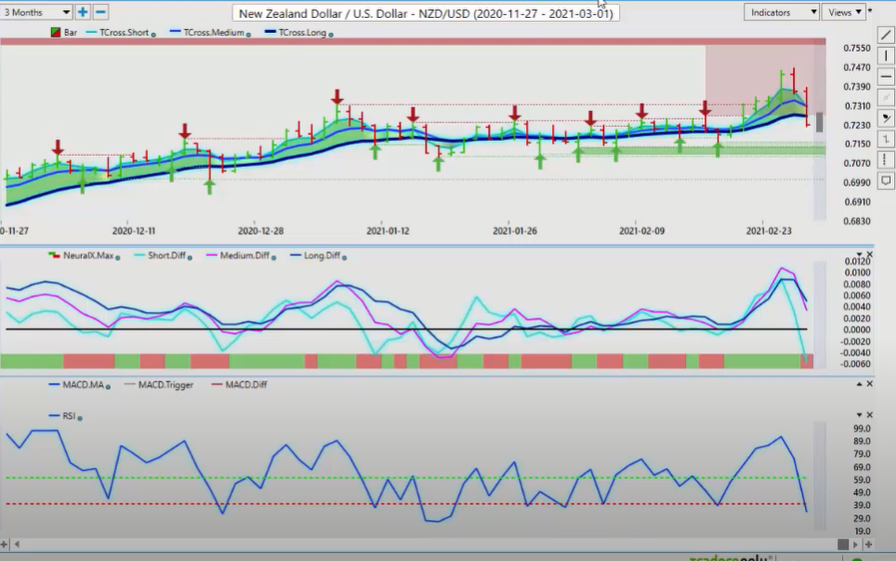
The New Zealand has held up a little bit better here, but it’s under pressure also. There is that [MADIF 00:21:38] cross, our RSI is down, but these types of cliffhanger type signals, I’m usually very wary of. That’s why I’m warning everybody: Keep a very close eye on the S&P 500, because if it continues, if it’s simply a corrective move or profit-taking to finish the week, it will reverse by midday on Monday. With that said, this is the Vantage Point AI market outlook for the week of March, the first, 2021.
Are you using A.I. yet?


