


Welcome to the Artificial Intelligence Outlook for Forex trading.
VIDEO TRANSCRIPT
Okay, hello everyone, and welcome back. My name is Greg Firman, and this is the Vantage Point AI Market Outlook for the week of March 18th, 2024. Now, to get started this week, we’ll begin with the S&P 500, with an accurate measurement of the weekly performance and where the bulk of the trading has occurred, using the Vantage Point indicators.
S&P 500 Index
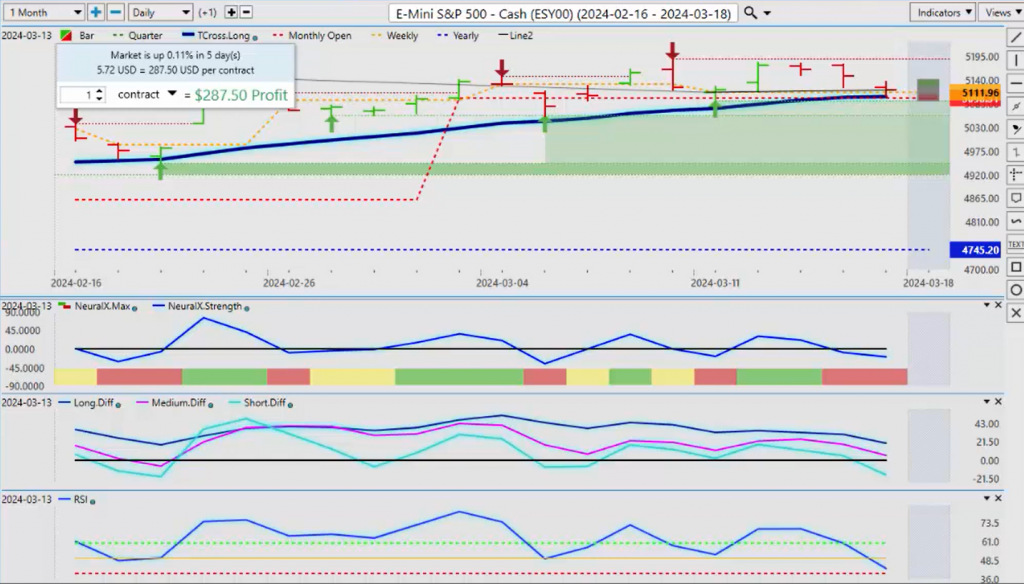
This previous week, we can see we’ve closed last Monday just slightly above the weekly opening price, a very important level on a week-over-week basis. Because again, we see on Tuesday, Wednesday, and Thursday, we have strong buying in the S&P 500, and then we return basically right back to where we started. So, I would expect more of the same this coming week, but it was slightly weaker on the equity side.
Now, when we look at this, we’re above our T Cross Long, we’re above our yearly opening, and our monthly opening prices, and even the weekly for that matter. This is a recurring event, as you can see. This happens in most weeks. If we close below the weekly opening after the close on Monday, the bulk of the week is down. Then, at the end of the week, we get the reversal.
So, for now, our T Cross Long is coming in at 5102, is where we’re going to start the week, but the indicators are turning modestly bearish. Our short-term crossover has occurred, but our medium and long-term crossovers have not, and we don’t have any momentum with a breakdown below that very important 40 level on the predicted RSI.
So again, watch where we finish on Monday. But again, the SPYs is the same, but it’s very, very important that we’re looking at the structure of the market from the start of the week to the end of the week. We don’t want to use a rolling performance of a random 5 days, a random 30 days, or even a random 365 days. We want to look at the structural bias of the market, and the equity markets, at least for now, are still strong. But I do anticipate some further dollar strength before the end of the month.
SPDR SPY ETF ($SPY)
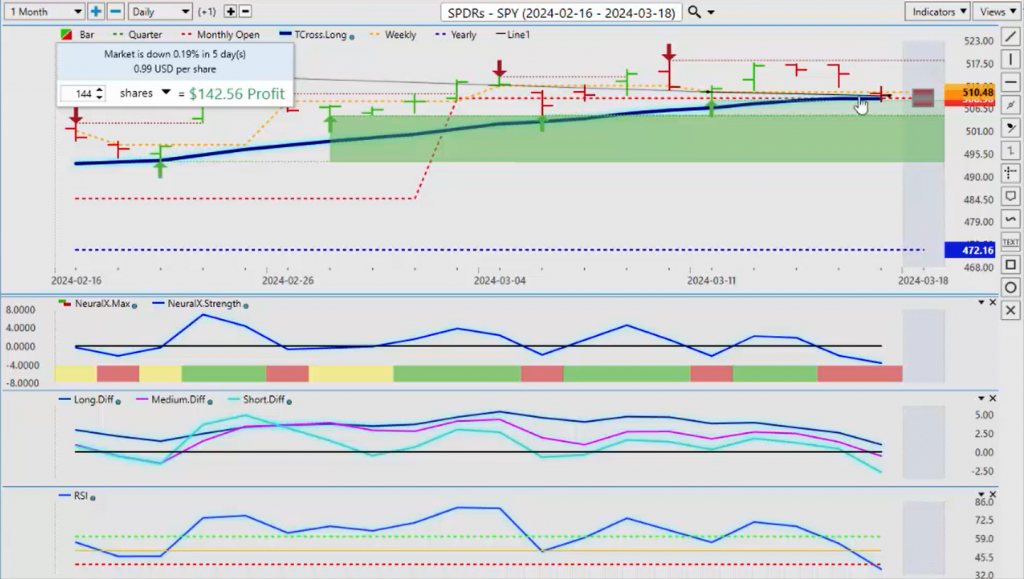
Now, when we look at the SPYs, we see the exact same scenario here. The SPY slightly weaker, down 1.9%, but the S&P 500 again, the market was basically flat or just up a mere 0.11%, but it was not negative on the week, and that’s where I think the confusion comes in when we start moving around our anchor points, and what the true week-over-week performance actually was.
So, with that close on Monday above the weekly opening price, I’m above my T Cross Long, then I’m going to look to buy Tuesday, Wednesday, Thursday this coming week. If we close Monday trading below the weekly opening price, then on we would sell Tuesday, Wednesday, Thursday, and look for the reversal to come around on the Friday. That’s the way we would look at it.
U.S. Dollar Index
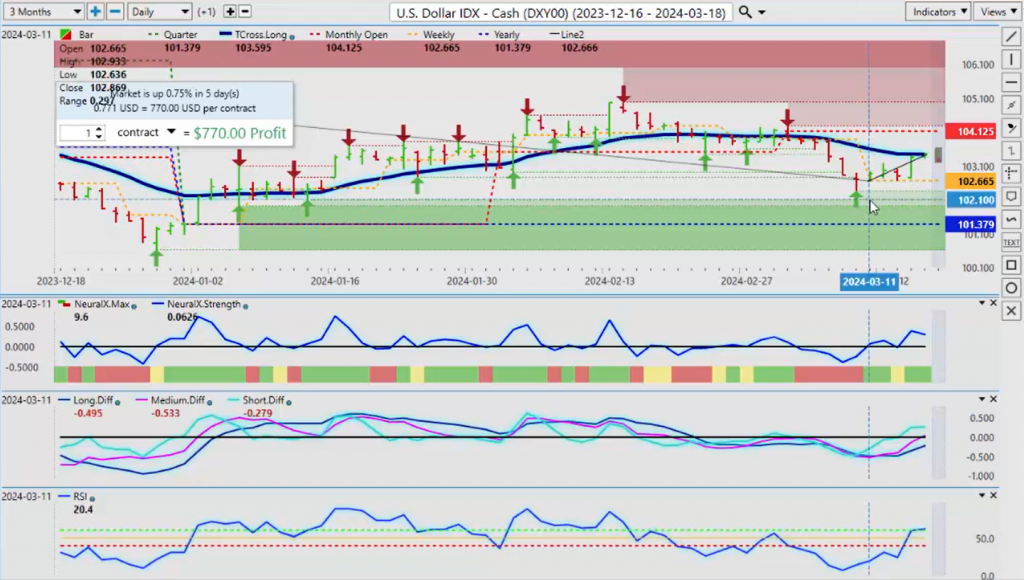
Again, the SPYs look exactly the same thing here, but all eyes have been on the Dollar. So, when we look at the actual performance measurement of the Dollar this past week, it’s actually up .75%. And again, you can see we’ve closed above the weekly opening price on Monday, but we’re below the Vantage Point T Cross Long. So, in actual fact, this is a retracement back to exactly on our T Cross Long.
So, to start the week next week, if we can get above and stay above 10344, and we’re still above that level by mid-early Tuesday trading, then Dollar Longs are still on the table here. The indicators from Vantage Point do support that. We are at 62.1 on the predicted RSI. Our predict… we do have a medium-term crossover because our predicted difference, this pink line, has crossed the zero line.
So, the way we would look at that, if we click on our F7 in our software, we can see that a crossover is trying to take place right at this very time. But we must clear 10344. The actual trend in the Dollar remains to the upside as long as we’re holding positive on the calendar year.
Again, if I move these anchor points around, then we’re not going to see these numbers, and it would be far more difficult to identify what the current actual trend is. The trend is indisputably up on the Dollar until such time as we break down below 101.37. But again, we must clear that T Cross Long in order to remain long because I anticipate Dollar weakness either way, once we get into the earlier part, first second week of April, potentially even by the end of this month.
Gold
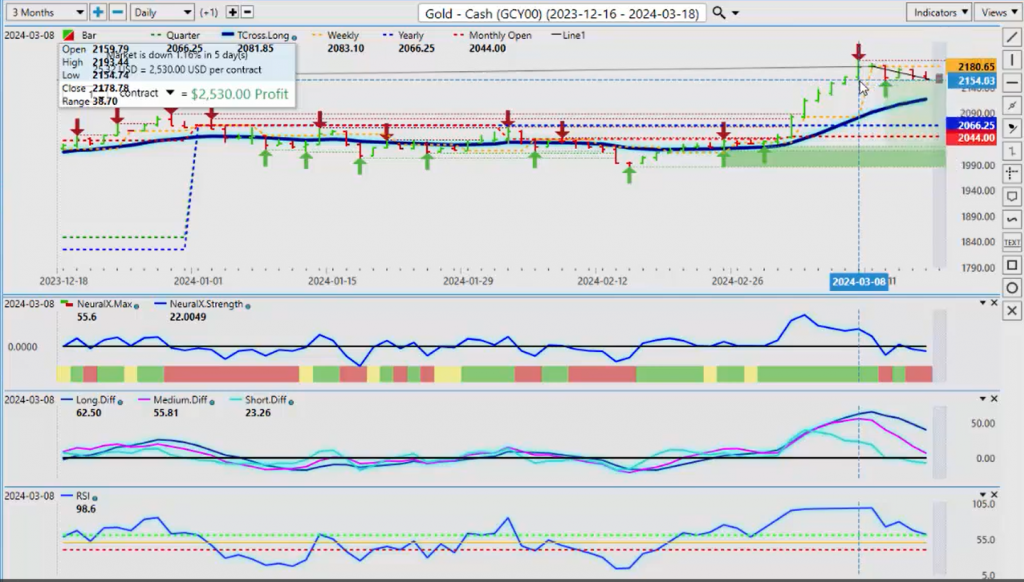
Now, when we look at Gold Contracts, again Gold backing away, and this is a classic retail trader mistake, where they look at conventional tools and look to continue—or not to continue, excuse me—but to get into a trend that’s actually getting ready to turn the other way. This large red area, the verified zone, that was identified when a lot of recommendations were made to continue buying Gold, but there is very significant resistance at this 2192-2193 area now.
So, that’s the area we have to take out. Gold usually does very, very well in March and April, but I suspect that maybe this got a little bit ahead of itself with the FED comments, or the very confusing FED comments from week to week. But the inflation data slightly hotter on the PPI and the CPI this past week. But I will point out that the CPI is a lagging economic indicator. But what the market, I think, is focusing on, is the fact that you’ve got a bit of a base there around 3.7 on that CPI.
But for now, Gold remains in an uptrend as long as we’re above 2066, and our T Cross Long is coming in at 2117. That is the area to watch because I believe Gold will hold its value, but we’ve just got to get through this corrective move lower before the buyers come back in.
Crude Oil
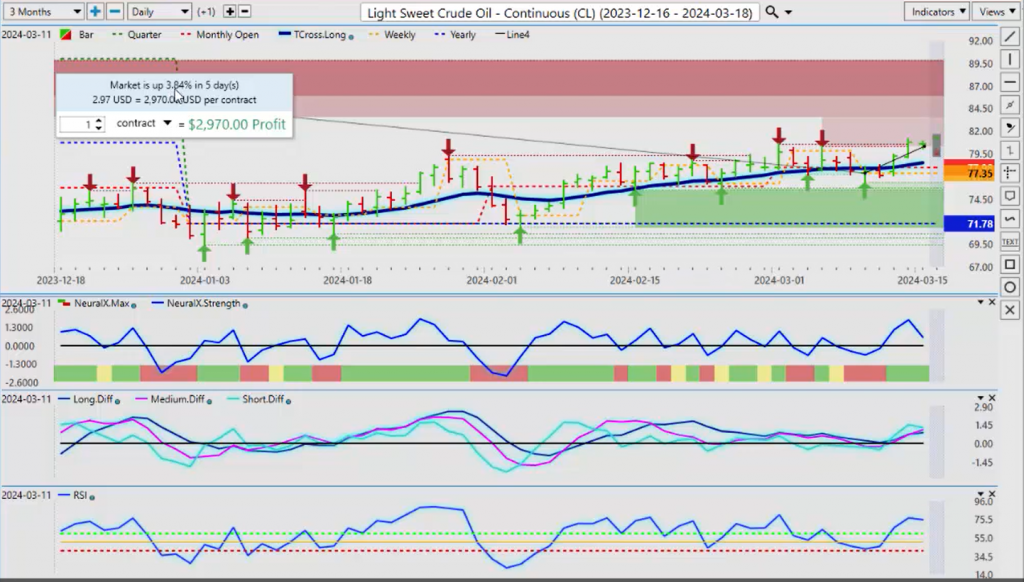
Now, when we look at Light Sweet Crude Oil, this past week, another big winner, 3.84% on the upside for the week. Once again, we can see, and this is a strategy you can replicate very easily. When most people are jumping into the markets on Monday, you may want to just take a step back and let things settle. See where it closes.
So, Oil was definitely a tricky one. We closed at 7748, but as you can see, the weekly opening price is 7735, so we closed just above that, and then that turned into basically a 4-day rally. So, when most people are jumping into the market, sometimes, a lot of times, I would argue, it’s best to just let Monday play out because usually, Monday is just the hangover from whatever happened on Friday. So, keep an eye on that.
But Oil remains bullish while we hold above our T Cross Long at 7847. The indicators here, a little bit mixed, so possibly a slight corrective move lower, but Oil remains firm. But I would like to see us get above this verified resistance high at 8055 and stay above this particular level.
Bitcoin
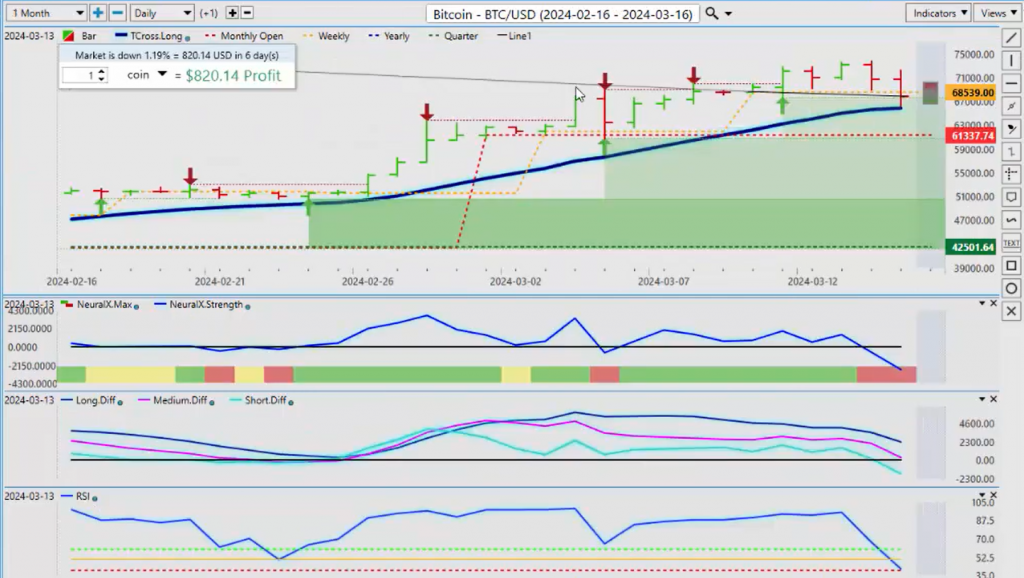
Now, with Bitcoin, once again, when we look at the actual week on Bitcoin, this week actually starts on the previous Saturday, Sunday. So, Bitcoin‘s still, you know, still very strong. It was down 1.19% on the week.
But again, you can see that the bulk of the trading was still to the upside, and it lost its value in the last couple of days. Now, we’ve come down on Friday, kissed the T Cross Long to the number at 65,870. In my respectful opinion only, Bitcoin is a firm buy in a dip while above the T Cross Long. That area, again, 65,870, our monthly opening price at 61,337, and our yearly at 42,0501, anywhere in this area is a buy on this particular asset class. Because again, we’ve got the Bitcoin halving coming up, but that’s irrelevant to what Bitcoin has done over the last 10 years, and with the inception of all the ETFs. Very similar situation to what I saw in 2004 when gold went from about a one or two trillion dollar market cap to 16 trillion when they introduced ETFs. This has recently also just happened with Bitcoin, so we would look for this to actually continue.
DAX
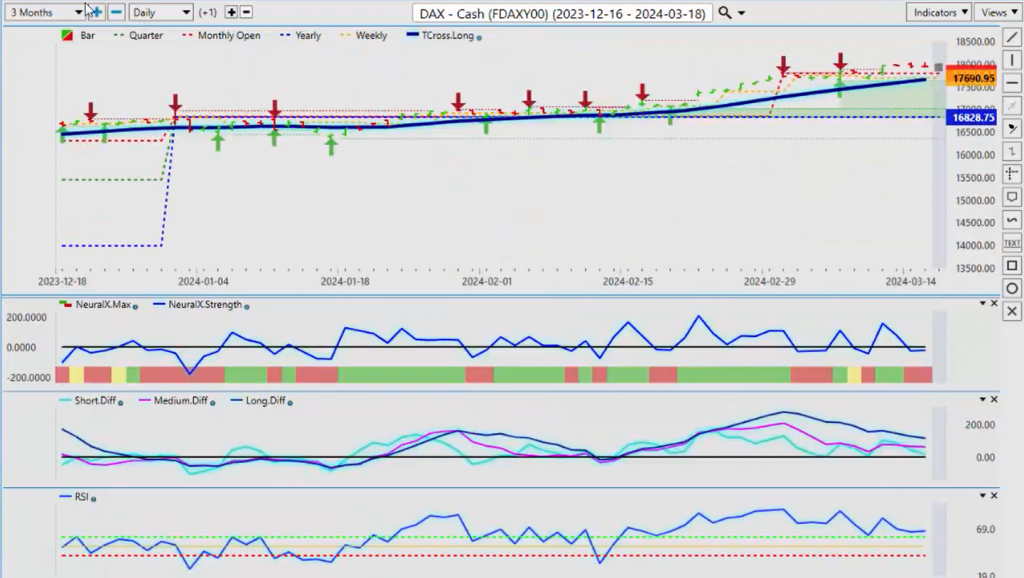
Now, with the European Equity markets, I’ll just focus on the one this week. I think it tells us what we need to know. When we look at this, once again, not a bad… It really does point towards the European Equity markets are stronger, particularly the DAX. So, when we look at the weekly, the accurate weekly performance, not that lagging model over random 5 days, guys, very important that I stress that, so we can assess this, 1.31% the DAX is up. But once again, we’ve got to be a little bit cautious with this because if that S&P turns lower on arguably one of the last bull moves on the dollar, then that could push this down.
Volatility Index ($VIX)
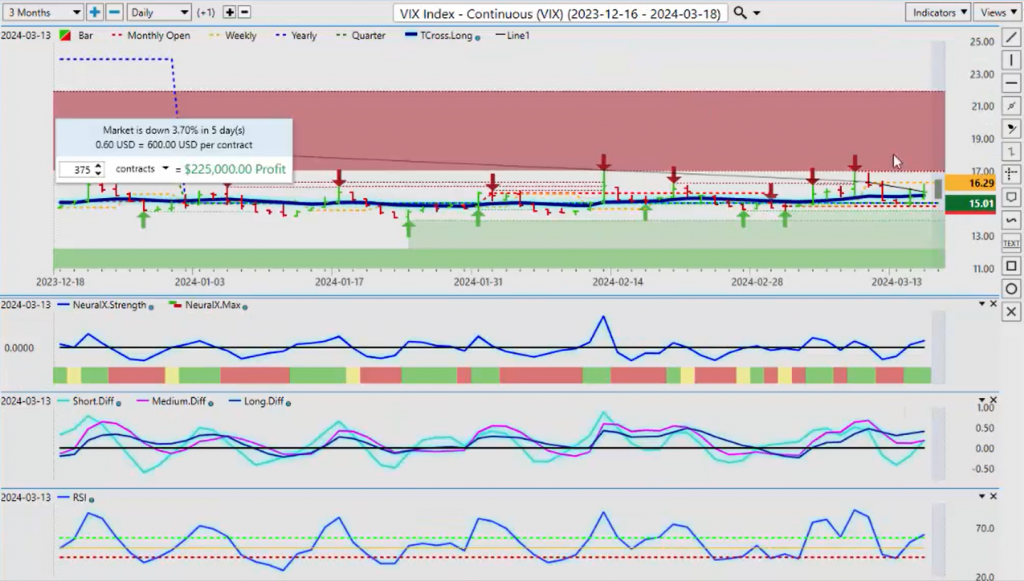
So, the way we would then cross-reference this is actually to the VIX. So again, with the VIX, if we’re looking at this, the VIX has now made a very important move that very few people see. We’ve cleared the yearly opening price, that’s at 15.1. Now, it still had a down week at 3.7%, but I would look for the possibility of this turning around. Because again, getting above and staying above that yearly opening price has been difficult, and we do still have some strong verified resistance. But these indicators are pointing that there could be some momentum building here on the VIX, which would indirectly push the DAX, the S&P 500, the Nikkei, a number of these global indexes, it could push them down. So, we’ll keep a close eye on this, but our T Cross Long at 1551, we are closing slightly above that number, but there are signs of momentum building here. The predicted RSI is now sitting at 63, our neural index strength, and the neural index, but again, the monthly opening and the yearly opening prices, those are the areas you want to watch very, very closely, down around this, I would argue, right down here at approximately the 14.8, 1485 mark, is where I would keep a very, very close eye on this.
Euro versus U.S. Dollar
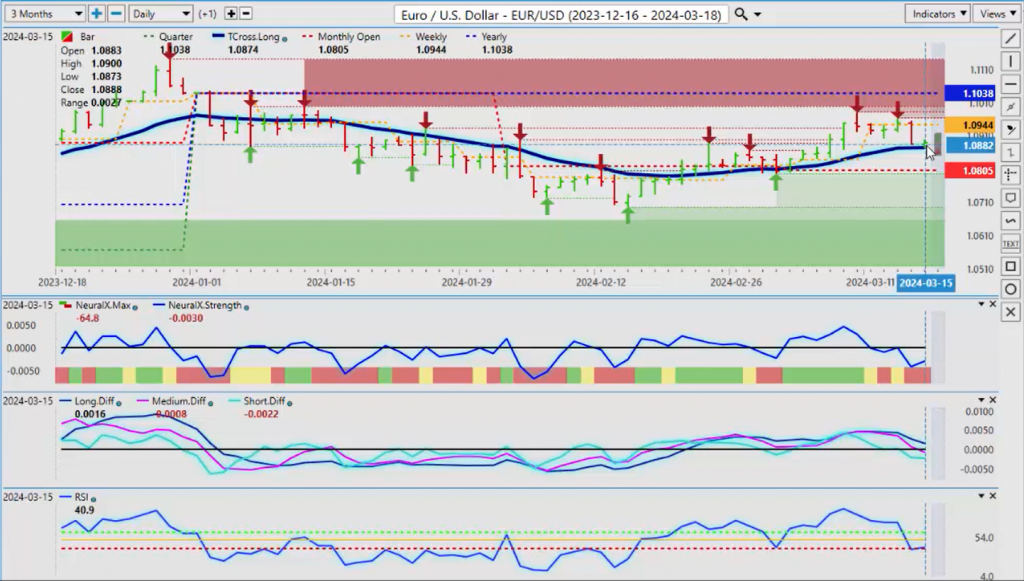
Now, when we look at some of our main Forex pairs for this week, Euro coming under pressure again. You can see that we approach the accurate yearly, the current and accurate yearly opening price. The Euro, again, a number of analysts extremely bullish on this over the last week or two, but they failed to see that we’ve never been positive on the calendar year on the Euro/US pair. So, unless we can get above 1.1038, then there is still a slight bias to the downside. But as you can see, this red area of 1.0805, we have turned positive on the month. So, if we can hold above 1.0805, but the immediate support level which we want to keep our eye on is 1.0874, the Vantage Point T Cross Long. We need to remain above this if this has any chance of challenging 1.1038. But again, we’ll also look for that, the current monthly opening price is very seldomly discussed in the financial world, but it’s very important, guys, because it gives us an objective viewpoint as to who’s in charge here, the buyers or the sellers. Well, in the calendar year, the sellers are in charge, but in the month of March, the buyers are hanging in there. So, we’ve got our sellers up here near the yearly opening, and we’ve got our buyers down here near the monthly opening price. So, that’s basically what you’re dealing with, is a range between 1.1038 and 1.0805. In my respectful opinion only, a break of one of these two levels will trigger a trending move. Right now, this pair is not trending; we’re running sideways between the current monthly and the current yearly opening price.
U.S. Dollar versus Swiss Franc
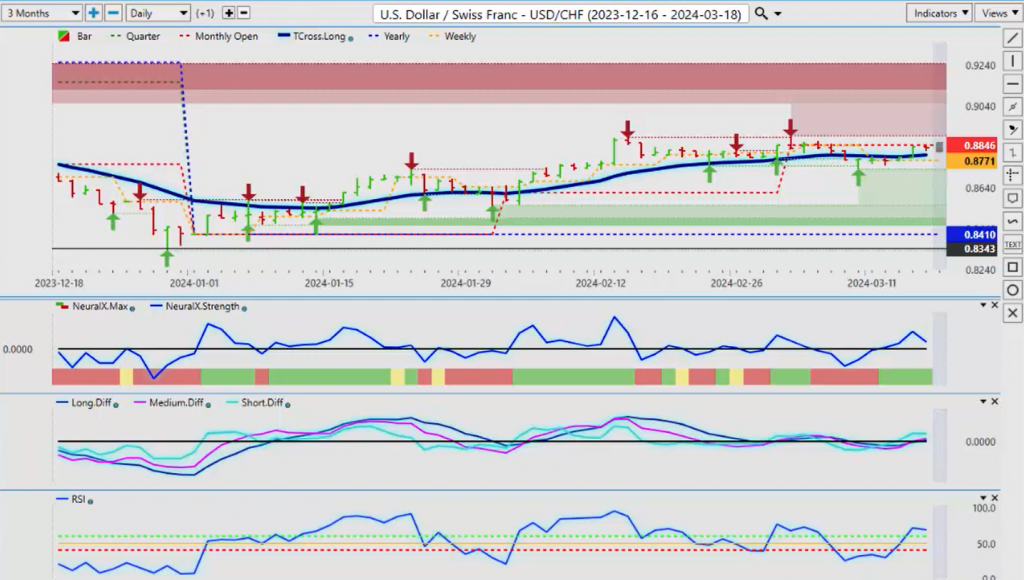
Now, when we look at US/Swiss Franc, again, it’s been a while since the Swiss Franc has seen this kind of weakness against the dollar. But right now, the dollar is unable to push above the current monthly opening price at .8846; that’s the area we want to keep our eye on. But we are still bullish on the year, with that yearly opening at .8410. Our T Cross Long at .88, our indicators here are still showing signs of life with the dollar against the Swiss Franc, with our predicted differences moving above the zero line, neural index positive, a bit of a reverse checkmark there in the predicted RSI, but not too concerned with it. But again, the seasonal pattern in the dollar, usually the dollar strength comes to an end by late March, early April, so be very mindful of that.
British Pound versus U.S. Dollar
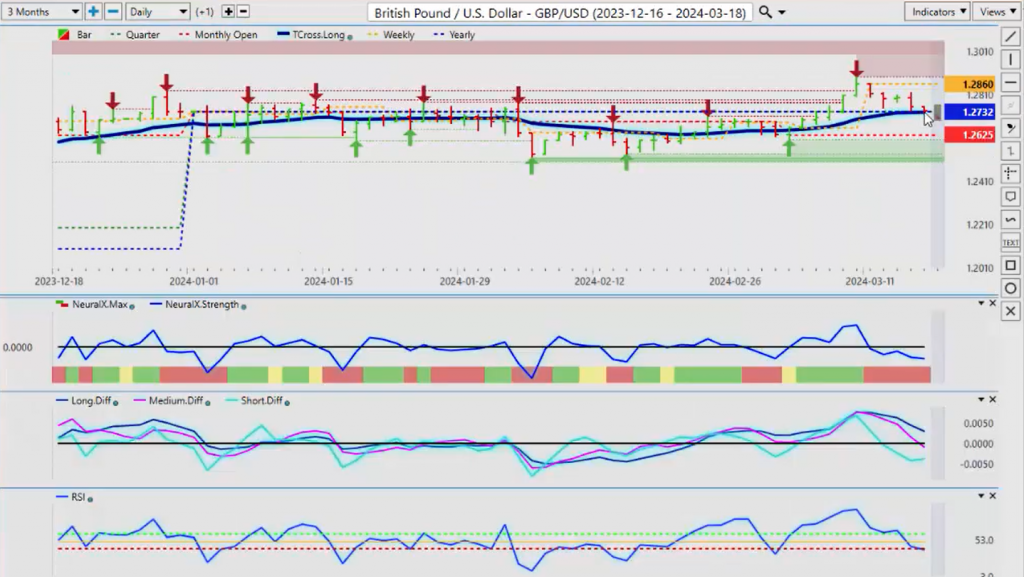
Now, the British Pound/US Dollar tried to recover here on Friday. It didn’t do a horrible job, but at 1.2732, we’ve closed the week at 1.2734, we are on the yearly opening price. So, if the Pound/Dollar right now, we basically got a make-or-break situation with the Pound/Dollar: either it’s going to go higher, or it’s not. So, right now, it is very much this chart is very similar to the Euro/US pair, where above the monthly, but struggling with that yearly opening price. Our T Cross Long at 1.2729, I strongly recommend, as what I’ve stated at the beginning of this presentation, that you let this pair settle until the close on Monday at 5:00 p.m., and see if we’re closing above or below the current weekly opening because that will likely set the tone for the remainder of the week.
The Vantage Point signals are saying that this pair is going to break lower. So, if we’re holding below 1.2729, then we should see shorts, at the very minimum, down to about the 1.26 mark.
U.S. Dollar versus Japanese Yen
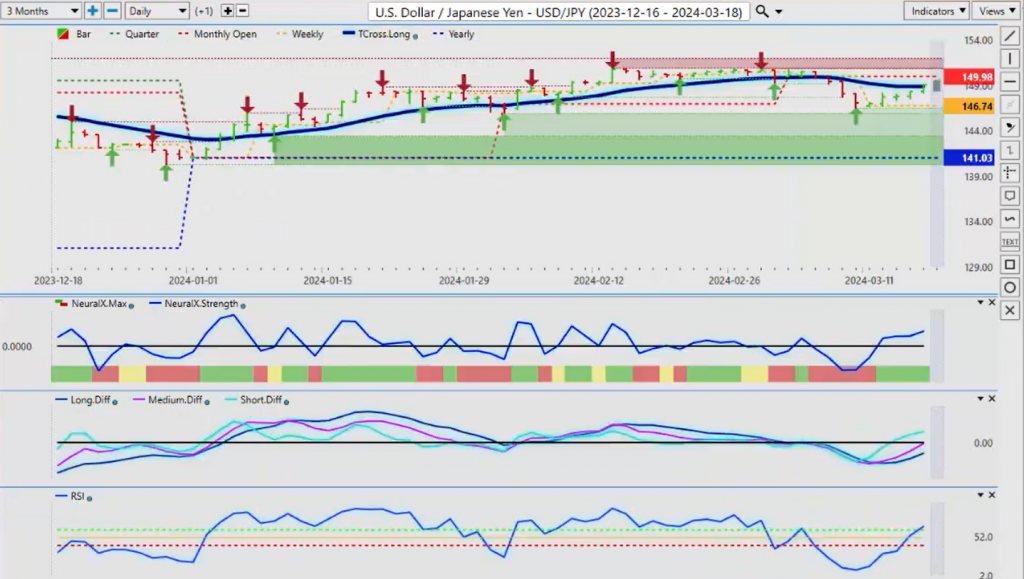
Now, the Dollar/Yen, again, starting to recover. We’re still positive on the year, but we’re getting tangled up in the Vantage Point T Cross Long at 148.87. Then we have our monthly opening price at $149.98. If the market believes the FED will not be able to cut, then the carry trade remains intact, meaning a weaker Yen and a stronger dollar. And that’s also a weaker Yen against the Euro, the CAD, the Swiss Franc, all those other pairs. So, I’ll monitor this, but right now, the indicators in Vantage Point point to further strength.
I will warn every Forex trader out there, every single week, guys, be careful on a Sunday night trading. The Bank of Japan has been on the prowl here for several months, and they’re simply looking to leverage some type of verbal intervention. That spooks me with buying or selling the Yen right now, but we could have some good opportunity once we get confirmation from the FED. And we do have the FED speaking on Wednesday, the press conference. Nobody’s expecting a cut on Wednesday, but we’re looking for verbiage as to when it’s coming, a more definitive answer. Now, with this most recent data, the FED could spin this, saying, nope, too early for a rate cut. If that’s the case, Dollar/Yen goes higher.
U.S. Dollar versus Canadian Dollar
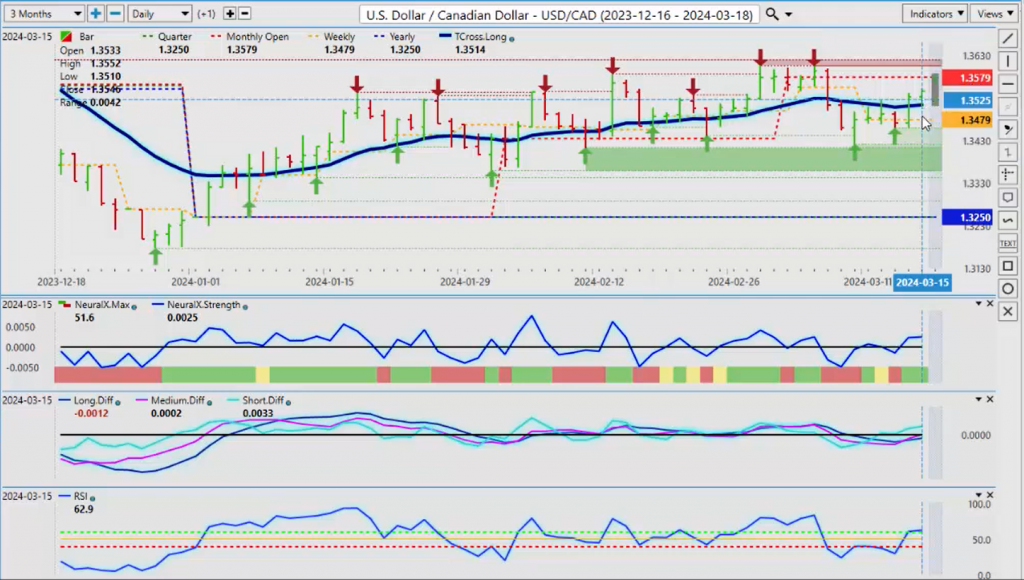
US/Canadian pair, once again, not even oil is helping the Canadian dollar here. The political climate in Canada continues to deteriorate, carbon tax, a lot of problems, high interest rates still. So again, we’ll monitor things, but with oil prices pushing $80 a barrel and a strong stock market, I would have expected the Canadian dollar to do a lot better than this, but it’s not happening. So, the Canadian dollar, or the US dollar, is firmly up against the Canadian dollar, but I, but nothing goes straight up, and nothing goes straight down. 1.3579, we’ve got some pretty strong verified zones up here around the 1.3605 area. So, for me to buy this up here at these levels, I’m going to need a break of 1.3605 because, again, I am anticipating the real seasonal pattern in Canadian dollar strength is more towards the mid-April, May point. So, a little bit more weakness to the upside, and then we start to look for shorts.
So, each week, I’ll be talking about this pair, and hopefully, we will start to see the opportunity for shorts on this in the coming weeks. But right now, it’s still saying we’re going higher with our MA Diff Cross. We’re running a little bit flat with the predicted RSI, but it is showing upward momentum, and of course, we’re above our T Cross Long, so 1.3514, that’s our pivot point for next week. And again, watch this because if the Monday-Tuesday reversal is the strongest in this particular pair, meaning whatever it does on Monday, it often does the exact opposite on Tuesday. It’s a phenomenon that’s been going across a number of these markets: oil, gold, S&P 500, multiple Forex pairs, individual stocks. So, keep an eye on this one, but be careful. And again, waiting until Monday night at the close is not a bad thing.
Australian Dollar versus U.S. Dollar
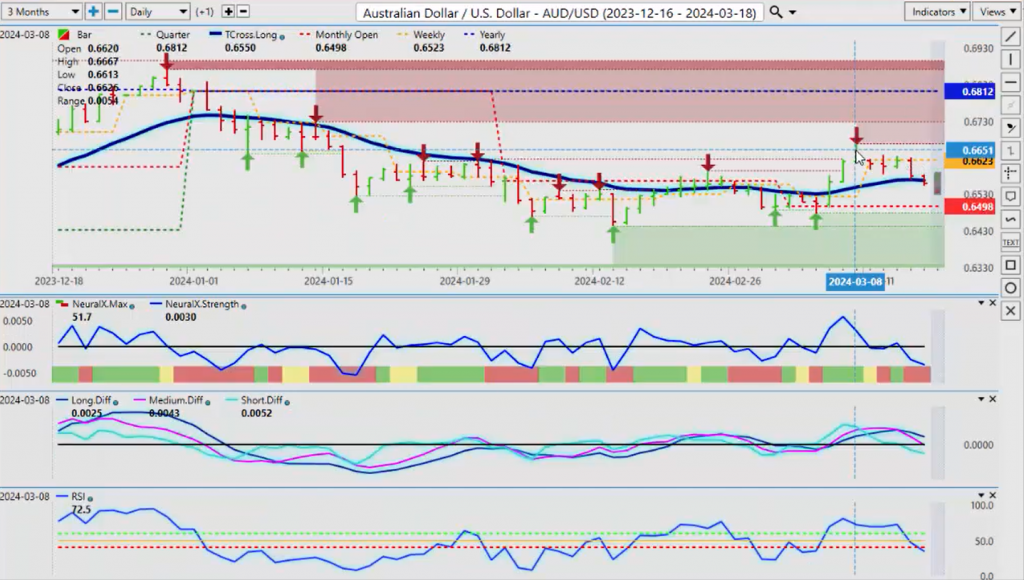
The Aussie/US pair, going into next week, once again, the Aussie still struggling here, guys. As I discussed the other week, we’ve been net negative on all year long. The Aussie is starting to turn back down again, but I am anticipating dollar weakness coming, as I’ve mentioned multiple times, this month and in this presentation alone. So, we’ll watch $0.6498, the current monthly opening price, see if we can hold above this. But right now, if we can get back above our T Cross Long at 0.6569, then we should see some upside. But I think we’re going lower first because we’ve got an MA Diff Cross to the downside, neural index strength is breaking, and the predicted RSI, with a nine-period predicted RSI and a 60/40 split, this is pointing towards downward momentum. This indirectly tells me that if this is correct, then stocks are going lower next week, as is gold, and the dollar likely higher.
New Zealand Dollar versus U.S. Dollar
We’re not going to see a lot of difference between that and the Kiwi, guys, where you can see the almost the exact same signal, except it’s more pronounced, saying that
the Kiwi is already broken down and it’s challenging the current monthly opening price. So, if the Aussie turns, it’s possible that the Kiwi is better value buying down here than the Aussie. So, if you wanted to short the between these two, Aussie/US has better value. If you want to play the reversal, then I would argue New Zealand/US is a better buy here at these particular levels.
So, we will have a very, very choppy week again next week, but with that is opportunity. Just be very, very cautious when the FED speaks on Wednesday.
So, with that said, this is the Vantage Point AI Market Outlook for the week of March the 18th, 2024.

