


VantagePoint AI Market Outlook for the Week of March 29, 2021
VIDEO TRANSCRIPT
U.S. Dollar Index
Hello, everyone, and welcome back. My name is Greg Firman, and this is the Vantage Point AI Market Outlook for the week of March, the 29th, 2021. Now, to get started this week, we’re going to begin where we always do, with that very important US Dollar index. Now, the Dollar has had a significant rally, basically, from the start of 2021. So, when we look back here to January the 6th, we look at this and see that we’ve had multiple moves to the upside here. However, my optimism on further gains on the Dollar here remains guarded. Now, we know that we have a monthly cycle, that seasonality, which I’ve pointed out many times here, using the Vantage Point software and the live MT4 charts. We can assess here that basically last year at this time, the Dollar basically peaked on March the 23rd. But remember here that we also had COVID starting up at that time.
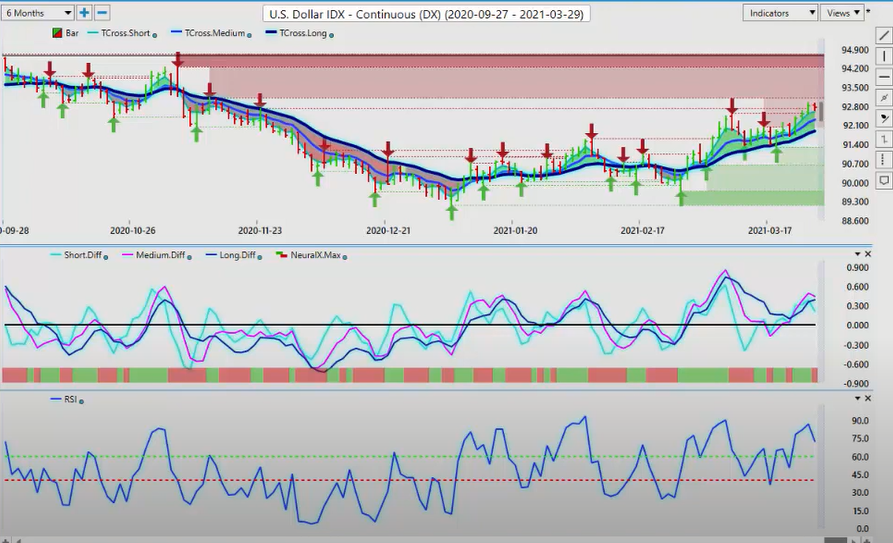
Global lock downs, a lot of different things were happening that drove gold higher, that drove the Dollar Yen much, much lower, US Swiss Franc. So, we have to take that into consideration in our trading. So, right now, we pushed a fair distance off of the Vantage Point predicted moving average, that key support level now at 91.90. We should expect some kind of retracement to that. Now, the Dollar is usually its strongest in the first, the end of the month into the first week of the new month. The only problem here is that we’re going in to a holiday short week. I believe that we’ve had real institutional demand for buying Dollars this previous week, and that that will bleed into next week, but maybe not for the entire week. But again, usually it’s not until after the non-farm payroll number that the Dollar weakens. Now, when we click on our F8 in our Vantage Point software, using the predicted moving average by itself, we can see that that pivot level is now 92.46.
My concern at this current time is the same signal that has repeatedly had us go long and short, the medium-term crossing the long-term predicted difference, and then combining that with the correlation to 31 other target markets. Now, that pink line, our medium-term trend, with the Neural Index, is starting to back away here. We’ve got a falling RSI, meaning we’re losing momentum to the upside. So, we want to watch these key levels. But just remember, the Dollar remains firmly above its yearly opening price, and nothing goes straight up and nothing goes straight down. But the one that I find very interesting here is gold. Gold, I don’t think they’re going to allow us to continue doing this for much longer, because using the Vantage Point software, repeatedly shorting into our T cross long, is a winning trade every single day, and I don’t believe the brokers are going to allow this much longer.
Gold
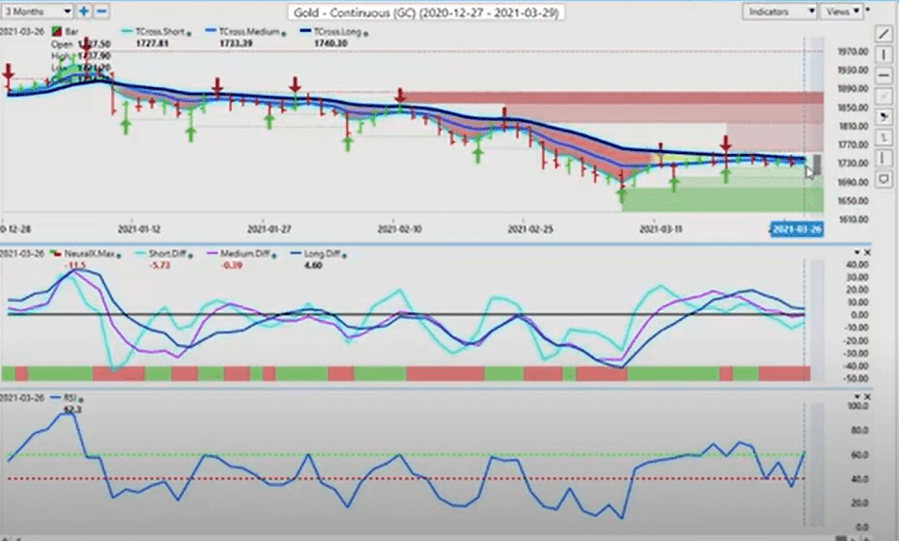
So, we’re looking for a catalyst to set gold, either move it higher, or whether the bears can take full control of this. Gold being down almost 10% on the year, very few buyers. Now, under the current situation, I would actually be quite bullish on gold if it weren’t for the inception of Bitcoin.
Bitcoin
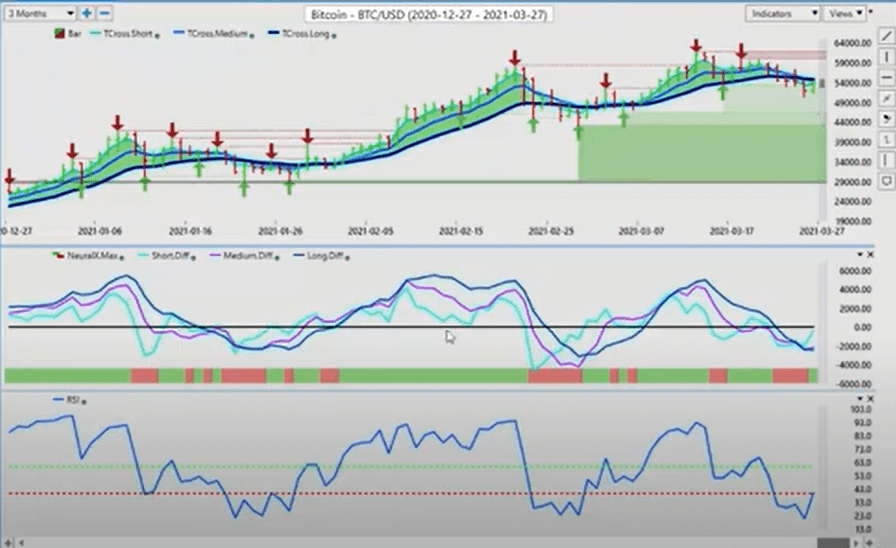
Bitcoin now, I believe, 53,000. We’ll look at that in a moment. But once again, our medium-term crossing our long-term predicted difference, using that T cross long, we’re simply unable to break this. Now again, the pink line over the blue line measures two different trends at the same time. So, when the medium-term trend starts weakening against the longer term trend, we use that as a contrarian position. Right now, gold is struggling at the zero line right here, but our Neural Index remains down.
Now, this is, again, one of the different ways that an RSI can be used. A very old indicator, but it has value here, guys. Now, we’re trying to break, this is a 60/40 split on the RSI. The only thing I’m looking at the RSI is to gauge momentum. It’s been altered to a nine period in the Vantage Point software. The overbought and oversold is now 60 and 40. I’m not interested in trading an overbought, oversold. I’m interested in trading on market momentum, volume. So, right now, this is an epic battle between the bulls and the bears. The bears are defending the T cross long at 17.30. This is an indisputable fact that nobody at the current time is willing to buy gold along these levels. So, we continue to short while we can. But again, looking at that seasonality, the question here, is the Dollar running out of steam here for the year?
Is the Dollar going to start its normal decline? There’s a lot of positives with the Dollars, with the Dollar, US Dollar. And there’s a lot of negatives for buying gold. So, we shall see how this one plays out. But once again, when we identify these key levels, if we click on our F8, we can see that we’re struggling along this predicted moving average. We need to break 1750, plain and simple here, guys. That’s the benefit of knowing your levels. One of the ways I’ve suggested it here is with a straddle play, continuing to sell into 1750, 1760, and have a straddle buy limit order at 17.60. Because if we can break above that, or for example, this high rights here, that’s why I would use 1760, give it a little bit of breathing room.
1756 is the top of the new verified zone, but as you can see with these verified resistance and support zones, we are continuing to make lower lows here, as we move down. This single bar after the Fed, they still would not buy gold. So, again, we’re moving sideways here, and I would argue that there is a mildly bullish signal here, very mild. But again, 1904, the yearly opening price, we are firmly below that level. Now, stocks, stumbling a little bit this week with the Fed of course, but ultimately it’s recovered and we’re moving back down, back up, excuse me. I’m just going to switch this over to our cash contracts. I prefer that particular contract for here. Once again, as we’re trying to break down below the key Vantage Point level, we’re struggling, only able to cross, close, excuse me, down below that level one day, and then we immediately recovered.
S&P 500 Index
Same as the S&P 500 here, guys, the S&P 500 coming under a little bit of selling pressure because I don’t think the market, like myself, is buying into what the Fed is trying to sell me. I believe that they are going to have to hike rates. So once again, when we look at this, our medium-term crossing our long-term predicted difference with absolutely zero lag tells us that we do not want to buy up here. We actually probably want to sell. But at the same time, we’ve got a predicted moving average at 38.93 that we must close below.
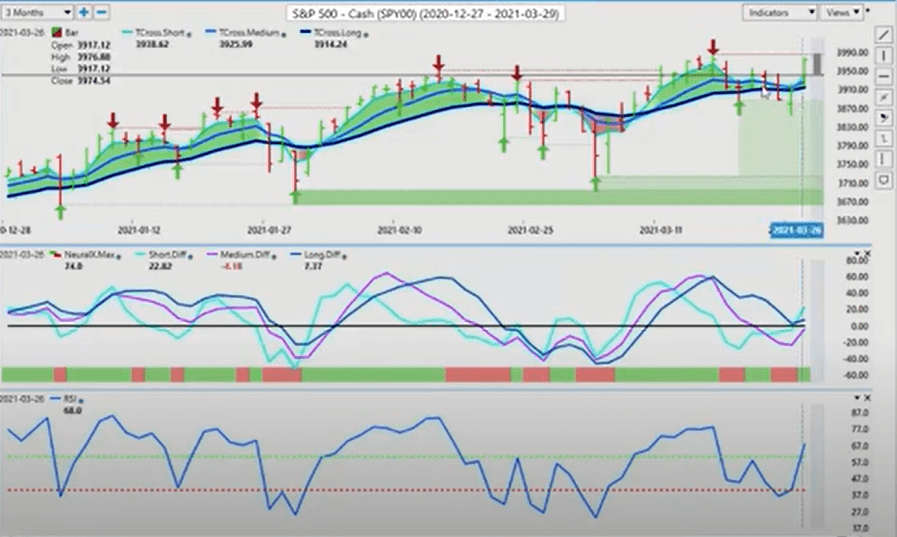
On Friday, you can see using the T cross long as a pivot area at 3914. It was nothing short of a springboard that it used it to accelerate higher. However, still a very strong verified resistance zone is identified by the software at 3949. We need to make a clean break of this area, if the S&P has any shot at the 4,000 mark. Now, both of the two main indicators here, our medium-term crossing our long-term predicted difference with the Neural Index. We don’t ever cross over here yet, so we still need to be very cautious up at this 39.50 level. Now, as we look at Bitcoin, once again, Bitcoin bouncing around a little bit this week. But again, what I will point out is that we are in a known period of Dollar strength. Once again, Bitcoin trades against the US Dollar. So, if we’re in a period of Dollar strength at the end of the month, into the first week of the new month, it’s perfectly normal for Bitcoin to be moving lower.
Crude Oil
Now, we can already see signs of recovery here. We’ve just got to break back up above 54,769. We have a buy signal, once again, very much trying to form here. The pink line crossing the blue line, that’s the medium-term trend against the longer-term trend, suggesting we are getting ready to move higher and the Dollar is getting ready to soften. So, again, if we straddle this, and we have our buy orders up above, I would argue 55,000, then when the market moves above 55,000, it’s likely going to try and make another run back towards that 60,000 mark. Now, as we look forward and look at oil contracts, obviously a very, very high correlation to the equity market. Starting to recover here, but the T cross long 61.47, unable to break back above that just yet. But once again here, guys, this is how we get into trades early with the Vantage Point software. The medium-term crossing the long-term predicted difference is warning us that we’re starting to move back up.
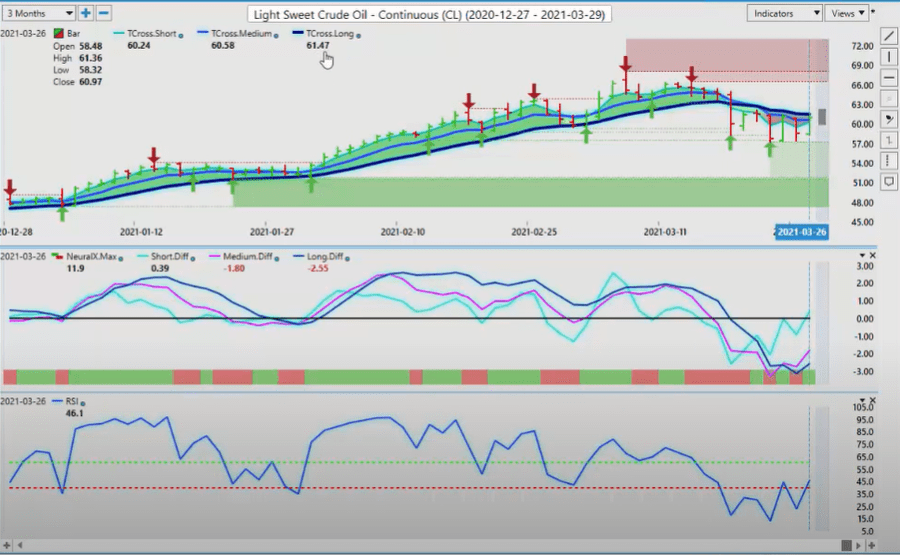
Now, we’ve got a number of staggered verified support zones down here, which obviously appears to be right now. Basically, there’s a bear trap set up down here. So, we’re likely to see oil extend higher with the S&P 500, based around the signal next week. But once again, we need to clear 61.47, if oil has any chance of returning back towards that $68 mark. I believe it can, as the global economies start to reopen. Now, as we move into some of our main Forex pairs here for next week, we can assess that the Euro, absolutely getting killed in 2021, and this is directly being caused by gold. Now, what we need to understand under the guise of inter-market technical and advanced inter-market technical analysis, is that the Euro has a very high correlation to gold contracts. I believe that this is why the Euro is moving lower for the better part of the year, because gold is getting killed, down almost 10% on the year.
Euro Versus U.S. Dollar
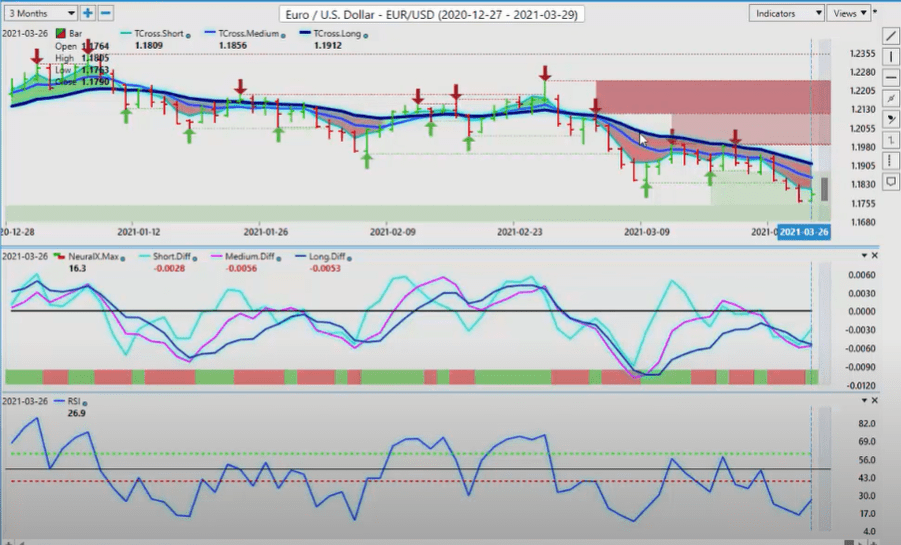
What we need to understand is that if gold does break through those aforementioned levels above 1760, then the Euro will recover. Now, the first point of recovery, or where you would need to break above, is 119.12. But I don’t believe the data coming out this week, next week with the non-farm payroll number, or the holiday short week, I’m not sure at this particular time it’s going to be strong enough, or weak enough, excuse me, to force the Euro higher, but the Euro is likely to correct higher towards the 119.12 level. Another excellent way to use the Vantage Point software, using the longterm crossover without the black line, just the blue line by itself, as a pivot area to gauge whether the market is actually bullish or bearish. The Euro firmly below its yearly opening price at 122.38.
Now, the pound dollar continues to move sideways between supply and demand. That is the basis of this outlook here, guys, supply and demand and intermarket correlations, not the MACD and the RSI. Again, I’m not sure if that person actually even watched the video. So when we look at this right now, it’s still showing bears. The Bank of England didn’t do much to help the pound at all. But we’re still trapped within this area here, so we’ve got a potential bear trap down here and a potential bull trap up here. But for now, the indicators in VantagePoint are pointing towards further weakness. The medium-term crossing the long-term predicted difference, breaking the zero line, the neural index, same 31 correlated markets are saying it’s bearish, the RSI breaking below 40. Again, there’s momentum building to the downside. Does it have enough momentum to break through this channel? As long as you understand where the channel is, guys, you’re ahead of most.
U.S. Dollar Versus Swiss Franc
So, again, down significantly on the year, but we can see that we’re trying to form a buy signal here, that pink line crossing the blue line. We need it to complete that cross with the Neural Index in agreement if the Euro is going to extend higher. But at this particular time, it is more likely than not. It is simply a corrective move in nature. Now, when we look at the US-Swiss Franc, it’s been a very, very good trade. We’ve done this in the Vantage Point Live training room, and I’ve done this with my own direct clients. As long as gold is moving lower, US-Swiss Franc is moving higher. It’s a buy-on dip. And the reason it’s a buy-on dip is, again, the very, very high correlation the Swiss Franc has two gold contracts, same as the Japanese Yen. So, right now, 92.68 is the critical level that we’re looking to hold above for next week.
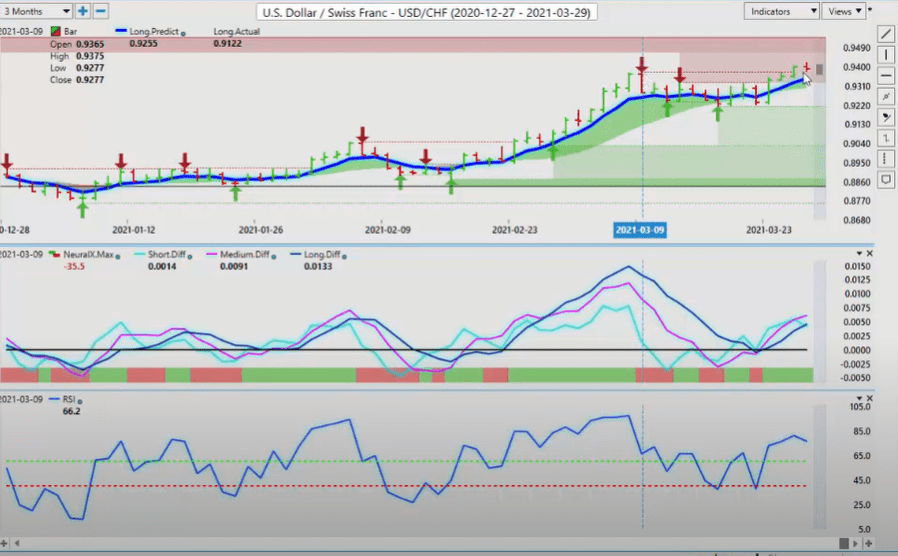
Our main intraday pivot level to be buying from is coming in down around 93.43. But we want to be a little bit cautious here, okay, guys, because we’ve got a verified resistance at 93.75, very often a break of a swing high like this usually leads to a corrective move lower before the next leg up. So, I would look for a move back down towards the 92, probably around the 92.80 here. The long-predicted at 93.48, but I would be keeping a very close eye on the, again, the T cross long is our longer-term pivot area. Our medium-term crossing our long-term predicted difference off this verified support zone, there’s an excellent signal here, guys. When you combine the VP levels, medium-term crossing the long-term predicted difference, Neural Index green, we’re holding along a verified support level. Soon as we break above that blue line, that leads to a nice move to the upside.
British Pound Versus U.S. Dollar
Our main intraday pivot level to be buying from is coming in down around 93.43. But we want to be a little bit cautious here, okay, guys, because we’ve got a verified resistance at 93.75, very often a break of a swing high like this usually leads to a corrective move lower before the next leg up. So, I would look for a move back down towards the 92, probably around the 92.80 here. The long-predicted at 93.48, but I would be keeping a very close eye on the, again, the T cross long is our longer-term pivot area. Our medium-term crossing our long-term predicted difference off this verified support zone, there’s an excellent signal here, guys. When you combine the VP levels, medium-term crossing the long-term predicted difference, Neural Index green, we’re holding along a verified support level. Soon as we break above that blue line, that leads to a nice move to the upside.
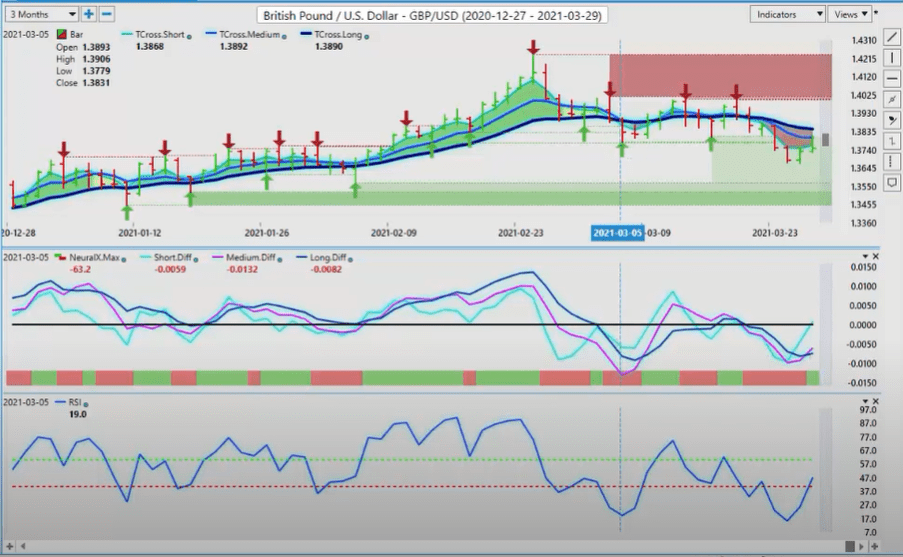
Right now, this could be simply telling us that it’s corrective in nature, back to 138.45. So, be very cautious with longs near that particular level of 138.45, because that could also be where it makes its corrective move up, and then fails and starts moving back down. The alternative way we would look at that is saying, okay, if I put a buy limit order just above this at 138, say, 138.60, as soon as we clear that critical VP level, it activates a long trade, and away we go. Again, not necessarily the best week for that particular play. Now, when I click on the F8, using that blue blue line by itself, we breached it on Friday, but then rejected it and closed below it. But I believe it’s gearing up for a potential long trade.
U.S. Dollar Versus Japanese Yen
Now, the Dollar-Yen, one of the star performers last week in the Forex market, but there’s a rationale why here, guys. The reason that it continued to advance is because gold is unable to break through 17.56. There’s an answer to that, the high correlation the Yen has to gold. So, if there is some type of catalyst that sends gold higher, the Dollar-Yen will be a very, very good place for shorts. But for now, we’ve got a fresh buy signal here, our medium-term trying to cross the long-term predicted difference. The Neural Index, taking the correlation of 31 other markets, all pointing to a bigger move to the upside coming. But this has already been a very good move on the Dollar-Yen. This payer here, we have verified resistance at 109.36. That is the level to be very cautious of, guys.
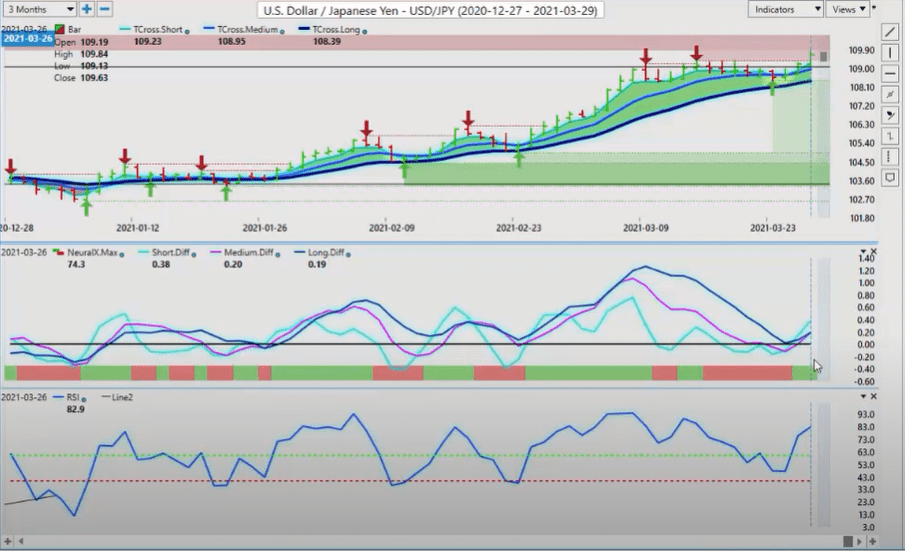
Because again, you can see that you’ve got resistance all stacked up with these bars up around this particular level. But as I had stated in last week’s weekly outlook, that I’m not an advocate for double tops, triple tops, quadruple tops. To me, that’s telling me that somebody is knocking on the door gently here, but they’re getting ready to kick the door down. And that’s exactly what they did on Friday. They plowed right through that resistance area, so that is still an indication that gold is going to struggle up here, and that gold shorts are still more than reasonable. When we look at the additional indicators in the Vantage Point software, the correlation to 31 other markets by clicking on the F8, using that blue line, there’s a nice signal right there. We close above the predicted moving average, and that sets off three days of buying on the Dollar Yen pair, which we can manipulate and use that predicted moving average as a daily pivot area.
U.S. Dollar Versus Canadian Dollar
Now, as we move into some of our additional pairs, equity markets are starting to turn around again, the S&P advancing. If the S&P can continue to advance, then the Canadian Dollar is feeding off, strengthen the equity markets, and not just the equities here, but also oil. So, for start of next week, what we would do is, we would just draw a line on this particular high right here. Now, that high is coming in at 126.28. These indicators are starting to roll over and saying, “We’re running out of buyers up here.” So, here’s what I would watch, and what I had talked about in last, in numerous weekly outlooks, are these Monday reversal plays, or Tuesday reversal, Monday being a fake price. So, the pattern that I’ve seen with US Canada is that if it makes a big move to the upside on Monday, you would sell it on Tuesday.
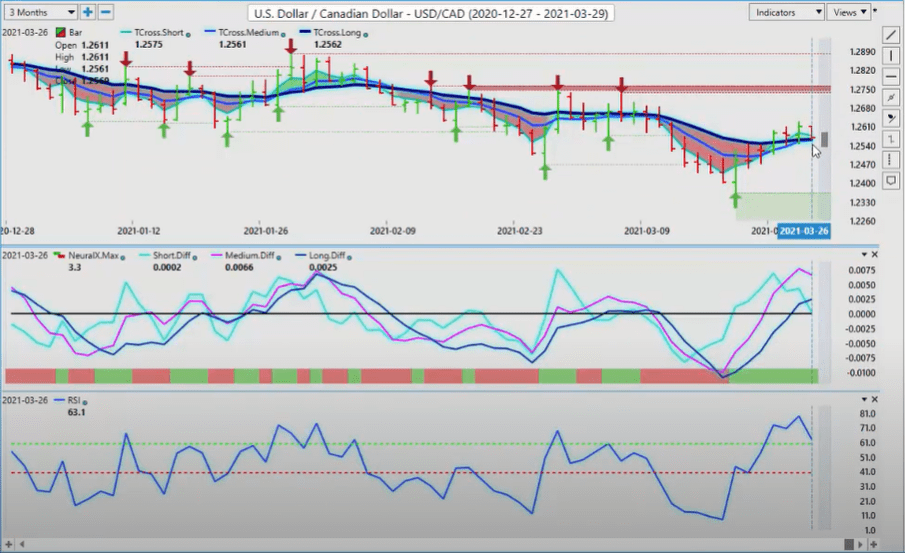
If it makes a big move to the downside on Monday, you would buy it on Tuesday. I can’t explain the rationale, but it’s happening across a number of different markets. This past Monday is a great example. You had a rally on multiple different Forex pairs, multiple different commodities, only to completely reverse on Tuesday. Watch out for that. The Vantage Point indicators are already forewarning of that. Now, 125.62, that’s the key level to watch. When we click on our F8, you can see the market using the predicted moving average, an excellent daily pivot level to exit, to enter for long trades. But the second we close below this critical level of 125.63, we are likely going to see a reversal. What you want to watch very carefully for this is the S&P 500 to advance past the 39.40 area.
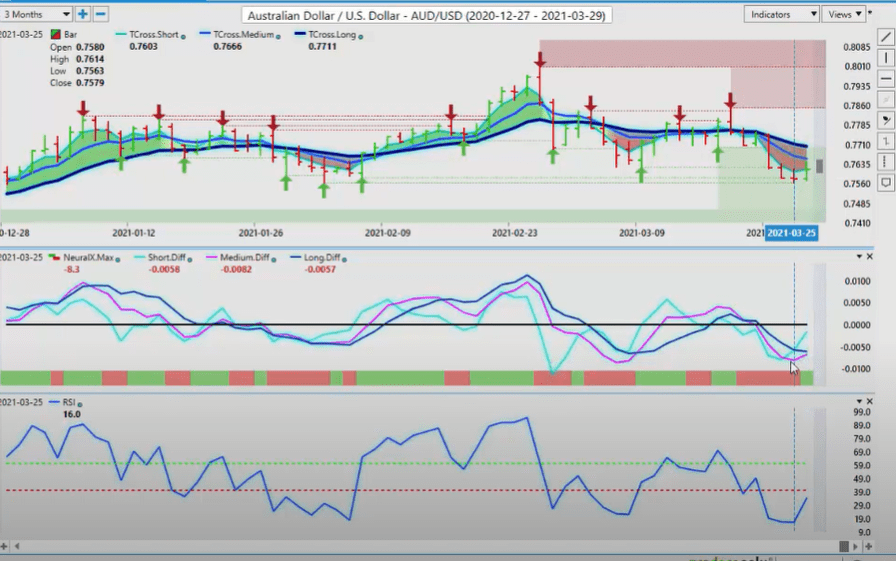
If it does, US Canada is 80% probability it will follow it. Canadian Dollar will strengthen, and this pair will drop. We will see the exact similar formation, a full possible recovery on the Aussie US. Now, again, using the verified support low at 75.64, the market hit that like a brick wall here, guys. Came right to that verified support level. Absolutely zero lag on a trade setup, because this is not a moving target, guys. This is supply and demand. That’s the whole, excuse me, theory behind supply and demand, is that the levels are predetermined. Your institutional order flow traders are going to target longs and reversals around these points. When we look at the VP indicators, our medium-term crossing our long-term predicted difference, measuring two different trends simultaneously with the Neural Index, the correlation to 31 other markets. They’re both pointing that this is getting ready to reverse back to the upside.
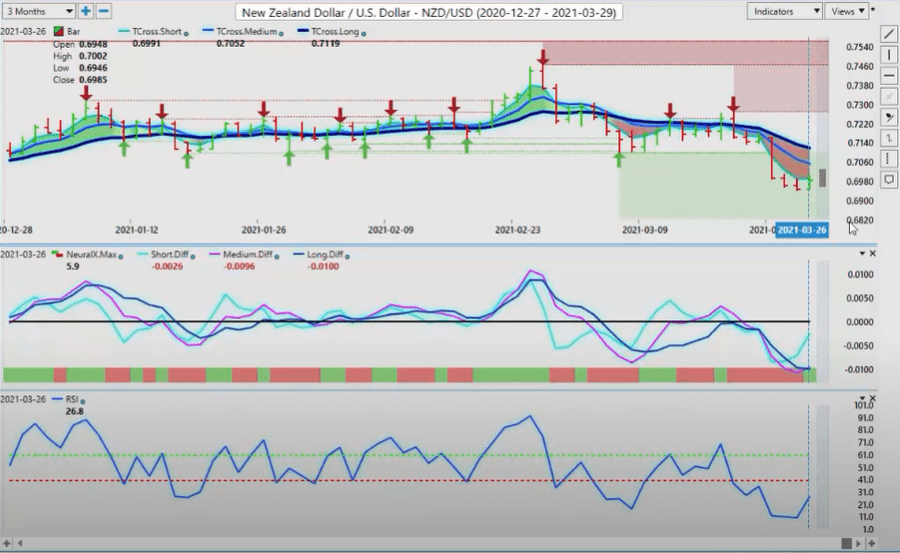
So, again, when we look at our upside target, we’ve got an upside target, 77.02. When we click on the F8, that level is coming in at 76.43. If we close above 76.43, then we know to get longs in there, and we’re going to correct to at least the 77 level or beyond. So, if you know your levels, you will know exactly where to enter these going into next week’s trading. Because again, this is an outlook, not a recap of something that already happened. When we look at New Zealand, we’ve got the same thing forming here. We’ve moved a fair distance away from the T cross long, 71.19, so we’re looking for a potential retracement.
We do have a buy signal forming right now, the medium-term crossing the long-term predicted difference with the Neural Index. The RSI, again, it’s not being used for an overbought or oversold. It’s being used to gauge momentum. Do we still have downward momentum? The answer is no we don’t, because of the direction in which it’s pointing. The slope of the actual predicted RSI is starting to point back up. That’s warning us that we’re losing this downward momentum here, guys. So, confirming that with predictive indicators, like the predicted difference and the Neural Index, that tells us that we’re probably going to move back to 71.19.
Australian Dollar Versus Canadian Dollar
Again, if we click on our F8 here, we get a very, very good level here to potentially target, or straddle. So, that critical long predicted is 70.25. If we break above 70.25, then we’re likely going to extend higher. This is how we would play this, with the support of the additional predictive indicators.
New Zealand Versus U.S. Dollar
So, we will see volatility next week, as we are a holiday short week. We’ve got the non-farm payroll number, but the Fed has tried to do as much damage to the markets, more specifically to the US currency, but it didn’t work. The more the Fed interferes, the more people are stepping in and buying Dollars. But just remember that there is institutional plays happening right now. Pension funds, a lot of major governments having to buy US Dollars around the beginning of the month. They may have completed that this previous week, and they didn’t want to expose themselves to next week, so we shall see. So, with that said, this is the Vantage Point AI market Outlook for the week of March the 29th, 2021.
Are you using A.I. yet?


