


Welcome to the Artificial Intelligence Outlook for Forex trading.
VIDEO TRANSCRIPT
VantagePoint A.I. Market Outlook for May 26, 2025
Okay, hello everyone, and welcome back. My name is Greg Ferman, and this is the Vantage Point AI Market Outlook for the week of May the 26, 2025.
U.S. Dollar Bull Fund ($UUP)
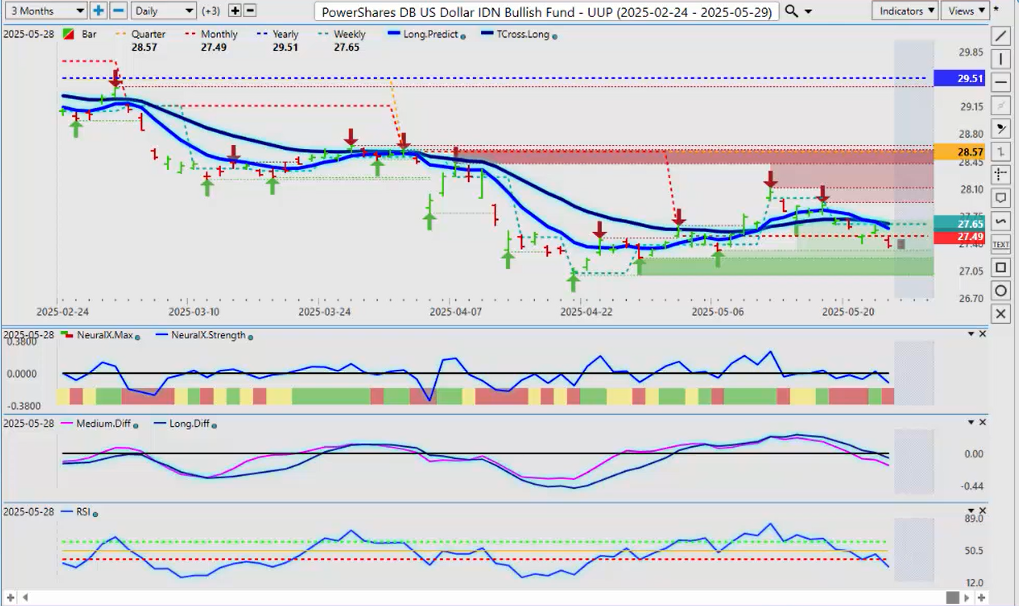
Now, to get started this week, we’ll begin with the U.S. Dollar Bull Fund, the UUP, to see if we can get a feel in both the forex market and the equity and commodity markets—what’s happening.
So, a fresh sell signal on the Dollar Index as it moves below the calendar monthly opening price. Again, very important that we’re not moving our goalposts here—that we keep that monthly opening on the current month.
Now, what I will say is that, in most cases, the dollar is strong at the end of the month. Now, we’re in a holiday-short week next week, so toward the end of next week, I do anticipate dollar strength coming—even though we do have a sell signal again on the dollar.
Now, there I’m sure there’ll be more announcements on tariffs and everything else next week. But again, always remember that dollar cycle—in most cases—at the end of the week into the first week of the new month, usually until the week after, the Tuesday after, the non-farm payroll number. So we’re about a week out—still some dollar weakness here—but always remember that that probably has an expiry date.
Dollar Bear Fund ($UDN)
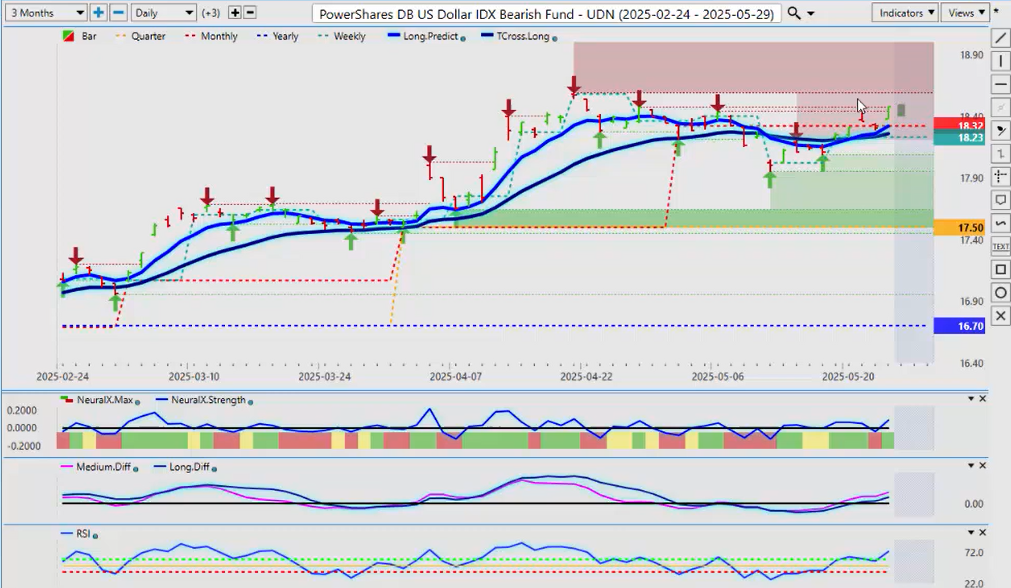
Now, on a comparative to the UDN, the Dollar Bear Fund, it’s gaining momentum. It’s pushed above its monthly opening price. Our predicted differences look good, neural index strength—so a little bit more dollar weakness. But respectfully, I think that it would be very difficult for the bear fund, the UDN, to get past the most recent verified—not the most recent, excuse me—the highest verified zone that we have, which is 18.59. So look for a reversal around that particular area.
SPDR SPY ETF ($SPY)
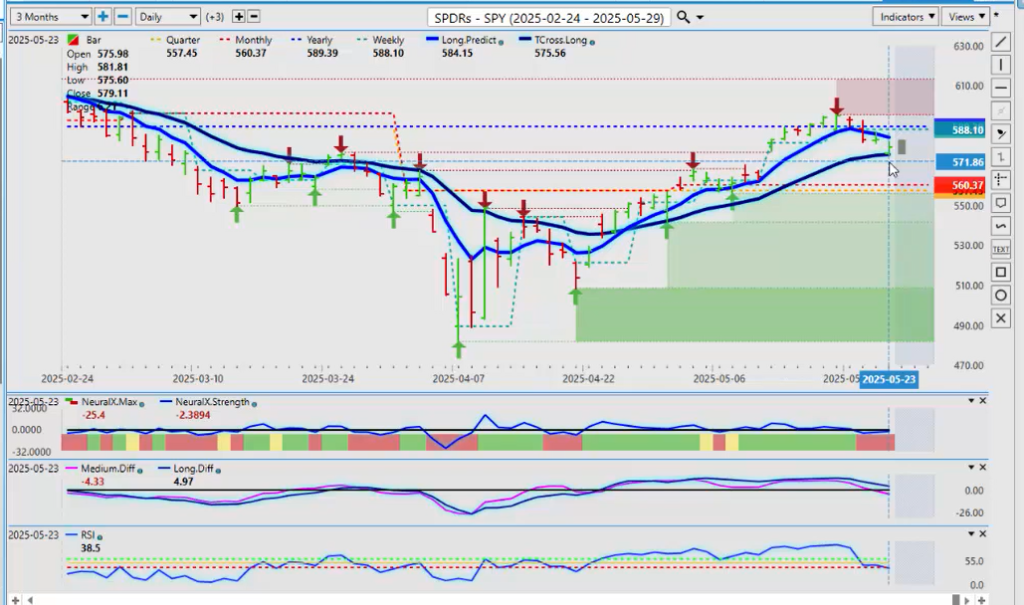
Now, when we look at the S&P 500, the SPYs we’re going to use from here on out in the presentations, we can assess here that the SPYs are under pressure again. But what I will point out is that we have failed right on the T-Cross Long 575.56. We are still very much positive on the calendar month, but we’ve turned negative again on the calendar year.
Again, we want to make sure that we’re using the current yearly opening price, the current monthly opening price, quarterly opening—even the weekly opening price here, guys—because it really does tell us, on a price action basis, what is happening.
So, the SPYs under a little bit of pressure, but again, if we look at the intermarket correlation, the global—or actually the U.S. indices—have been very much positively correlated to the U.S. dollar. So again, this could be a warning sign of pending dollar strength if we can hold above that critical VPT Cross Long.
Now, we do have a medium-term crossover that’s taken place—that’s the pink line crossing the zero line—but the long-term crossover has not taken place yet. So again, we do have some momentum building to the downside, but I—much like the Dollar Index—anticipate that the weakness in the equity markets will turn around when the dollar does.
United States Oil ($USO)
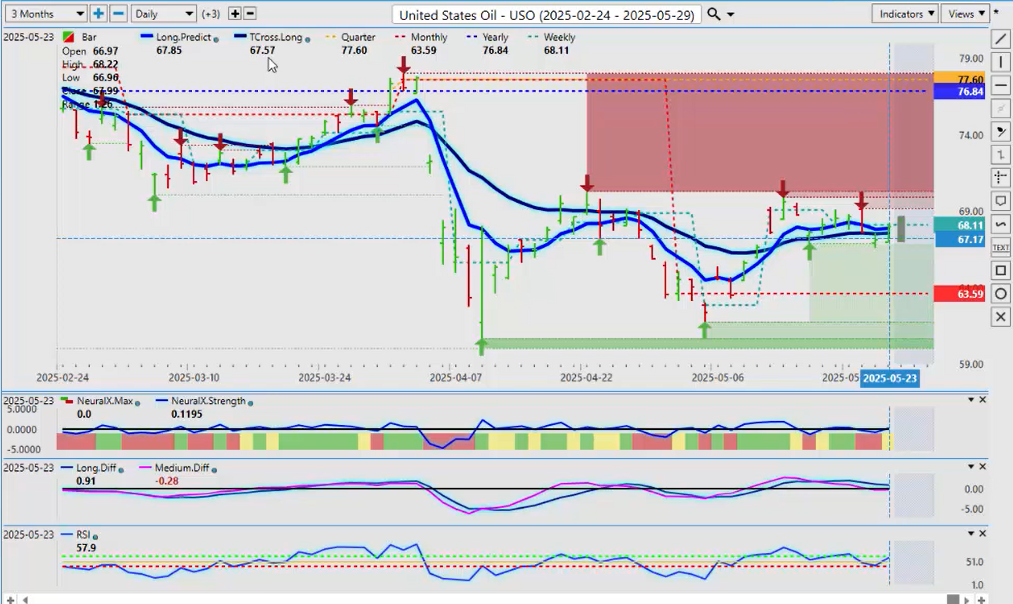
Now, lightweight crude oil, or we’ll use the U.S. Oil Funds going forward—they’re still looking quite good. Positive on the month, negative on the calendar year, and negative on the quarter. But always remember that there is a known seasonal pattern with oil—usually occurs mid-June. So I would argue maybe even the beginning of June. But for now, we will remain long this while above our T-Cross Long—that’s coming in at 67.57.
We still keep a very close eye on oil futures, but ultimately, when we look at the balance between oil demand and renewable demand, it’s still about an 80/20 split. That still favors oil for now. Maybe in the future I think that that will change, but for now, oil is still dominant. So I believe that that seasonal pattern will remain in play.
We can see that our predicted differences are starting to turn back up. The predicted RSI failing at the 40 level—very, very important with that 60/40 split because we don’t want to look at overbought/oversold. We want to look at momentum. So this is telling me that momentum is beginning to turn back to the upside with oil contracts.
Bitcoin
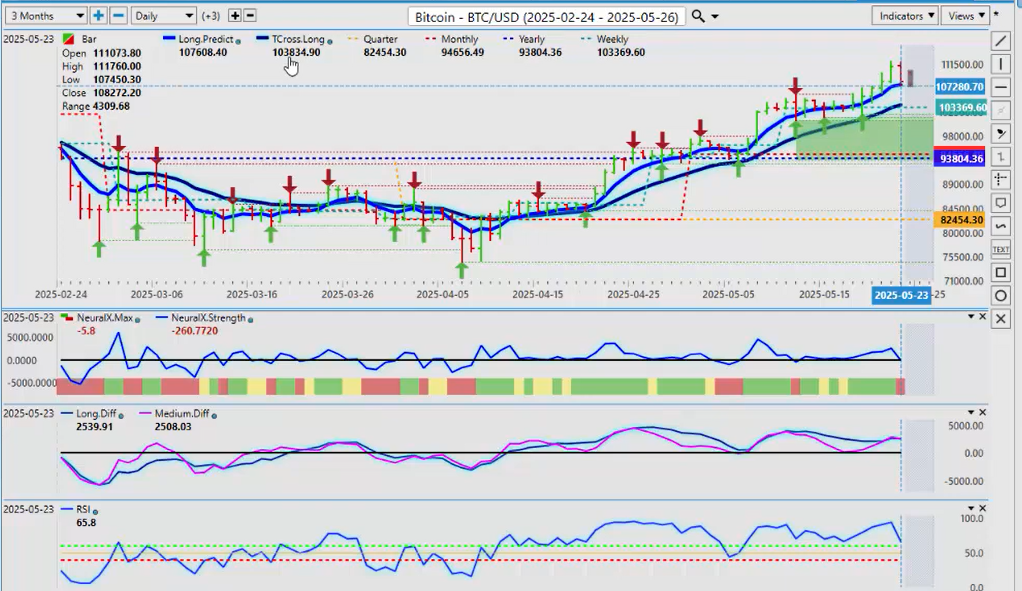
Now, when we look at Bitcoin—coming off a very strong week again. But this is a little unusual for Bitcoin to show this kind of strength in the month of May. So when I’m looking at that going forward, my argument would be that we are going to come back down to the VPT Cross Long—the predicted moving average—103,834. I would anticipate we will see a move to that level in the coming week.
Because again, the main seasonal with Bitcoin is around October—mid-September through early November. So while we’ve had a good move up based on the fundamentals of the tariffs and all these other things that are going on—if they go away and the dollar strengthens at the end of next week—then ultimately Bitcoin comes lower.
Now, we would still remain net buyers of Bitcoin in 2025, but I’m more interested after August 1st for the big rally to occur. Now, it is looking much better, but we were above our quarterly opening price, 82,454. 93,804 is the calendar yearly opening price, and that very important monthly opening price at 94,656.
But guys, these are all retracement points that have absolutely nothing to do with standard analysis like Fibonacci or some of these things. It’s what the market is doing. Is the market buying Bitcoin this year? Yes, they are. They’re buyers in this quarter and in this particular month.
But we are starting a new month again, going into at the end of next week. So be mindful of that—we will have a new calendar monthly opening price. And Bitcoin is a little overextended, I would argue, for this particular time of year.
Gold ($XAU/USD)
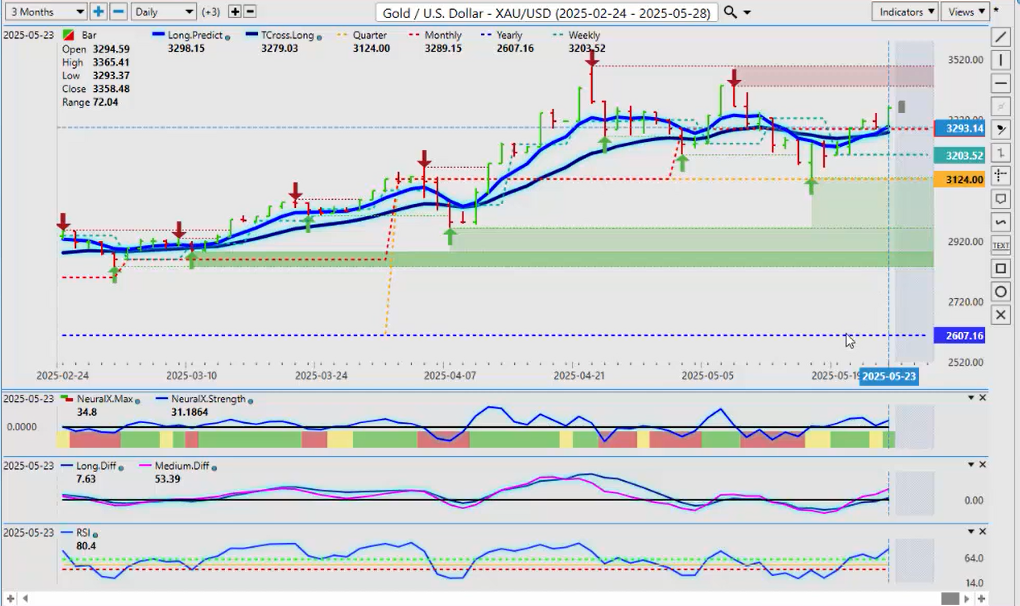
Now, when we do that comparative analysis to gold, now gold is again making another push here. Make no mistake—it is definitely bullish on the year and in this particular quarter from 3,124. However, what I have seen on a regular basis is, with that known period of U.S. dollar strength likely to kick in at the end of next week, then what I would anticipate is gold, in its final rallies for the month of May, will likely move considerably lower later into the next week.
So Thursday, Friday—I think we’re okay to buy gold up until then, maybe even as long as the following week. But then you can expect a significant retracement—probably back down toward this 3,124 area or just above.
But ultimately, gold is likely to continue having a great year. But nothing goes straight up, and nothing goes straight down, guys. That’s just the way these markets work. So be cautious of longs going into the end of next week.
Euro versus U.S. Dollar
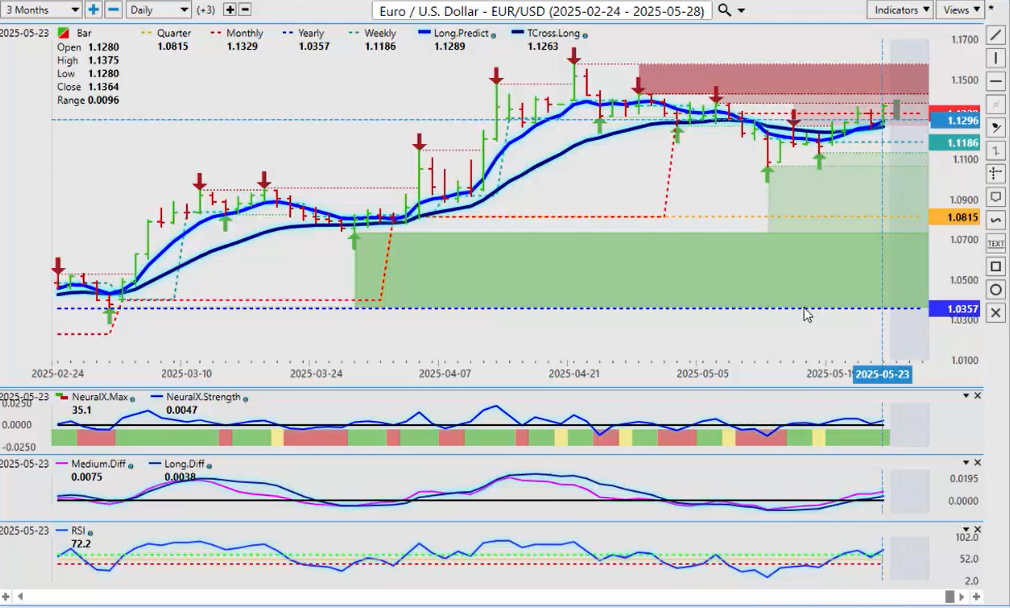
Now, when we look at some of our main forex pairs—once again, the euro is pushing higher. This pair has a very high correlation to gold, so if and when gold turns down in the latter part of next week or the following week, the euro will follow.
So right now, we’re bullish on the year—1.0357. We’ve just barely got over that critical monthly opening price at 1.1329. I feel we can extend to the verified resistance high—1.1425—and that would likely be it.
We could see—if we can get through that area—then that would take us back to 1.1573, where I’m pretty confident the sellers will step back in, right around that level.
U.S. Dollar versus Swiss Franc
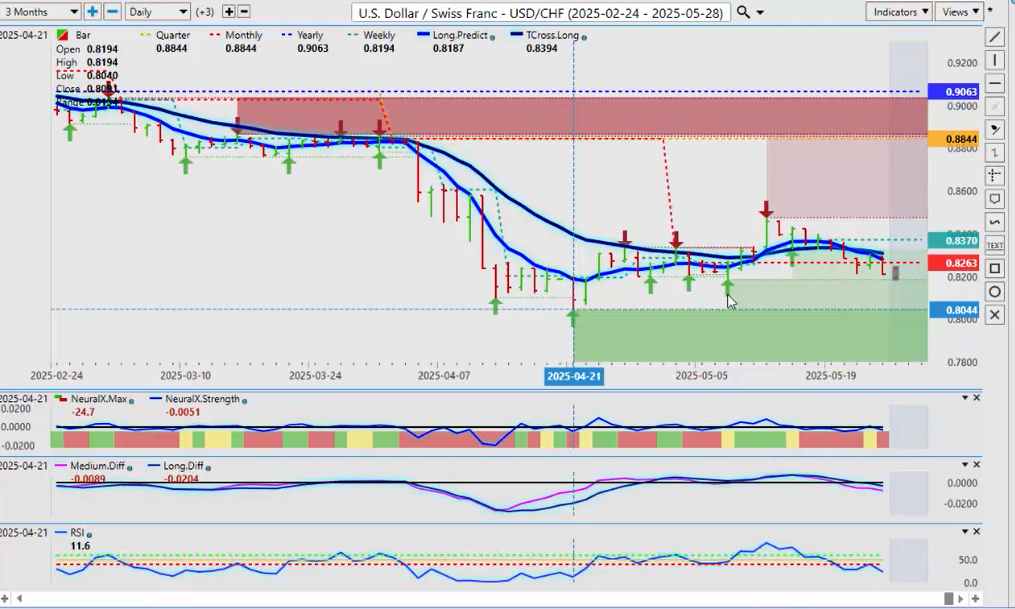
Now, the inverse correlated pair to that is, of course, U.S. Swiss Franc. Now U.S. Swiss Franc—waiting for the dollar to turn higher. And when it does, I think we’ll have a decent long on this.
So I would hold out—the first support level, that low, is 0.8187. But I believe it could get down as low as 0.8040. But that’s where we would look to step in to buy this thing, at least in the short term, during that period at the beginning of the month of known dollar strength.
The indicators still very bearish, but I believe they will start to turn by the latter part of this coming week, once we get past that holiday-short-week volatility.
British Pound versus U.S. Dollar
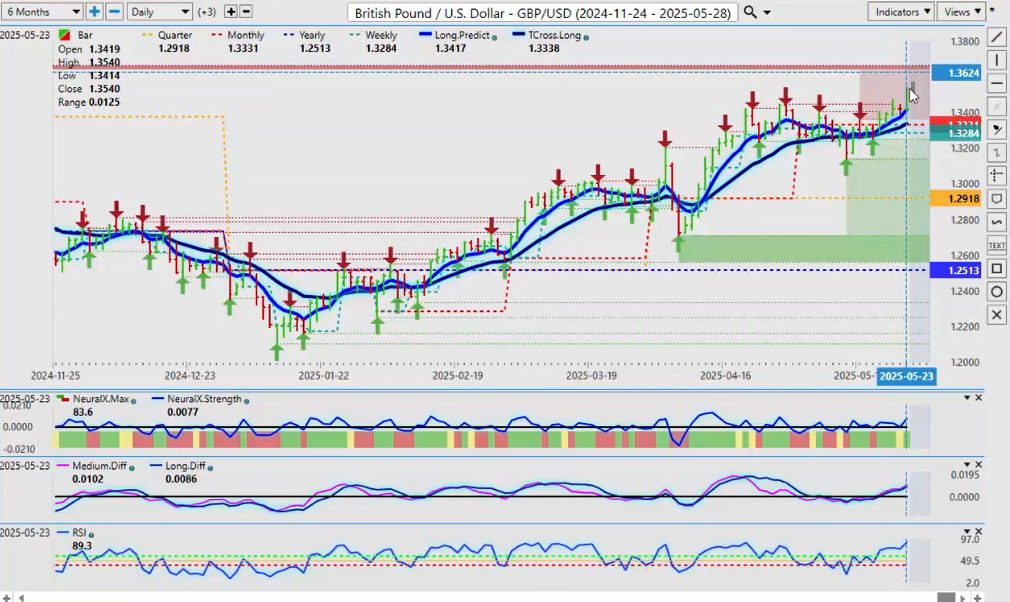
Now, when we look at the pound-dollar, again very much a euro-U.S. trade, it’s driving pretty hard to the upside. But anything that goes up this quick usually goes down.
So again, if we back this out just a little bit to our six-month, we want to look at this verified resistance up here. And I believe that’s going to come in around 1.3624. Keep an eye on that area.
We’ve had a very good close in the week—1.3540. I anticipate another rally in the pound-dollar. And again, following that dollar strength, then the pound moves lower.
Always remember our key retracement points—the Long Predicted, 1.3417. The T-Cross Long, 1.3338. So the further we move away from 1.3338, the more likely it is we’re going to retrace back to that T-Cross Long.
U.S. Dollar versus Japanese Yen
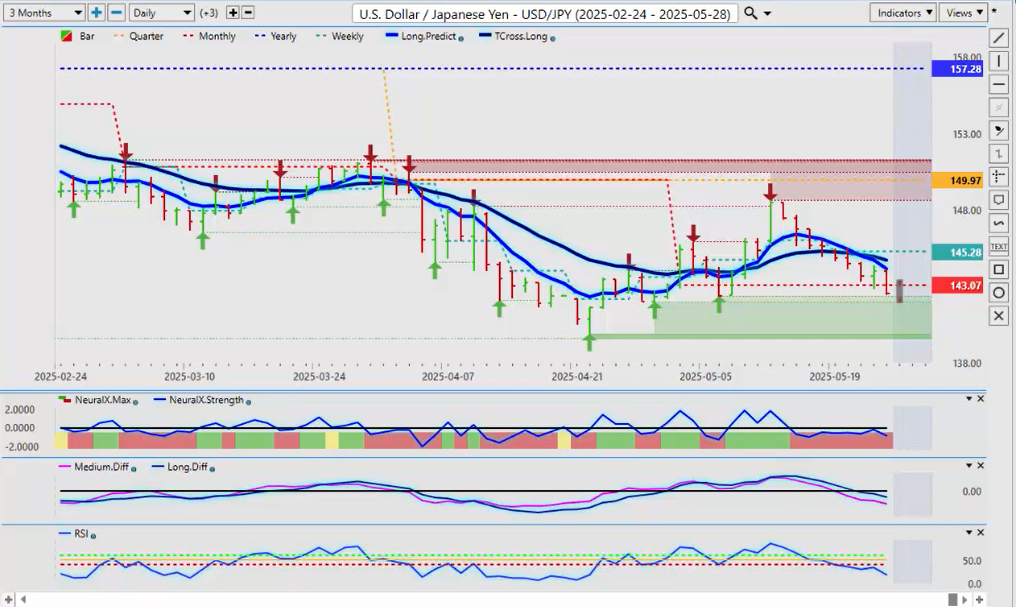
Now, with the dollar-yen really taking a hit this week—and I think everybody knows I’ve been very bearish on this pair this year. First and foremost—craziness that this got up into the 160 area to begin with.
But as the carry trade continues to come up—it continues to unwind. That will keep putting downward pressure on the dollar-yen. However, I believe it will get a reprieve during that period of known dollar strength at the end of the week into the following week.
So watch for potential very short-term longs—141 would be a key area. But ultimately, we could get down as low as 139.89.
Now again, even at the 139 level, I believe this particular pair is still grossly overvalued based on the interest rate differential between the Bank of Japan and the Federal Reserve. But that is going to start to continue to shrink if the Fed cuts and the Bank of Japan even makes a tiny little rate hike—that will really cause havoc in the carry trade world. So watch for that.
And again, be very mindful of the reversal indicators, like the MA Diff Cross. When that pink line starts to cross back over the blue line, then that’s a warning sign that we’re going to retrace back to the upside. Those targets would then be 144.71 and 144.14. I believe that is likely by the end of the week, barring any more wild moves in the main global indices.
U.S. Dollar versus Canadian Dollar
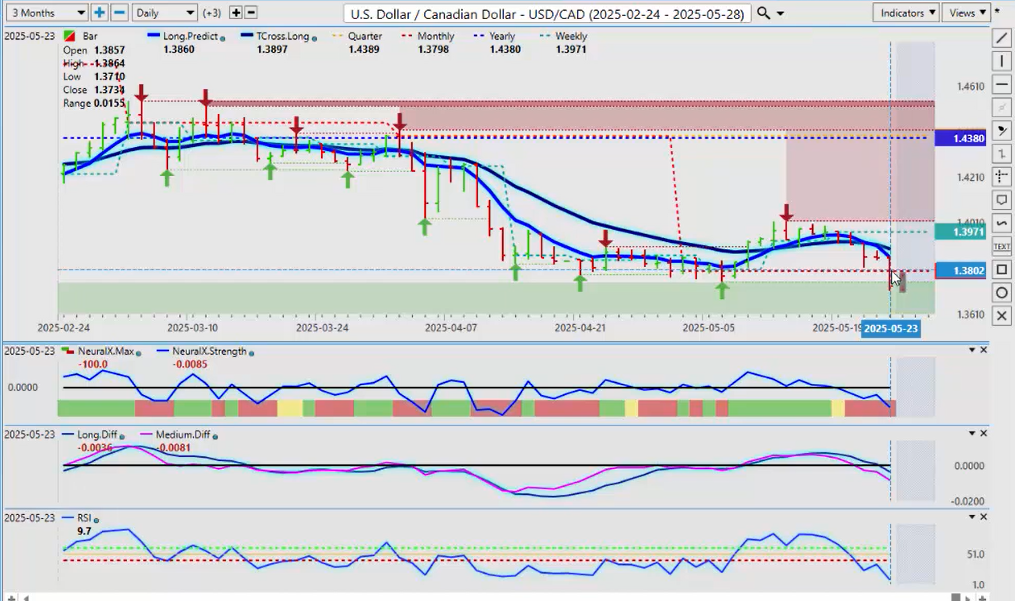
Now, when we look at the main pair—U.S.-Canada. Now, U.S.-Canada—again, I don’t see a lot of reasons to buy Canadian dollars, to be perfectly blunt, other than the fact of the Canadian dollar’s high positive correlation to oil. So if oil is moving higher, usually this pair is moving lower.
So a little bit more downside on this, but a reversal is imminent here, guys. The economy in Canada—not doing well, let’s just say that. We’ve got a new prime minister, there’s all these things going on.
But again, the main seasonal in oil, I believe, is driving that Canadian dollar buying—pushing this pair lower. The tariffs—again, Canada has lifted the tariffs, but the U.S. has not lifted the tariffs off Canada. So always remember that too. Those tariffs are going to hurt the Canadian economy even further.
So longs do look very attractive, but we’ve just got to get past this seasonal play with oil, and then I believe that this pair will extend higher.
Now, the Aussie and the Kiwi—completely and utterly ignoring the weakness in the equity markets. And I haven’t really seen this since, probably, prior to the 2008 financial crisis, where the Aussie currency, the Kiwi, the CAD—they have to trade on their own merits, not just on dollar weakness or equity strength or commodity weakness and strength.
So when I look at this right now, you can see that the Aussie is running along that monthly opening price and the VPT Cross Long all week. We had a failure to break lower on the predicted RSI with that 60/40 split.
We break above 60—we have momentum to the upside. We break below 40—and we have momentum to the downside. That did not occur here, guys, and it just turned right back up.
Australian Dollar versus U.S. Dollar
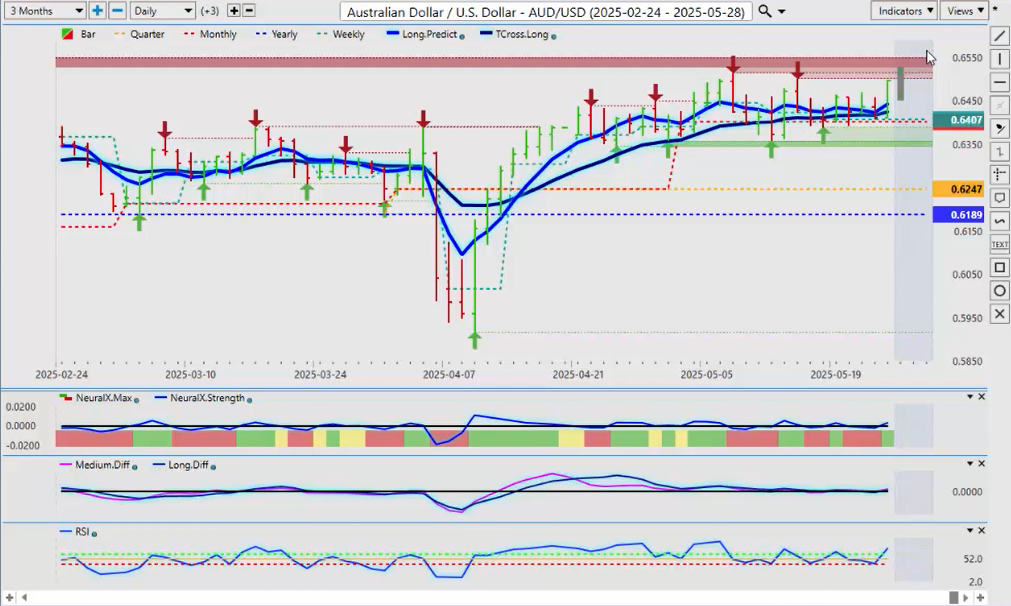
The Aussie is positive on the year, the quarter, the month, and even the week. But it’s coming into some very stiff resistance up here at 0.6540 and that additional verified resistance high at 0.6501. So be careful around this particular area.
You can see the Vantage Point bar for the predicted high and predicted low for Monday. But remember—Monday’s a holiday, guys. Sit tight on Monday. Wait for midday Tuesday. Get all markets coming in before you take anything.
New Zealand Dollar versus U.S. Dollar
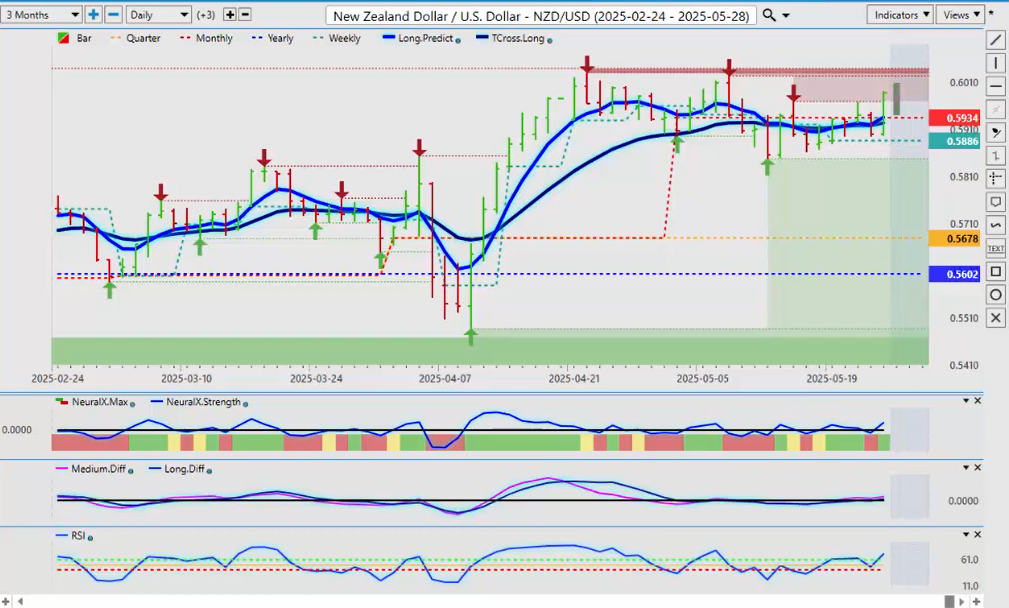
The same thing applies to the Kiwi. The Kiwi has actually done very well this week against the Aussie and against the U.S. dollar. But the question is—can it continue with that strength?
And in my respectful opinion only—I think it will be difficult. The two verified resistance highs here are almost the same area. That provides us a target point for our long trades, but that also provides us a potential reversal point if we get that dollar strength that we’re anticipating at the end of next week into the following week.
So we will have a very, very volatile start to the week on Tuesday. Remember—you’ve got a U.S. holiday on Monday. That is going to be a choppy start, because now Trump is after the EU and talking about 50% tariffs on them.
So it’ll be another interesting week, but with that, there will always be opportunity.
So with that said, this is the Vantage Point AI Market Outlook for the week of May the 26, 2025.


