Welcome to the Artificial Intelligence Outlook for Forex trading.
VIDEO TRANSCRIPT
Hello, everyone. And welcome back. My name is Greg Firman, and this is the VantagePoint AI Market Outlook for the week of May 2, 2022.
U.S. Dollar Index ($IDX)
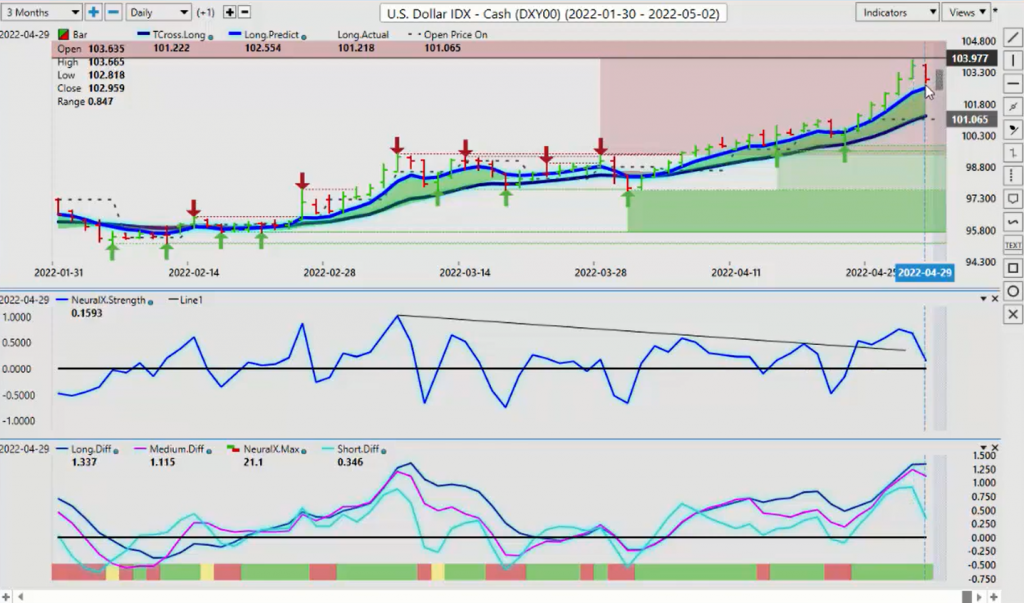
Now, to get started this week, we’re going to begin where we always do with that very important U.S. Dollar index. Now, it appears that we may have a short term top in place, but again, very difficult market when you’re selling U.S. dollars. So we’re looking at a high of $103.92. That’s the level we’ll start to begin the week. I’ll just draw a little line here so everybody can see that. Just below the verified resistance high, we’ve got our neural index strength, which has taken a hard turn down. Our predicted differences are losing strength, but our neural index still remains a solid green. So what we will do here is identify key pivot levels. The first one being the long predicted $102.55 and our T cross long at $101.22.
Now, over the many years using the VantagePoint software, what I’ve noticed is the further we move away from the VantagePoint T cross long, the more likely it is we’re going to retrace to it. So we’ve made a substantial move away from 101, suggesting we could have, if nothing else, a retracement on the dollars, so we’ll be watching that level very closely. But the first one we have to break through in order to hit that T cross long is, of course, the long predicted. $102.55, we’re going to see if that holds, if it doesn’t, our immediate target would then be 101.22.
Gold
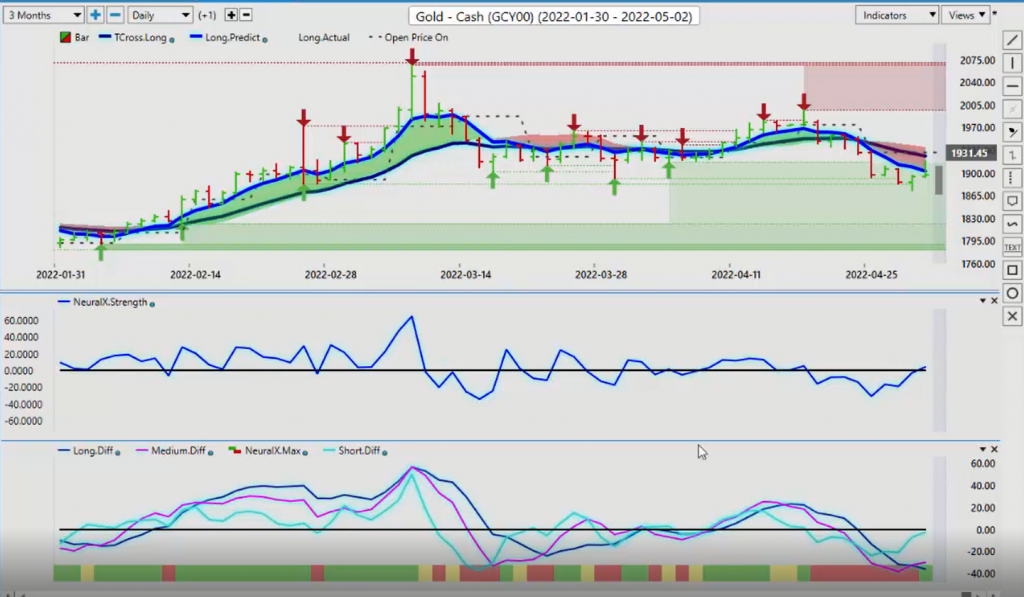
Now, gold also losing a little bit of momentum here, but our verified support low is holding. That key support level that’s coming in at the low of $18.82, you can see that price action is all tangled up along that verified zone. Now we have our neural index.
Very interesting trade set up here. The neural index strength is pointing higher and we’ve crossed the zero line. The neural index itself has turned green. Now, we do need to be cautious in Monday trade because we do have a UK bank holiday. That means that some of your bigger markets in the UK are going to be out, so be very cautious. But right now, this indirectly potentially confirms a short term top on the dollar and gold getting ready to reverse higher. I think that all eyes this coming week, and again, I cannot stress enough to be very, very cautious down here.
S&P 500 Index
The, the support low is $41.57. Now $41.57 we’ve closed below that particular level. We’ve got the additional support low at $41.14. If the S&P 500 has any chance of turning around, this is where it’s going to be.
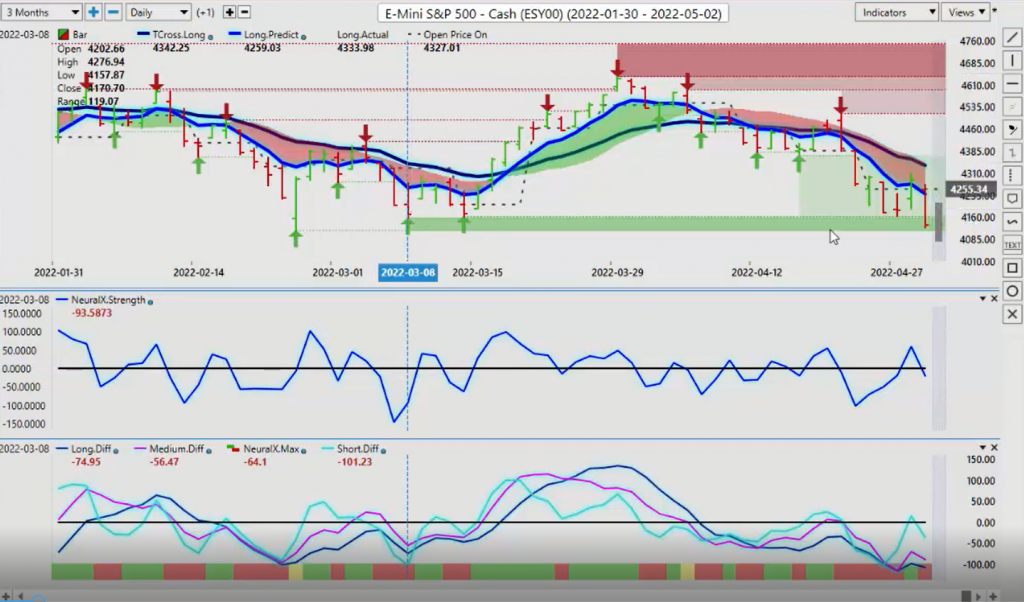
Sadly, the neural index strength is pointing down, crossing the zero line. Predicted differences, we did have a cross to the upside. Now, bear in mind, this is a Friday bar. In most cases, I would disregard the Friday bar and wait for a reversal. But the key point here is to make sure we can hold above $41.14, or no matter what happens on Sunday and Monday with that UK bank holiday. Tuesday, the real price will show itself. Now, if the S&P 500 can put in a short-term bottom, which is at best a 50% probability, that support level will not hold because we’re clearly in a bear market. But what I want to do is make sure I’m pointing out that we’re still in that overall channel low, down around that $41.14 level. Now, if the S&P 500 can bounce higher, then Ether and Bitcoin will both follow it.
Bitcoin
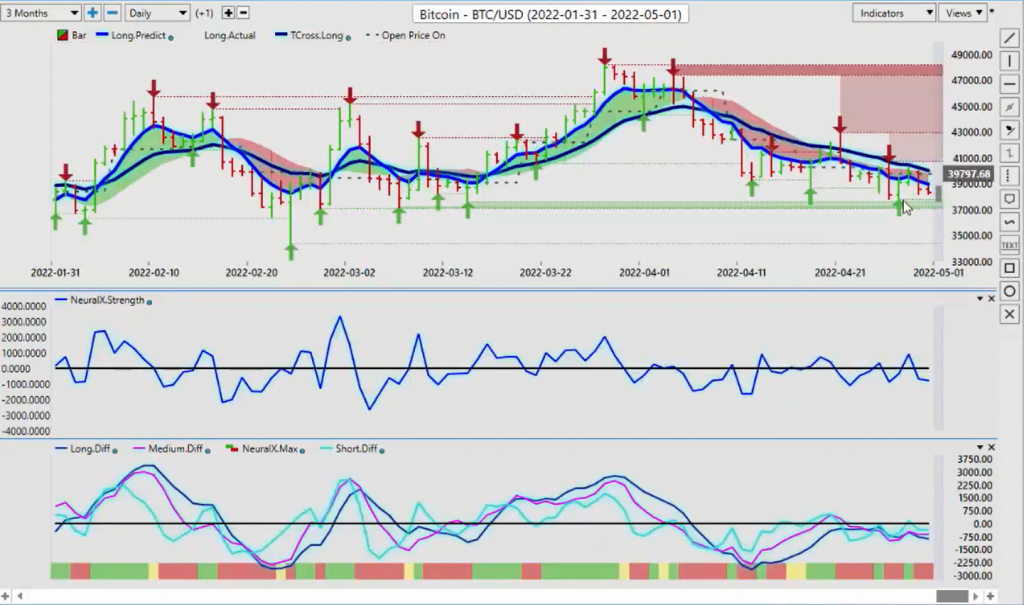
Now, we’ve got a newly formed verified support low on Bitcoin., that’s coming in at $37,762. We’re looking for that area to hold. Now, the inner market correlation that you want to make sure you’re keeping a very close eye on, if you’re a crypto trader, is that can the S&P 500 rebound? In my respectful opinion only, the main driving factor right now is the global stock markets. If they crash, they’re pulling Bitcoin and Ether, and some of the other digital currencies down with it. Watch that level, but again, we’re looking for some kind of signal to buy, but the first matter of business here is we have to hold above that low, at $37,762.
Crude Oil
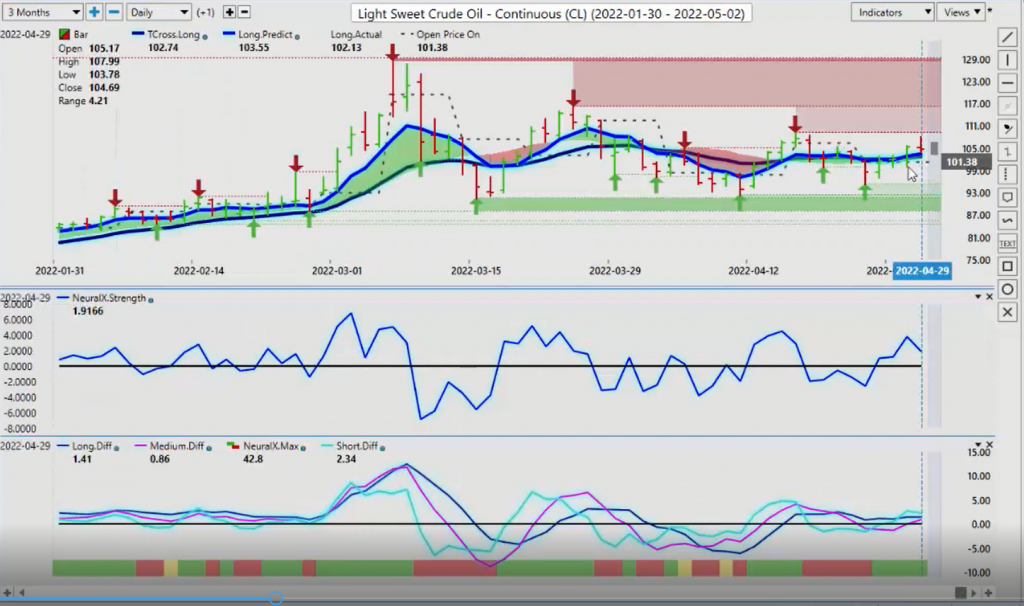
Now, Light Sweet Crude, for next week, we’ve got a buy signal. We’ve held basically above the weekly opening price here for several days. Oil is moving higher, but we still have this verified resistance high coming at $109.20.
That area, if that holds then. And one of the things, again, we’ll be looking for is for some of this volatility to come out of the commodities, but I don’t think we’re there yet. So oil still tipped to the upside, but we are moving in a channel here now. Not a lot of buyers, but we do have some. We’re going to watch the T cross long at $102.74. Long while above that level, if we break down below there, and if we break down below the VantagePoint T cross long, then we would likely be prepared to target the low again of $95.28.
Euro versus U.S. Dollar
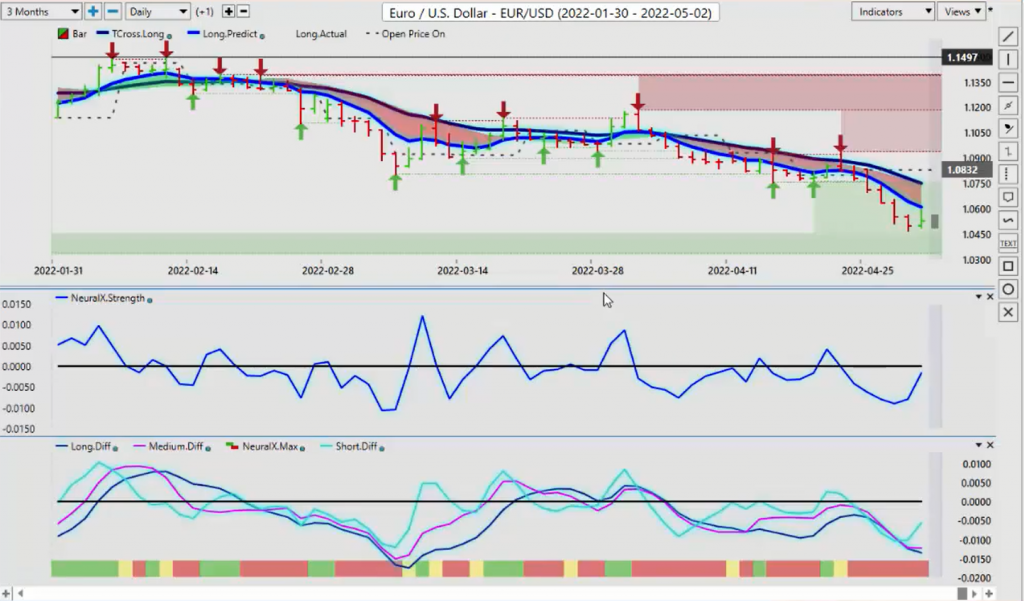
Now, as we look at some of our main forex pairs, we’re going to limit the pairs this week, the Euro U.S. pair, we can see that the neural index strength, while the neural index is still down, the neural index strength is pointing straight up, suggesting that we could have a retracement higher, but that retracement is likely going to be limited to the long predicted at $106.11 or our T cross long.
But the T cross long is up at $107 61. That is the area we want to make sure we’re watching very, very closely. If, and only if, we can clear $106.11. Now, if the U.S. Dollar index does slip and starts retracing lower, that would immediately fuel buying on the Euro U.S. pair, so watch the dollar index very closely.
British Pound versus U.S. Dollar
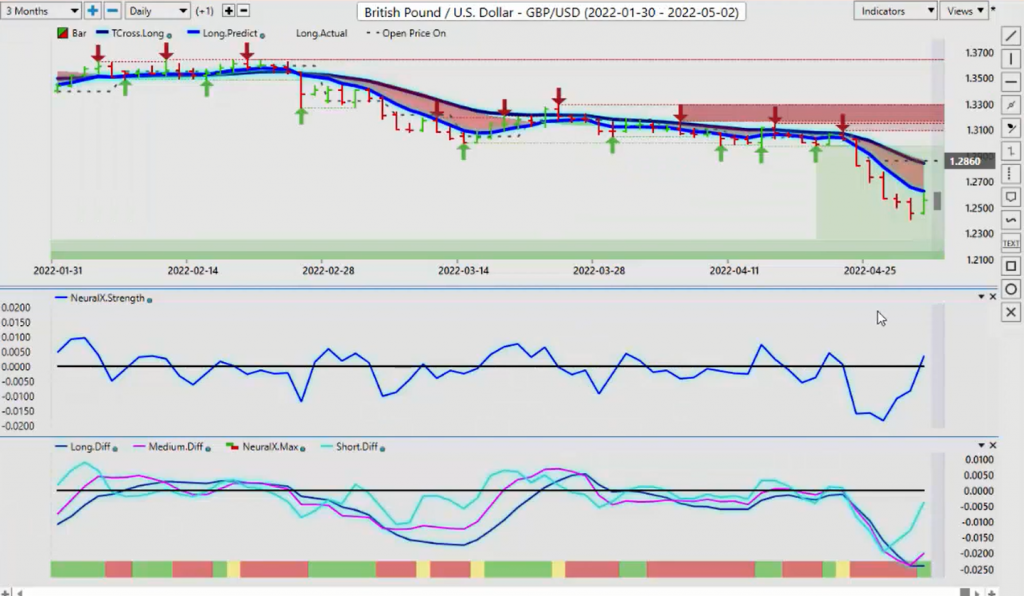
The Pound Dollar next week, once again, we’ve got our neural index strength and we have an MA diff cross, yet another signal that’s pointing towards potential dollar weakness, or at least a dollar retracement. The dollar is in a firm up trend, I would not dispute that, but once again, in any trend or non trending market, nothing goes straight up or straight down. So again, we’re going to see, we’ve got to buy signal or a corrective buy signal on the pound suggesting that we’re going to retrace potentially to the T cross long.
That would take us back up into this 120, essentially the 128.40 level. Now, if we look at that a little closer here, just so you guys can see that move that out of the way. $128.41 is the T cross long $126.30. So in order for us to get to $128.41, we first clear $126.30, the pound, still in an overall down trend below the yearly opening price. So again, anything higher right now is simply a retracement.
U.S. Dollar versus Japanese Yen
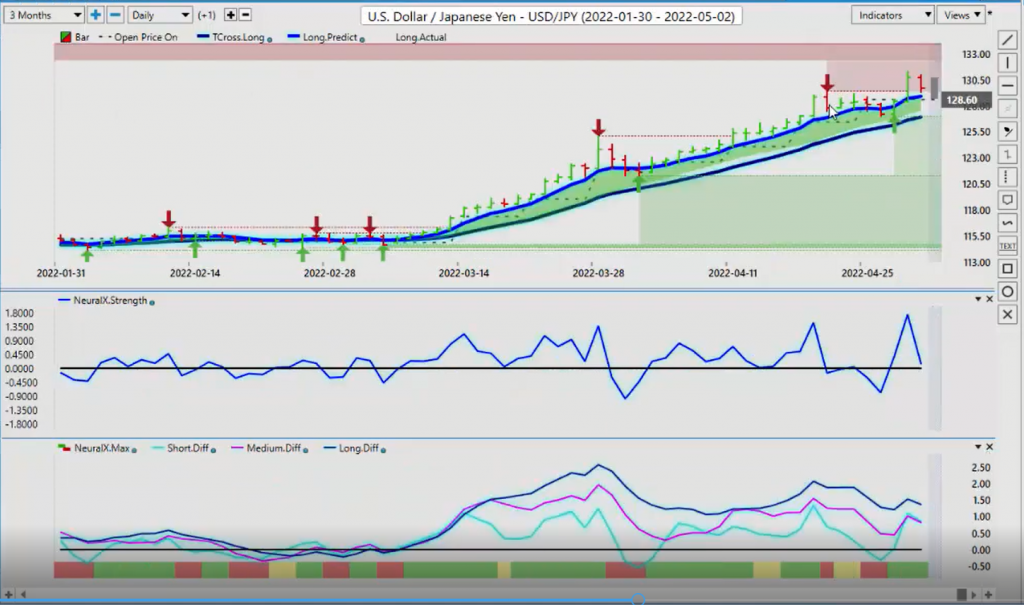
Now, when we look at the Dollar Yen, the Dollar Yen, largely I have avoided over the last several weeks because the price on the U.S. Japan pair is, it would be an understatement to say that it’s exaggerated. And what I mean by that is that the bank of Japan interfering in things, there’s a lot of nonsense going on here. So again, when we look closer at this, we do have a verified resistance here on the Dollar Yen.
That’s coming in about $129 40. So be careful of a bull trap up here. We’ve made a crazy move higher on this based around the U.S. Interest rates, Bank of Japan, but again, not a lot of strength here. Our neural index strength, when we look inside of the neural index, it’s pointing straight down Predicted differences are still above the zero line, but they’re also pointing down suggesting that, if nothing else, we could see a corrective move back down to our long predicted $128.90. Then our T cross long at $126.92 with a very, very weak cell signal, so be cautious but the main thing is, if we have any chance of getting to the T cross long, we must break through $128.90.
Canadian Dollar
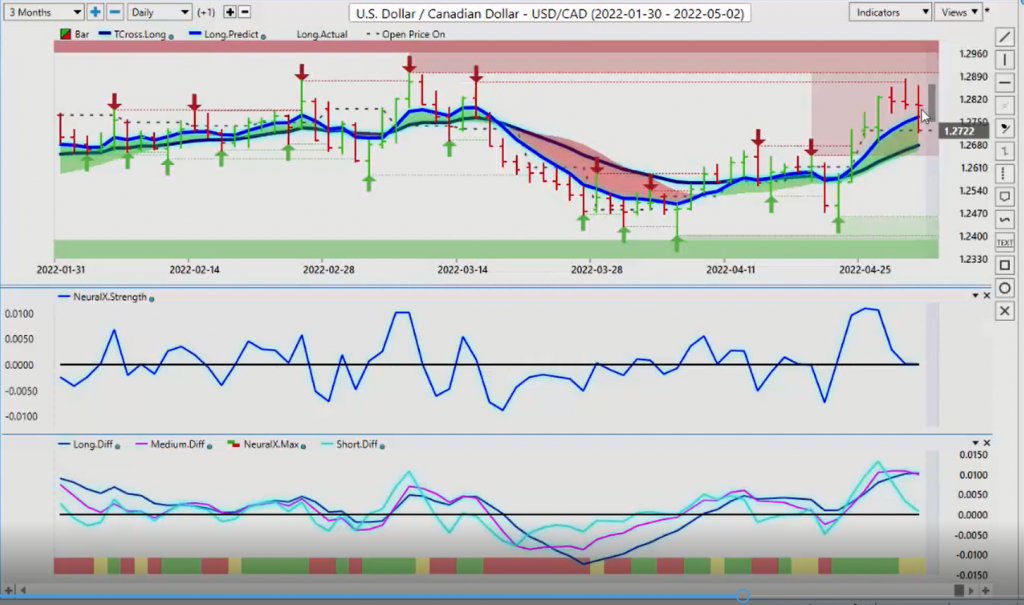
Now, with our three main commodity/equity currencies, when we look at this, the U.S. Canadian pair right now, finishing the week strong.
Now, coming back into the $127.22 area. But, as you can see, we still are holding above our T cross long at $126.77, and we have our yearly opening price at $126.32. This is providing additional verified support here. So the indicators right now, if we look at our MA diff cross, that represents the medium term trend versus the long term trend, but our neural index is yellow here. It’s weak. Now, we’ve come down to the zero line with the neural index strength and we’re turning sideways. So there’s some indecision with a slight downward bias, if we get that dollar weakness, but either way, we would be cautious selling below anywhere near the $126.77 level.
Australian Dollar versus U.S. Dollar
Now with the Aussie in New Zealand, they will largely follow the U.S. Cat in the opposite direction, meaning U.S. Canada down, Aussie U.S., New Zealand U.S. up. That’s the way this game works, guys, with those particular currencies. We are hitting very strong, verified support from February the fourth that coming in at $70.52. You can see that the market stopped right on the VantagePoint verified zone.
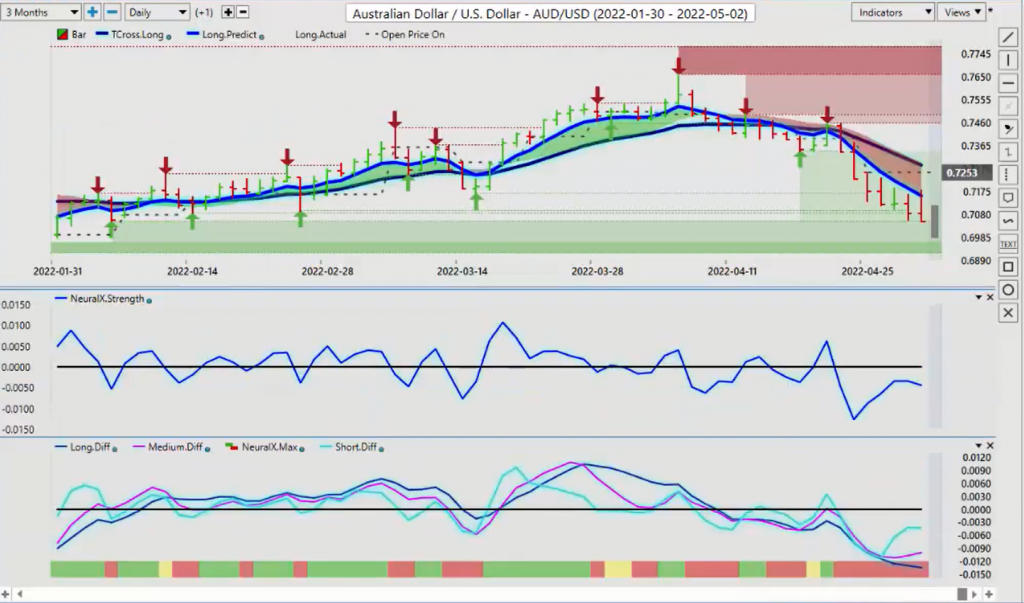
Now, we’ve got our predicted differences trying to rise here, but the neural index strength and the neural index itself are still saying we’ve got problems here. So again, watch out for a bear trap down here. What we need in order to get the Aussie and the New Zealand moving higher, is we need the stocks to reverse the S&P 500 reverse higher. I’m not overly confident at this particular time that’s going to happen, and even if it does, it’s likely just a corrective move. So be careful around this $70.52, but we could have a very good long trade potentially.
New Zealand Dollar versus U.S. Dollar
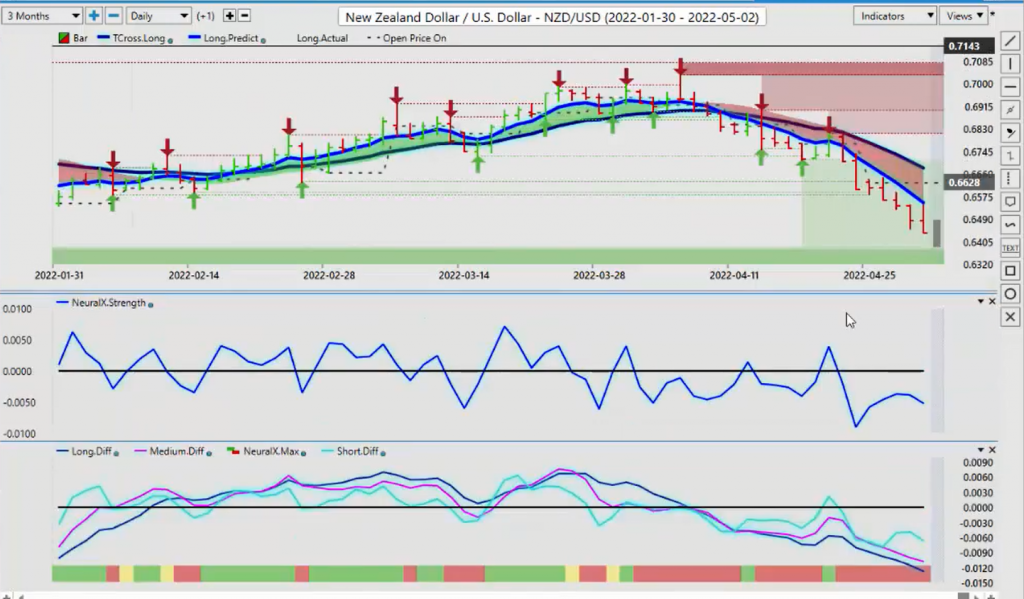
Now with New Zealand, it shows a very different scenario here. Our low there at $65.82, we blew through that this week. New Zealand, clearly the weaker between Aussie U.S. and New Zealand U.S. New Zealand U.S., clearly the weaker pair. So again, that could provide opportunity. When we go back here, look back upwards of a year, you can see that this is a pretty substantial move. So again, my optimism around the S&P 500 remains heavily guarded. And it’s going to continue to cause volatility on these equity based pairs. So what that said, this is the VantagePoint AI market outlook for the week of May the second, 2020