


Welcome to the Artificial Intelligence Outlook for Forex trading.
VIDEO TRANSCRIPT
Hello everyone. Welcome back. My name is Greg Firman and this is the Vantage Point AI Market Outlook for the week of May the 23rd, 22nd, excuse me, 2023. Now to get started this week, we’re going to look at direct intermarket correlations in what’s sure to be a volatile week, a holiday short week next week. We have a holiday in Canada. We’ve also, I believe, have a holiday in the US, Memorial Day. So we’re going to see some volatility. Probably Tuesday, Wednesday are going to be your better trading days. But let’s look at our direct intermarket correlations.
U.S. Dollar Index
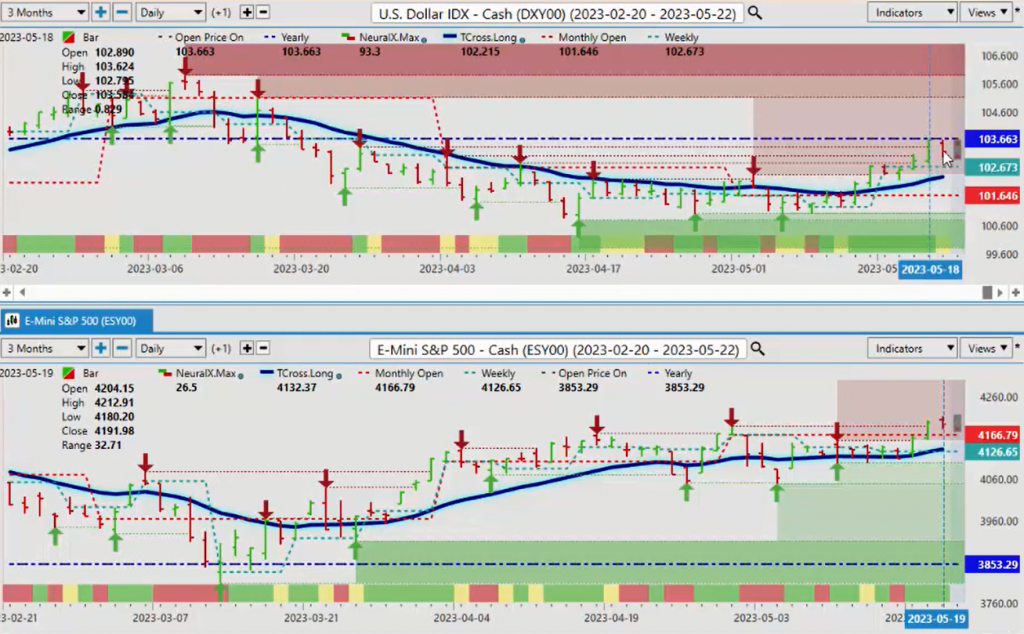
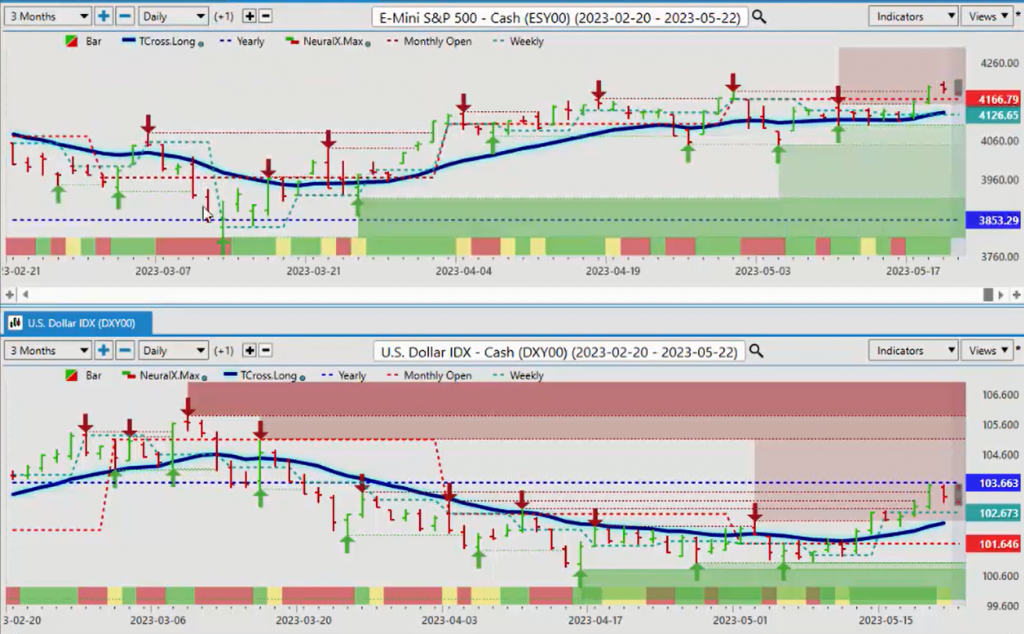
Now, the one that we really want to keep our eye on next week, the Dollar Index has come up directly to the yearly opening price, 103.66, and then we have failed on Thursday and we failed again on Friday. Now the fact that we’re up here, the US debt ceiling, I’m a little surprised that stocks are up here also. But the main thing is we want to make sure we’re identifying what the primary trend is. The primary trend on the dollar is clearly down, while below that yearly opening price. And the primary trend on the S&P 500 is primarily up, while above that very important yearly opening price.
So again, our key levels from Vantage Point that we want to keep an eye on, is next week. I believe whether the dollar can make a sustained break of 103.66 will determine the next move on stocks. If we fail at this level again, or we can’t maintain above that, then the S&P is likely to accelerate higher. We don’t have a lot of verified resistance zones up here, but the main thing we want to do, is identify our support levels. We’ve got our TCross Long on the Dollar Index that’s coming in at 103.66, the S&P 500, the TCross Long 41.33.
So the theory here is that the primary trend with the S&P 500, we would be buyers down here, we would be sellers of the dollar up near the yearly opening price until such time as we can break higher you. We can assess here that the Neural Index has turned yellow on the S&P 500, but we’re still basically green on the S&P. The dollar is the one that basically is going to have to fight its way through here.
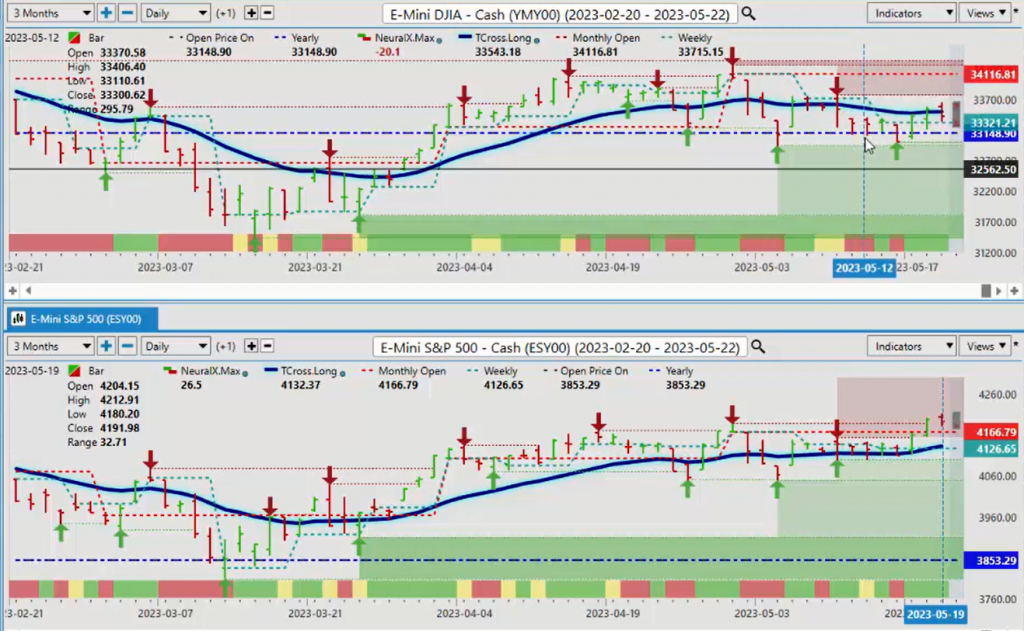
Now, when we look at the additional equity markets, the Dow Jones Industrial, we can see that we’re getting some good buying here off that yearly opening price. Now again, what I’ve talked about in previous sessions, we don’t want to look at things from an annualized basis. Going back to, for example, May the 20th of 2022, that would be a lagging tool or a lagging indicator.
We want to use the current yearly opening price, because that, as you can see, is where we’re getting the buying, is right at that particular level. Now, we’re still not crossing above the TCross Long, that level there is 33,495. We need to move above that in order for the Dow Jones to pick up some sort of momentum here. But that will be largely dependent on whether we can stay above the monthly opening price 4166 on the S&P 500, and of course, that very important vantage point TCross Long at 4132.
NASDAQ versus S&P 500 Index
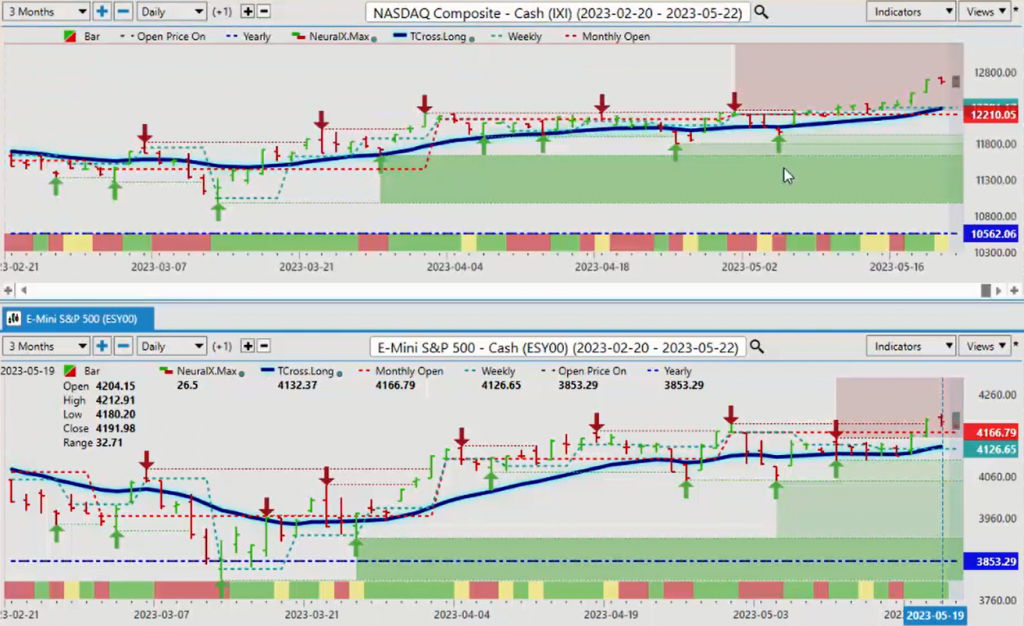
Now the NASDAQ down a little bit here, but still having a very good year and a very good month. Now, when we look at this right now, we’re remaining, we’ve been positive on the month since about May the eighth. Now we’re holding at that same time, we’re holding above the Vantage Point TCross Long, that’s coming in at 12,293 we remain long while above that price.
The primary trend on the NASDAQ, two of your stronger indexes this year, clearly, the NASDAQ and the S&P 500. So again, the main thing we want to really understand, is we have about a 98% positive correlation here.
Russell 2000 versus S&P 500 Index
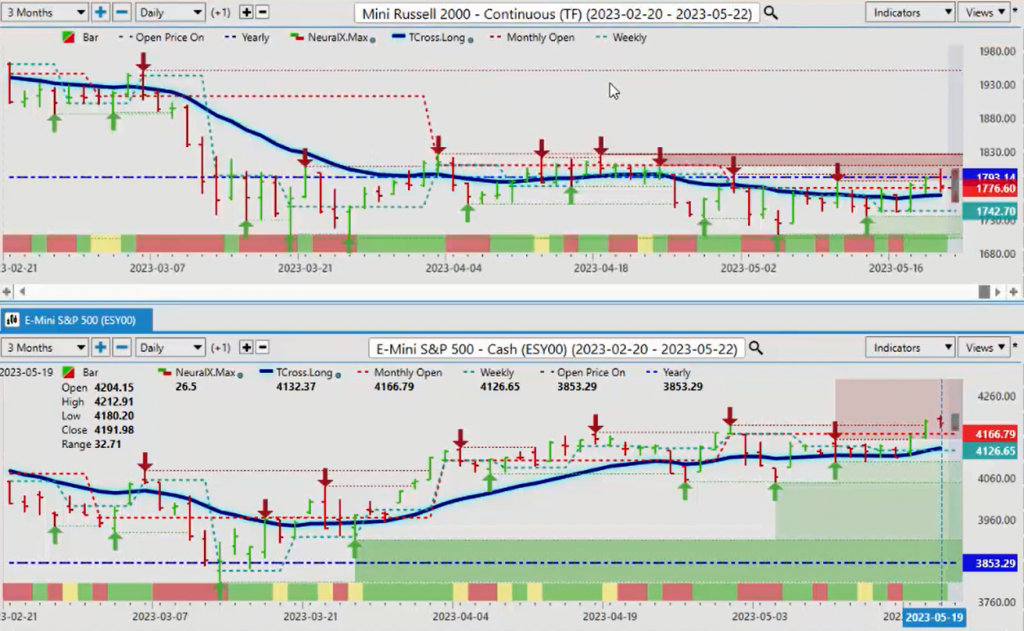
Now, when we look at the Russell, the Russell has been the weaker of the group. You can see that they’re not really buying this. We’re coming up against this vantage point, the point in time indicator, which identifies that yearly opening price, that level at 17.93, unable to really hold above this for the last several weeks. But we are pressing against it again. So if we can get above the yearly opening price, 17,093, continue to hold a above the Vantage Point TCross Long at 17,066, then we could see some buying opportunity here. Now, the correlation between these two, I would drop this down to about 60, between 60 and 70% positive correlation. The Russell 2000 has not experienced the same types of returns.
DJ Euro Stoxx 50 versus S&P 500 Index
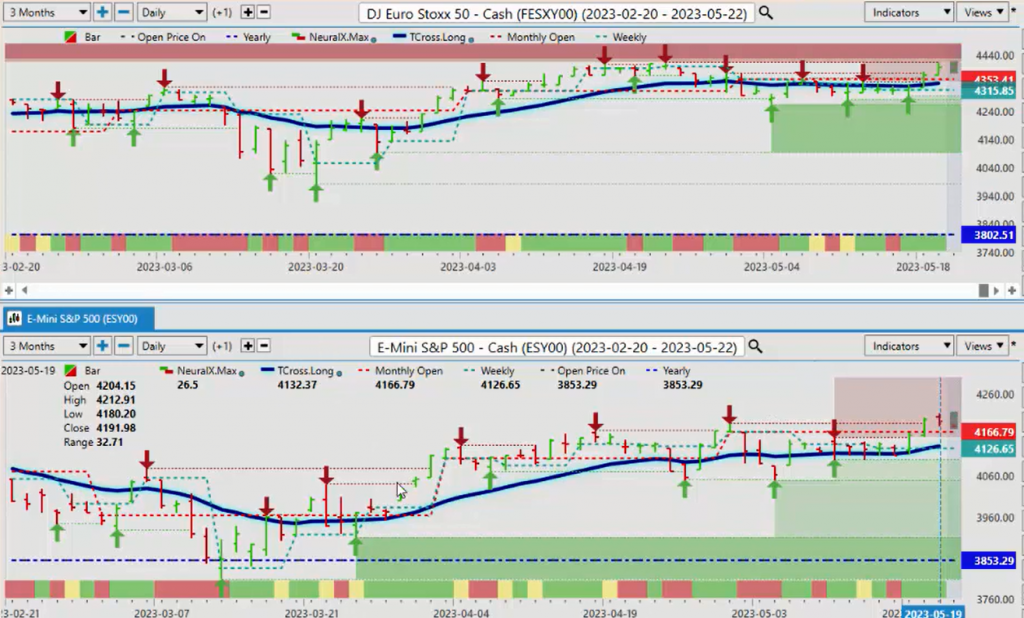
Now, when we look at the Dow Jones, the Euro Stock 50, again, even though it’s a European market here, we can see that there’s about, I would argue about a 90, between 80 and 90% positive correlation. So as long as the S&P 500 can continue to advance, that would tell us that the Dow Jones will likely go higher also. The NASDAQ will go higher. Maybe the Russell will catch up to it, but it’s not the better buy there. But the Dow Jones Euro Stock 50 will follow.
Nikkei 225 versus S&P 500 Index
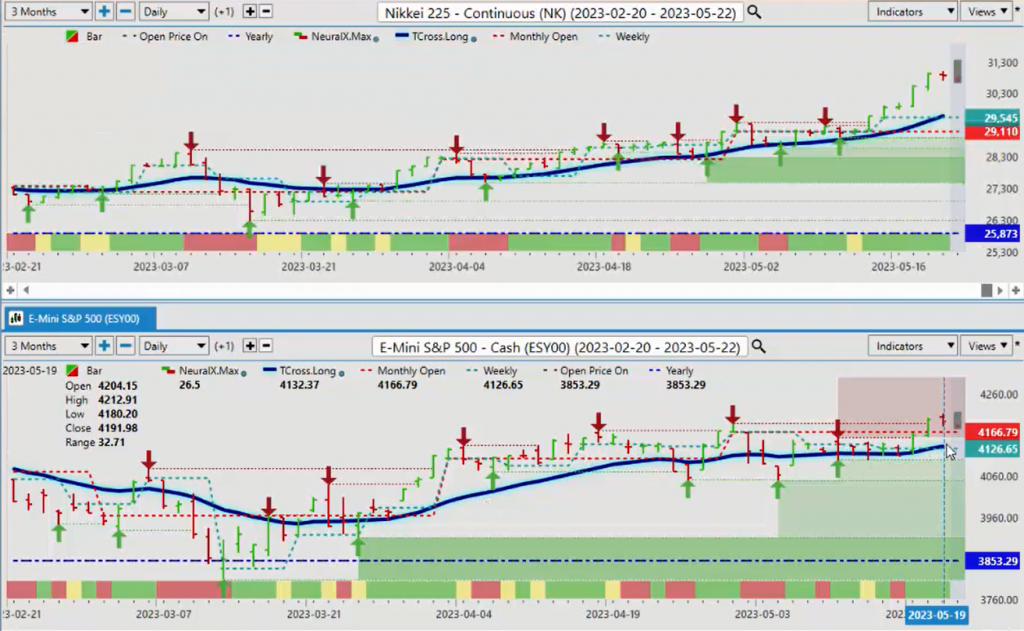
When we look at the Nikkei, the Nikkei and the S&P 500, they’re virtually identical. So in short here, guys, we can trade the global markets and measure them off the US S&P 500 market. Very important that we’re doing that.
$SPY versus $SPX
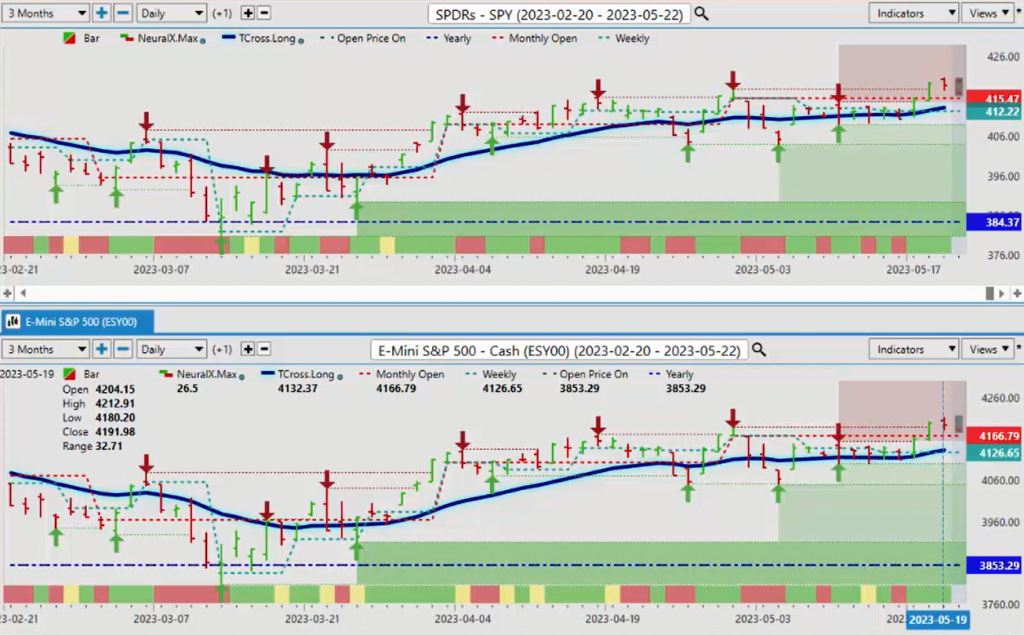
And of course, the SPYs, when we’re using an accurate way of measuring performance, the start of the month, the start of the new year, the start of the new week, then this is what we would do. You can see that the SPYs essentially started to gain strength here on Tuesday. Then on Wednesday and Thursday, it uses that weekly opening price and the vantage point TCross Long at 411.67 to accelerate to where it finished the week very strong. So for next week, we would look to do the same thing we’ve closed at about 418. We would look for the market to stay above 418 next week. That very important weekly opening price, excuse me, that’s 412 on the weekly.
But next week where we’ve closed here, we will be about 418.62. By midweek, we want to make sure that we’re holding above that particular level. And of course, we’re using an accurate performance level. Where are we in the actual month of May? The month of May so far for the SPYs has been very good. We want to continue to monitor this. But again, that direct intermarket correlation, or inverse correlation to the Dollar Index is an important one, right?
$VIX versus S&P 500 Index
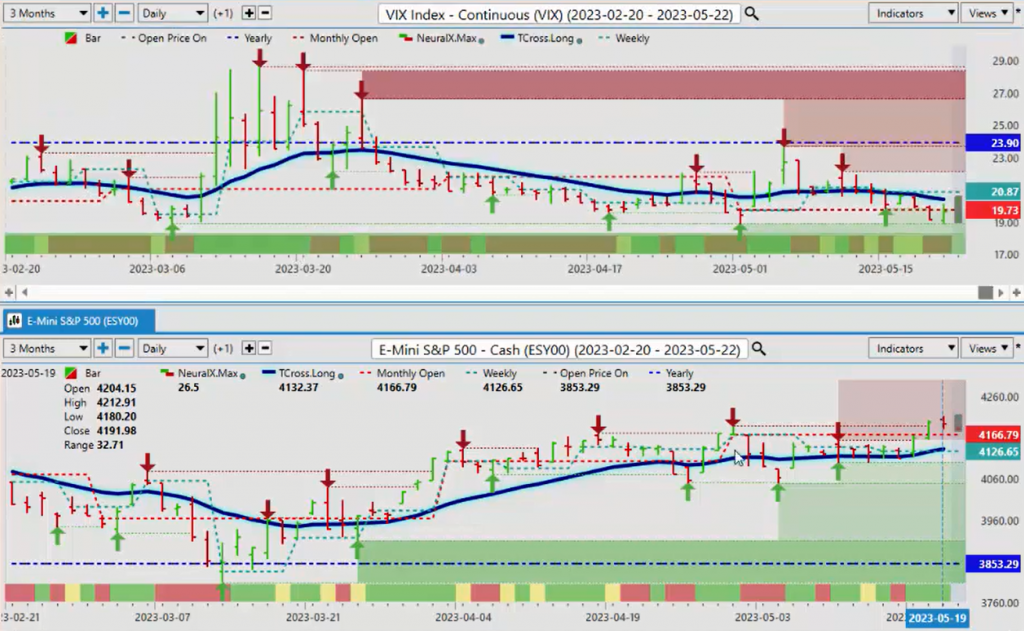
When we look at the VIX, again, you can see as the S&P 500 turns up, the VIX turns down, but the VIX has been below the vantage point TCross Long and the yearly opening price the majority of the calendar year, it’s never, the VIX has never really had a big move.
So right now, that key level on the VIX is going to come in at or about the TCross Long 20.40, shorts into that area. Remain the better play.
S&P 500 Index versus U.S. Dollar Index
Now, as we move over into some of our main Forex pairs, we can go into here, create the Forex portfolio, split the screen the same way, so we get a better of idea how we want to be trading the Forex market. But the one thing that is extremely relevant, is that in the Forex market, we’re either buying or selling US dollars. That is primarily what we’re doing here, guys. So when we look at this right now, the single most important thing, that correlation that we would look at, would again be the S&P 500, because we’ve had a known inverse correlation. Now for the last week or so, they’ve both been moving up, the S&P and the Dollar Index, at the same time, in my respectful opinion only this is unlikely to continue.
One is going to break higher and one is going to break lower. The odds would favor the dollar breaking lower once the debt ceiling is resolved, and we get more into a risk-on environment. But for now, if we look at the Dollar Index and we do a direct comparative analysis to the Euro-US pair, then as the dollar approaches, its yearly opening price, the Euro at the same time, which is a 100% inversely correlated to the Dollar Index. If the dollar can’t break through this level, then the Euro is likely going to rebound. So we would look for that midweek, probably late, midday Wednesday, I would say. Because remember, the US is out, Canada is out on Monday. So don’t go by, don’t think that Monday is a true price, because it’s not. So right now, the further the market pushes away from the TCross Long on both the Euro and on the Dollar Index, the more likely it is they’re both going to retrace back to that particular level, that level on the Euro, the TCross Long, 109.05.
So we would look for a potential move back towards that area as early as next week.
U.S. Dollar versus Swiss Franc
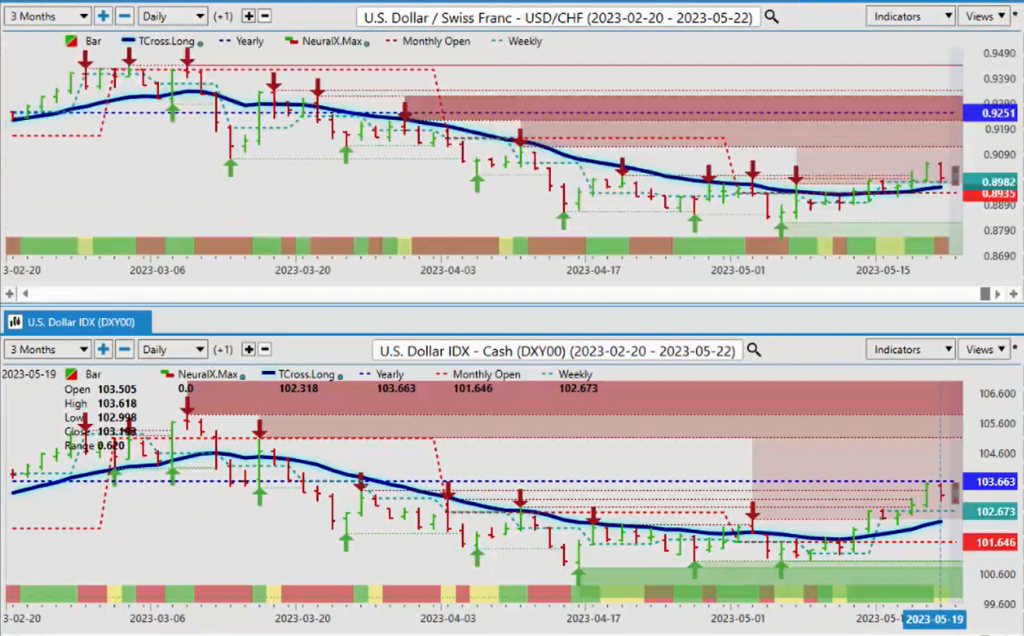
Now with the US-Swiss Franc, again, a very strong correlation to the Dollar Index. As you can see, as the Dollar Index starts to move higher, even the Swiss Franc has started to lose ground. So again, we look at that TCross Long, that TCross Long that’s coming in at or about the, once again here, when we look at this, about the 89.61 area. But you can see that the US-Swiss Frank is very negative on the year, 92.51. We’re up at closing the week here out at about 89.90 approximately. So still very bearish on this pair, even though the Dollar Index has had a pretty good move up. The US-Swiss Frank has followed, but we’re still a long way off that yearly opening price.
So if the Dollar Index can break through here, then your long, this would be an excellent potential payer for a long trade. But only if the Dollar Index can take out that yearly opening price at 103.66. Indicators right now, not overly bullish on the US-Swiss Franc, and I believe that the AI is picking up on some of the things that I’ve mentioned.
British Pound versus U.S. Dollar
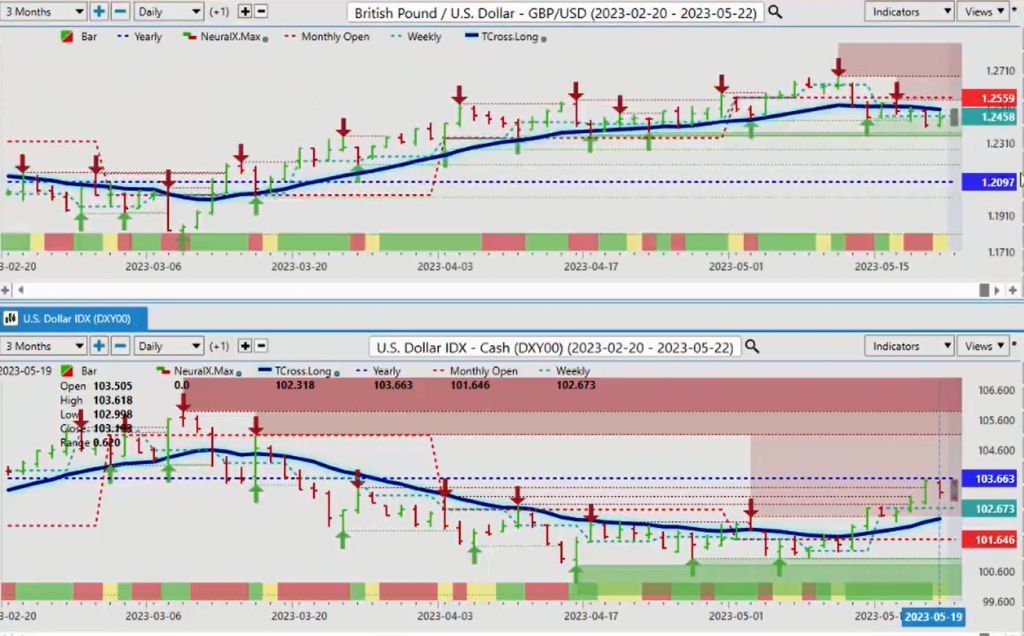
Now when we look at the Pound-Dollar, the Pound-Dollar, again succumbing to this dollar strength, but there is a big difference between this. The Pound is positive on the year, indisputably, we’re above 120.97 while the Dollar Index is negative on the year, lose still losing money on the year. If you bought dollars on January one, you’re still losing money. You bought them on the Pound-US Dollar on January the first, you’re still making money, even though it’s down on the week.
So for next week, we watch the verified resistant, or support zones, excuse me. They’ll come in at or about the low 123.67, some additional ones down to 123.45, and one final one that I would watch, which is about 122.75. We’re likely going to come down to this area before we bounce out of here. But if we lose that level, then you can expect this pair to test the 120.97 area.
U.S. Dollar versus Japanese Yen
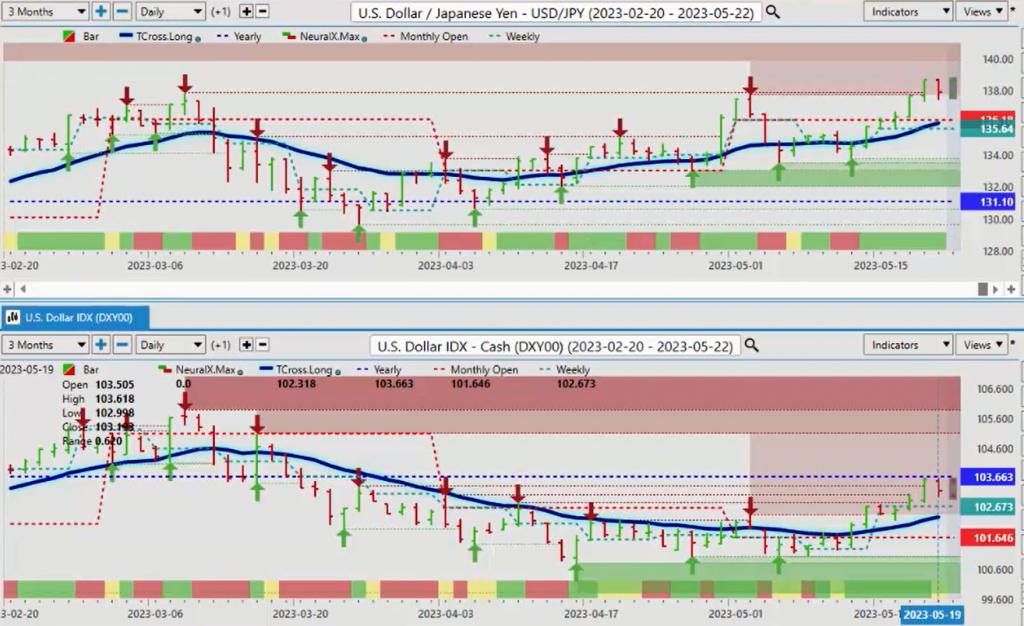
Now, the Dollar-Yen is really caught a bit again here on the chatter of the Fed having to hike more, inflation’s not coming down. This is potentially a bull trap up here. You want to be very careful up around this 137.70 area, 77 area, because again, we need a clean break of this area. If the S&P 500 turns lower, and the dollar actually moves higher, it’s unlikely the dollar will make gains against Japan, because we would go into that risk-off scenario.
So a retracement, back to the TCross Long at 136.01 next week cannot be ruled out. We’ve had a long stretch here, which has been bullish on the neural Index. The second that thing turns red, guys, look for a potential short.
U.S. Dollar versus Canadian Dollar
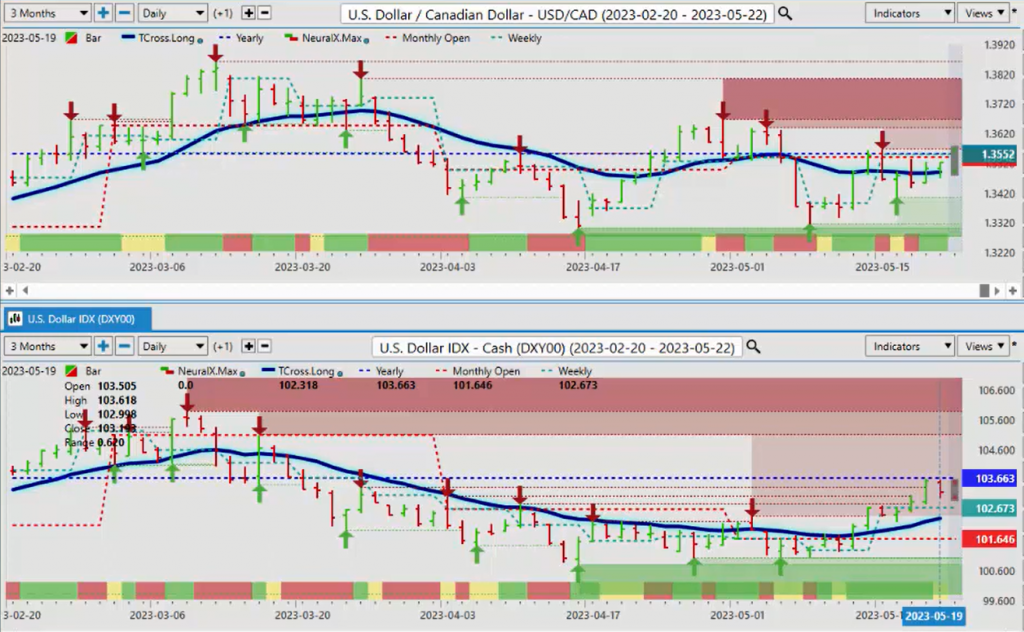
Now with the US-Canadian pair next week, once again, we’re still holding firm. The last two weeks here, guys, they’ve been almost identical in the way that US-Canada has responded to the yearly and the monthly opening price. We come down, we come back up, we go back down again, and then we come back up at the end of the week. So the bias for this pair with a strong seasonality in oil this month, I didn’t look at the other oil chart, sorry there, but I can bring it up here. But the oil is in a relatively strong seasonal pattern right now.
It’s down somewhat, but you can see this past week, it was actually quite bullish. We’re below the TCross Long, but the market was buying, every time we came down to the weekly opening price, they were picking it up right on that level. But then we’re using the Vantage Point TCross Long to identify where that resistance is. So we’ve got to get over this hump, so to speak, to open the door back up towards this 80.73 area, which ultimately I believe we will get to. And if that is the case, then US-Canada will follow oil price. The Canadian Dollar, excuse me, will follow oil prices, and you will see the pair continue to slide. But we need stocks going higher, and we need oil contracts going higher to confirm that a short trade is still viable here, while under the very powerful yearly opening price, which is again, 130, or excuse me, 135.51.
And this is again, the benefit of using the proper performance measurement, by using the current yearly opening price, not an annualized one. Because again, we don’t want to be picking random dates in the middle of the month, or in the middle of the year going from May 20th, 2022 to May 20th, 2023, because that would be a lagging tool. And we’ve seen how lagging that tool is back in March of this year on multiple different markets, where it showed a bear signal when an actual fact it was bullish. So always remain current with your opening prices. So you can gauge that and you can pick up on some of the low-hanging fruit. And my argument would be last week, the oil contracts, why they had talked about it being bearish, in actual fact, it was moving up quite nicely.
Australian Dollar versus U.S. Dollar
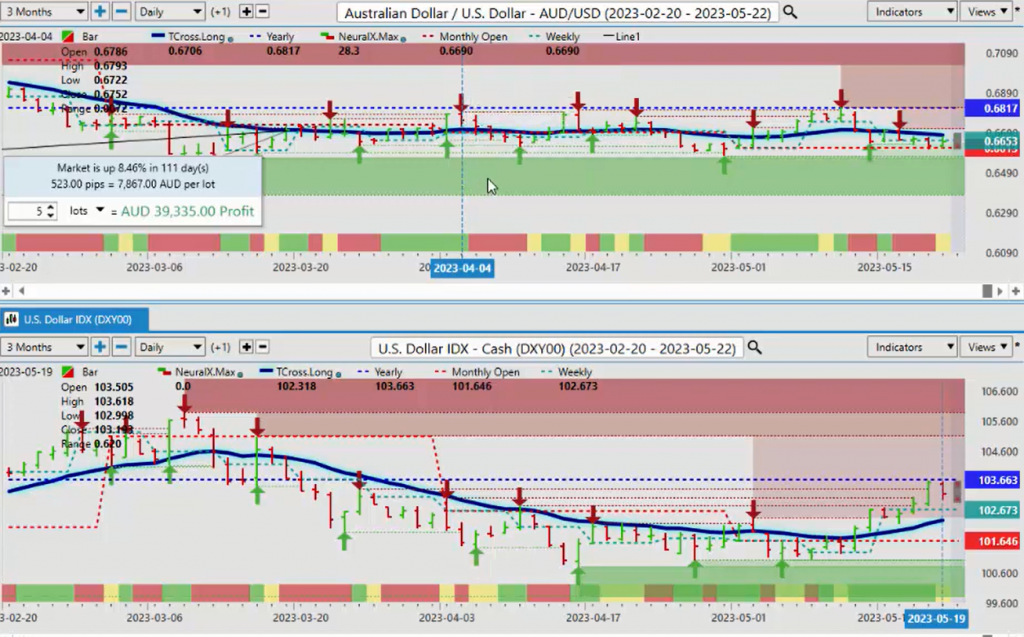
So when we look at the Aussie and the New Zealand, both of these two pairs are also equity-based currencies, I would argue. So right now, when we look at this right now, the Aussie keeps rejecting the yearly opening price, multiple times. And another way of evidencing how strong using the current yearly opening and the current monthly opening price, and even the current weekly opening price is, because as you can see, the Vantage Point TCross Long provided that resistance all week. And then we started breaking down below the weekly. But the monthly opening price remains, provides us with that additional support of 66.13, and we can carry that support level with us the entire month of May. So we were looking to hold above that if we’re going to continue to buy this pair. But what traders need to know, is the very high positive correlation the Aussie has to the S&P 500, and the global stock markets.
New Zealand Dollar versus U.S. Dollar
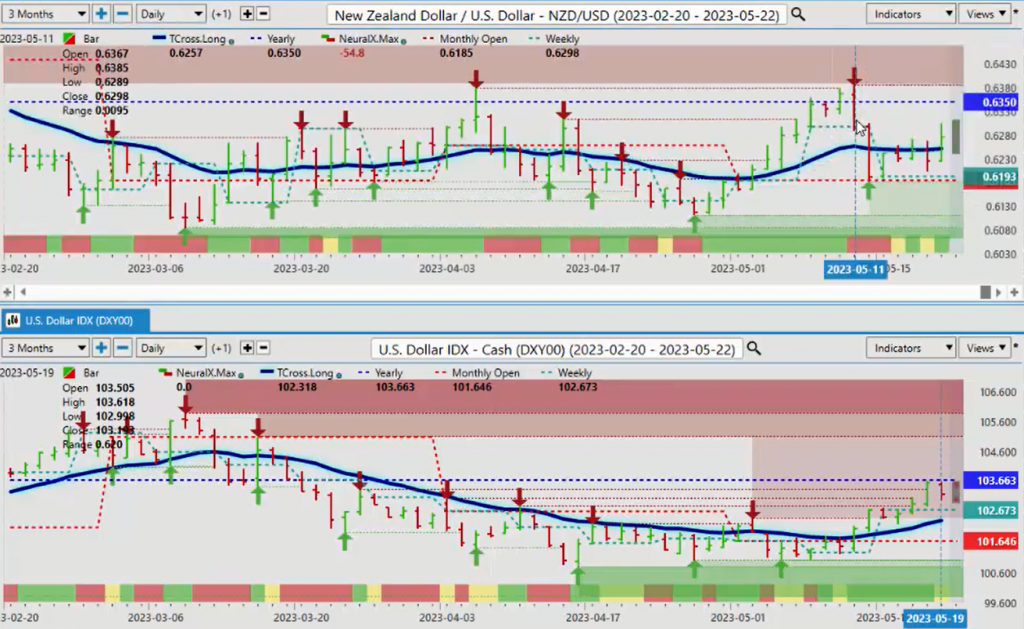
The same would apply to New Zealand. The New Zealand has had multiple failures at the yearly opening price this year. But right now, the monthly opening is providing that support. You can see that the Neural Index, when the Neural Index turns green, we look to buy this thing based, but we do need to stay positive on the month. If turn, if we’re negative on the negative on the year, and we turn negative on the month, then we need a reason to be buying these pairs. So we buy Aussie-US, and New Zealand-US if we have that support from the inner markets, more specifically, oil contracts, equity contracts. These are what fuel these equity-based currencies. So with that said, this is the Vantage Point AI Market Outlook for the week of May, the 22nd, 2023.


