Welcome to the Artificial Intelligence Outlook for Forex trading.
VIDEO TRANSCRIPT
Hello, everyone. Welcome back. My name is Greg Firman, and this is the VantagePoint AI Market Outlook for the week of May 9, 2022.
U.S. Dollar Index ($IDX)
Now to get started this week, we’re going to begin where we always do, with that very important US dollar index. Now, indicators we’re using this week, I’ll let everybody see what we’re doing here. Bars, not candles. We’ve got the long term crossover with the black line removed. Short, medium, and long term predicted difference with the neural index and the neural index strength. Point in time, we’ll be looking at the weekly opening price from this previous week. And of course the triple EMA cross modified leaving only the T cross long and of course, the very popular verified support and resistance zones.
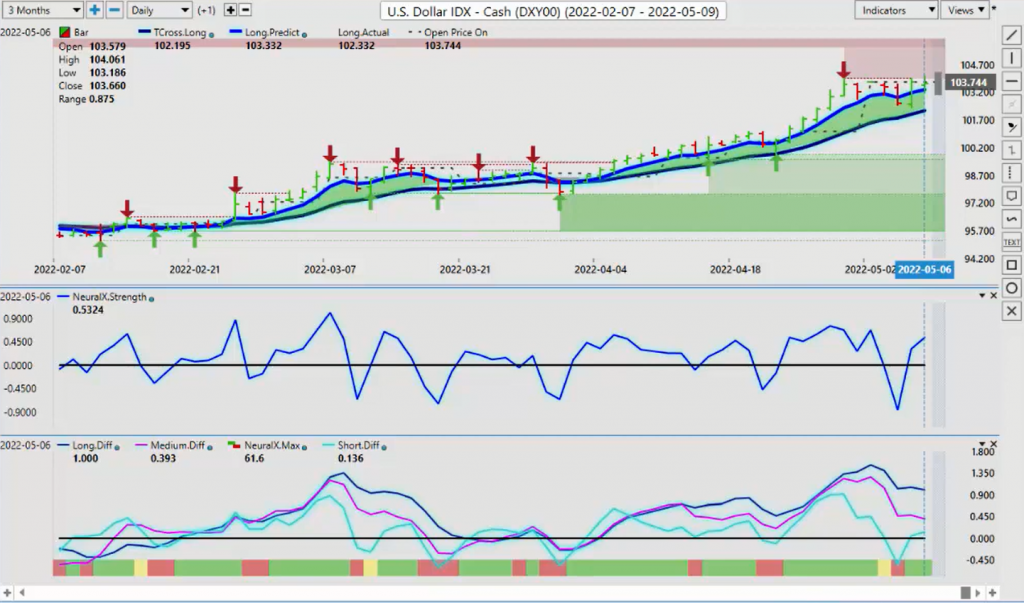
So when we look at this, the dollar, while the dollar bulls are still out, and they’re talking about further dollar strength, we can actually see the dollar did not really have that great of a week. At least the index didn’t. Now, when we look at that point in time of 103.74, you can see that we’ve stayed below that for the better part of the week. Now we’re holding above our long predicted at 103.32, but our T cross long is 102.19.
Now I believe that there is room for a retracement back to this level, the known seasonality, or maybe not known, I’ll share it here is that the dollar rally ends, on or about the May the 12th. Now there’s a number of factors that could keep the dollar strong against certain pairs, but maybe not all. So again, we’ll be watching the 12th. Between the 12th and the 14th very closely, because again, that’s usually when dollar buying tends to dry up. Now, with it unable to break through this weekly opening price and staying below there, that could be a warning sign.
Our neural index is still positive with green, as is the neural index strength. But our predicted differences are losing momentum here. The short term predicted difference, actually breaking down below the zero line, that represents a short term crossover. But we can see that we cross down and then back up again. But if the medium term predicted difference can cross over the zero line, that could spell a bit of trouble, at least in the short term for the dollar.
Gold
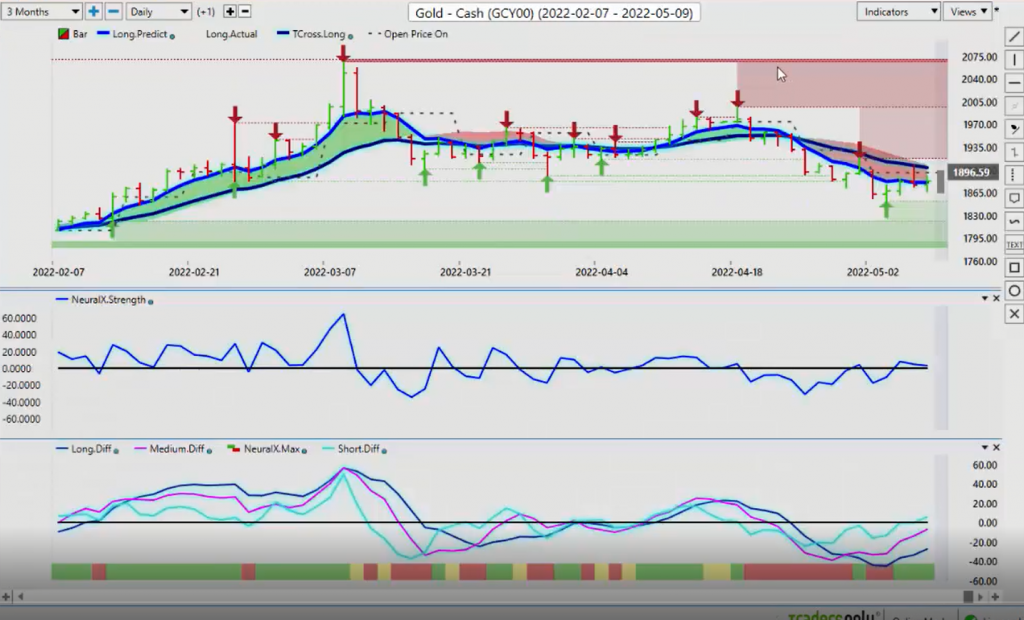
Now with gold, gold, also not having that great of a week, holding below the weekly opening price at 1896, but still finding some support near the VantagePoint long predicted. Now we also have the yearly opening price coming in at about the 1815 mark. In my respectful opinion, that’s the level you want to watch just above the 1800 mark. Now our neural index strength is pointing higher. We do have an MA diff cross, which is our medium term crossing our long term predicted difference, but we must clear the VantagePoint T cross long that’s coming in at or about the 1904 level. If we can clear 1904, then we would see gold make further gains. But again, we must push through that level. Right now, this is pointing to a retracement hire and not a new trend.
S&P 500 Index
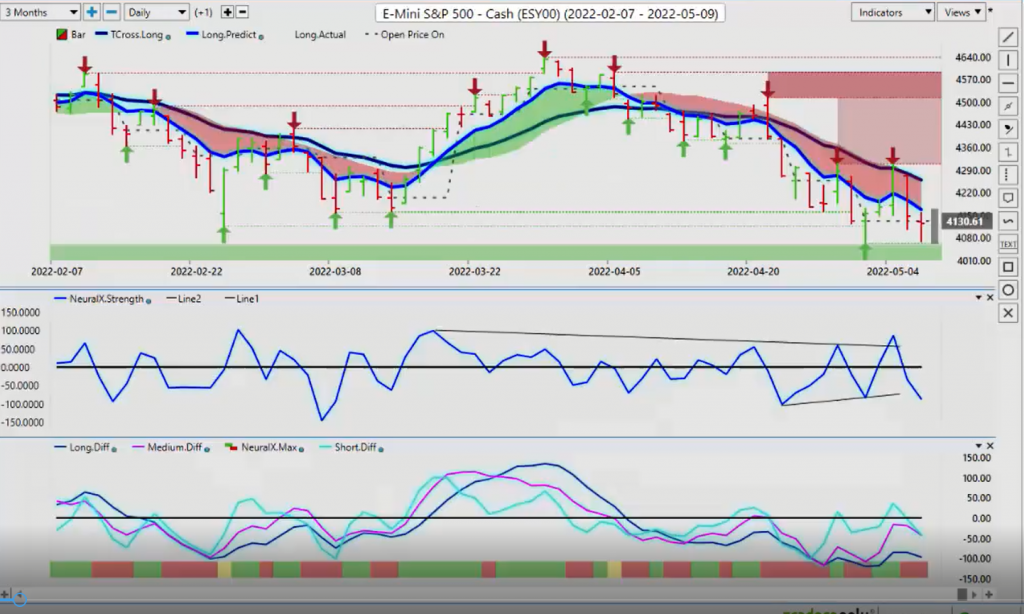
Now, the month inflows coming in to the S&P 500, they were basically fairly bullish for at least part of the week. But the reversals on this particular index are really quite frightening when you look at them. Great, big move up and an equally as big move down. But what I will point out to everybody is, again, we’ve got the the T cross long, which is that former 18 day predicted moving average from VantagePoint. Like a moth to a flame, the market will retrace to it, but it’s also used as a pivot level for shorts. The primary trend clearly is down, but the S&P actually did have a couple of up days last week. And you can see that using the weekly opening price here, along with the neural index. But finishing the week rather ugly as we set a new low for the year down at 4062. But again, I will point out that was on a holiday thin market with the UK markets out on Monday. So as they say, when the cats away the mice will play. And sure enough, they drove this thing right back up.
Now part of that was on the Fed comments. I think it’s safe to say that a three quarter basis point is off the table. Powell is saying 50 basis point hikes are on the table, but under his breath, he did say it could be a quarter basis point. So again, that’s a bit of a crack in the dam for the dollar rally here, because the market was counting on actually three quarters of a percent to a half a percent going forward on every Fed meeting. And he really did throw some water on that, which I figured he would.
So for now, with the S&P 500 clearly shorts are in play, but there is again a seasonality with this where the S&P actually doesn’t do too bad in the month of May and into June and July. I believe it’s probably August before we turn around on this, because we are in the primary election year. That’s also a known seasonality there too, that during an election period, the S&P anyway, doesn’t do well. So again, we’ll watch this newly formed, verified support low that’s coming in at 4062 to see if we can stay above that for the week. And we could see a bit of relief on the equity side.
Crude Oil
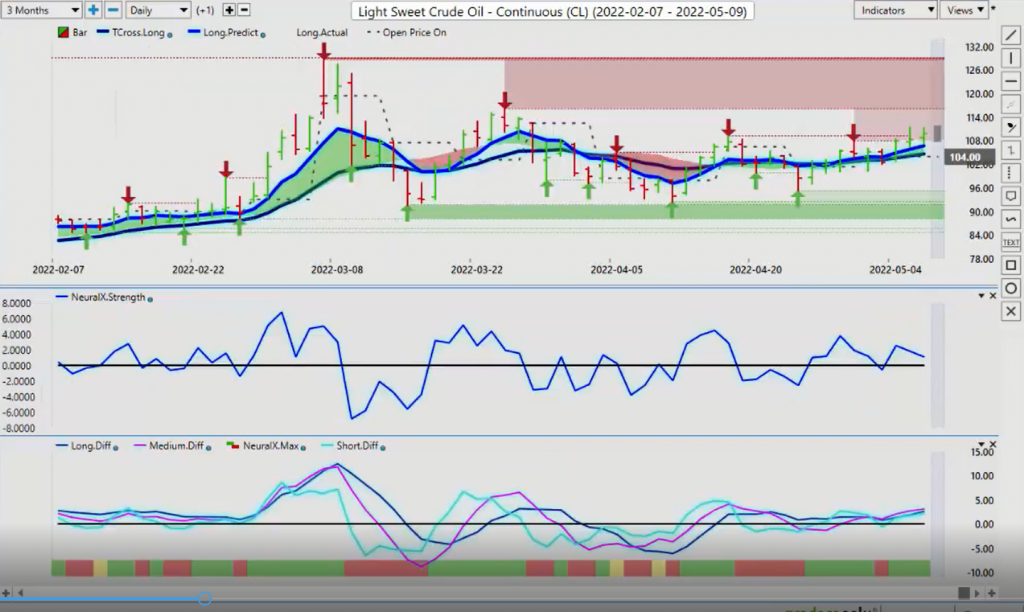
Now, as we look at light sweet crude oil, light sweet crude oil, again, we’re starting to move back up again, but I question how much upside is really here. We’ve got the verified resistance high at 116.18. I don’t think we’re going to see another test of these ridiculous levels at 128, but I can’t rule it out either. So again, the immediate resistance zone that we have to clear is again, around 109.20. The indicators are a little bit mixed, but they are still positive suggesting that oil can continue its advance.
Now, with that known seasonality of the dollar losing momentum in the month of May, around the 12th to the 14th, we can see very heavy support building up around this, just around this 104, approximately the 104.50 area, just simply no sellers down here. So usually when I see this kind of support building, one of two things is about to happen here, guys.
Euro versus U.S. Dollar
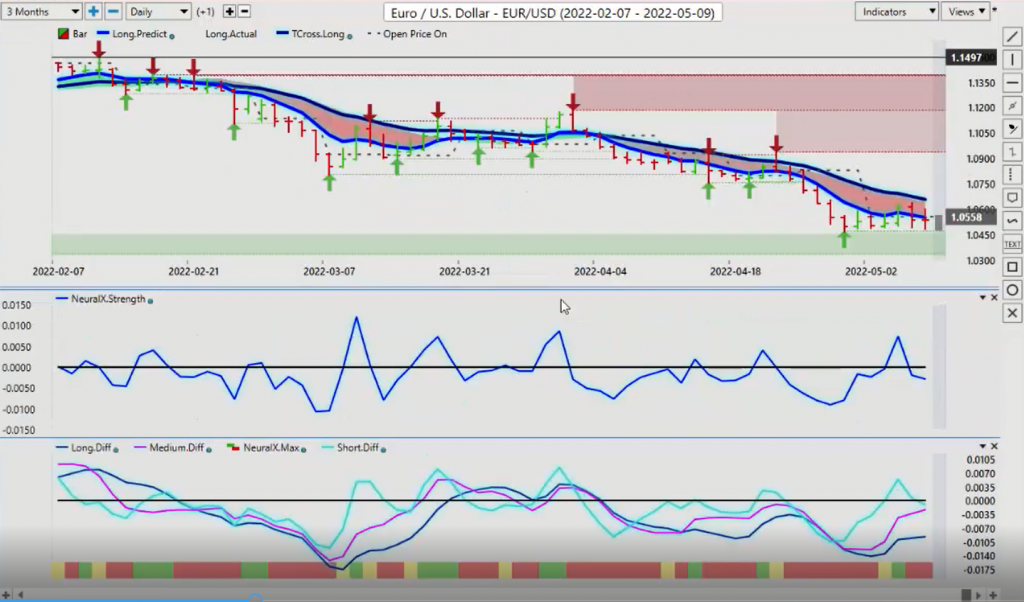
A false move lower on Monday only to reverse higher, or the Euro is getting ready to break above the VantagePoint T cross long. That level coming in at 106.61, we got close to that on Thursday, but we’re traced back down.
But again, very heavy support. The immediate indicators here are quite mixed actually. The neural index and the neural index strength are down, but the MA diff cross is up, the medium term predicted difference is rising, suggesting that a crossover is close. So I would watch for a potential, only a potential reversal on the Euro higher this week, even though I’m fully aware there’s very little fundamental reasons for the Euro to go up. But if you look at the Euro cross payers this past week, Euro Swiss franc, Euro Great Britain, Euro New Zealand. They had massive rallies this past week. So there is Euro buying out there. We just need to be more specific, which pairs we go after. But if money flows keep going into those Euro cross payers, that will indirectly support a Euro rally, even if it’s only corrective in nature.
But I suspect we could retest the 106.61. Now on a side note with the nonfarm payroll number, the number was pretty good. But I would direct everybody to the U-6 number. The U-6 number is actually going up. It’s actually stalling. We’re sitting around 7 million. We’re really not going either way or the other. So again, that’s a little concerning to me actually, for rate hikes going forward. But I’ll continue to monitor the next payroll number and see if that U-6 number can continue to move lower, but it is stalling in 2022.
U.S. Dollar versus Swiss Franc
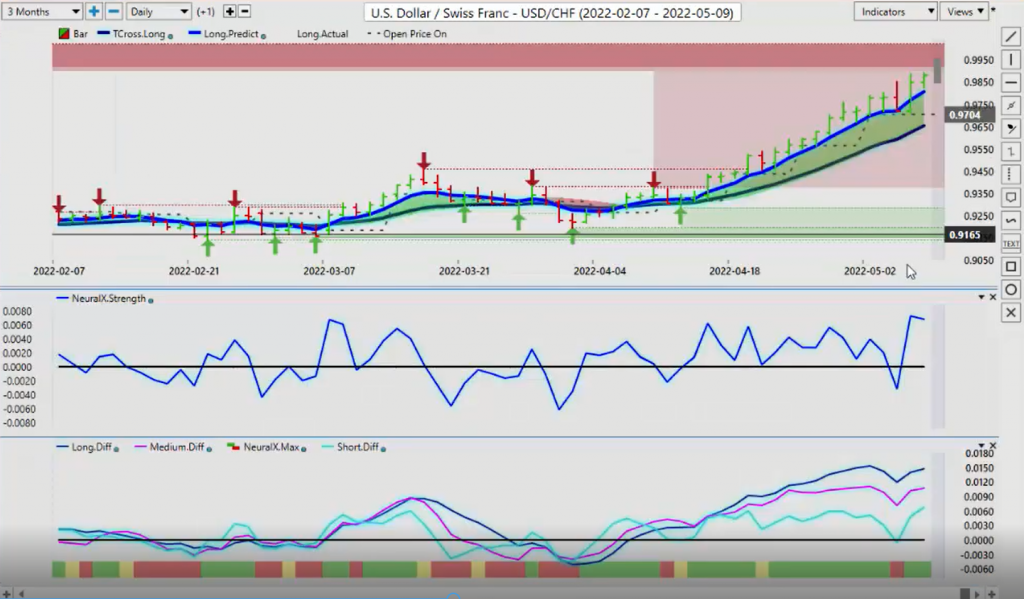
Now with the US Swiss franc, the two weakest currencies in the Forex market right now guys, clearly are the Swiss franc and the Japanese yen, but there’s a rationale behind that. And that’s the carry trade. These are low interest rate currencies, the US dollar moving to a higher interest rate. So that would support further weakness on these. But this rally, like the dollar yen, is over extended. Little bit of a crack in the dam on the… a reverse check mark on the neural index strength. But our predicted differences, they are definitely moving into extremely overbought territory, but that doesn’t mean that it can’t go higher. So when I back these charts out to look for that verified resistance high, you can see that I have to go back quite a few years to find where that resistance actually is. And that’s coming up around the 99 mark. We’ve got additional resistance here at 98.46 and 98.90. But again, I doubt there’s going to be a lot of buyers for the Swiss Frank respecting the interest rate. So for now keep a very close eye on the long predicted at 98.07, but I would expect some kind of retracement here, maybe not as low as 96.54, but definitely 98.07 would be in the cards.
British Pound versus U.S. Dollar
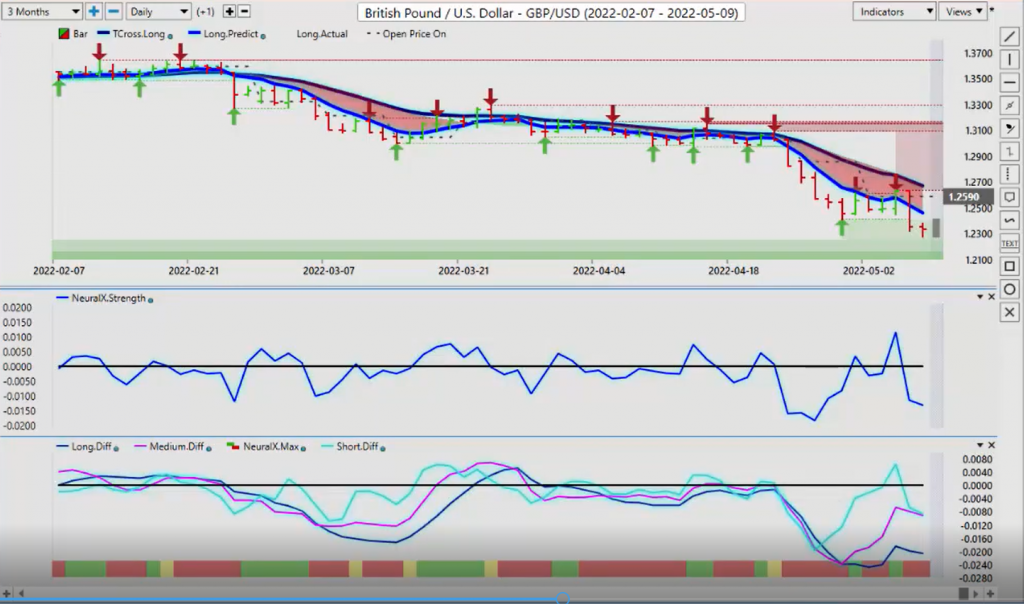
Now, the pound dollar, the Bank of England. Well, they didn’t use the R word, but they definitely hinted towards it, meaning recession. So, that could put additional downward pressure on the pound here. But if the dollar loses its momentum towards the 12th or 14th of this month, that may indirectly help out the pound here. But again, the Bank of England quite dovish here, significant breakdown on Thursday after a rally up actually, after the Fed, you can see that the sellers were just waiting near that high of 126.34. And that was actually the weekly opening price sitting right there towards the 125.90 mark. And they just pounded this thing lower. So I would expect a little bit more downside with the pound here if I go back a year or so, I’m going to have to probably go back further than that. Probably about five years. Yep. There we go, right there.
So that low coming in around 123.59, we’ll see if the pound can hold above this level, but right now it’s a very, very tall order here, because we’re basically closing almost below that. Well I think we are closing below that. Yeah, 123.36. So if the pound is going to make a move back to the upside, I wouldn’t expect it until the 12th, somewhere around the 12th or the 14th to get some kind of relief rally. Potentially back to the long predicted 124.64 is a given, but 126.73 is going to be a tough nut to crack here guys.
U.S. Dollar versus Japanese Yen
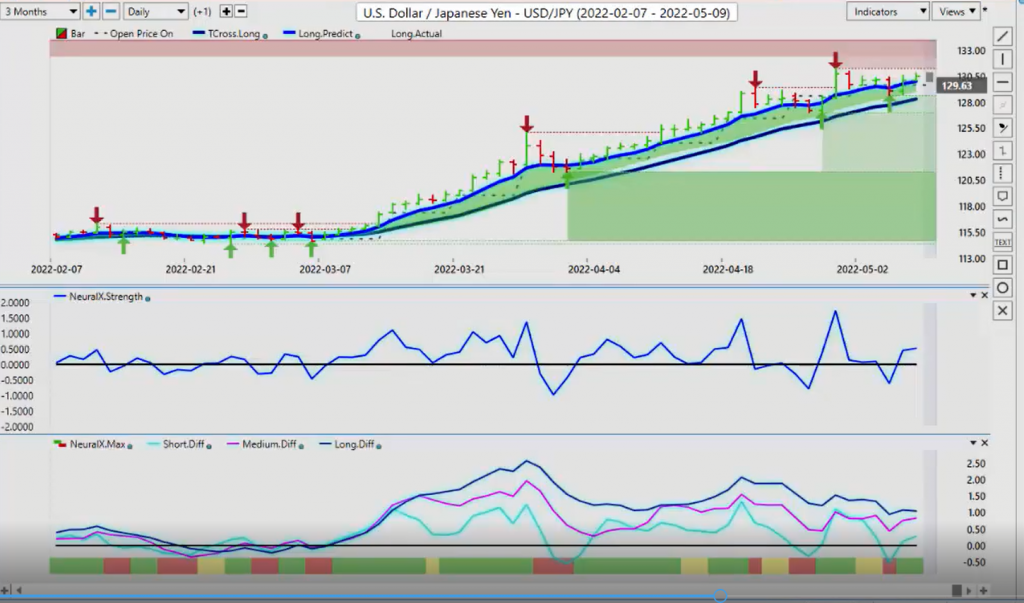
Now, when we look at the dollar yen, the dollar yen is basically just more or less, a one way trade. It just keeps going up. And again, trades like that very often can be a problem because what happens more often not is again, they tend to drop as fast as they went up.
So the pound, or excuse me, the dollar yen making a crazy move, all based around interest rates. So if the Fed starts to back away from its position of even 50 basis point and saying, “Look for the next little while, we’re just doing 25 basis points,” that’s going to hurt this pair. I would definitely be watching for a short opportunity, but I don’t think we’re there yet. We’ve got our verified, newly formed, verified resistance, high 131.24 potential for a short there, but we need something from VantagePoint to confirm that. And right now we simply don’t have it.
U.S. Dollar versus Canadian Dollar
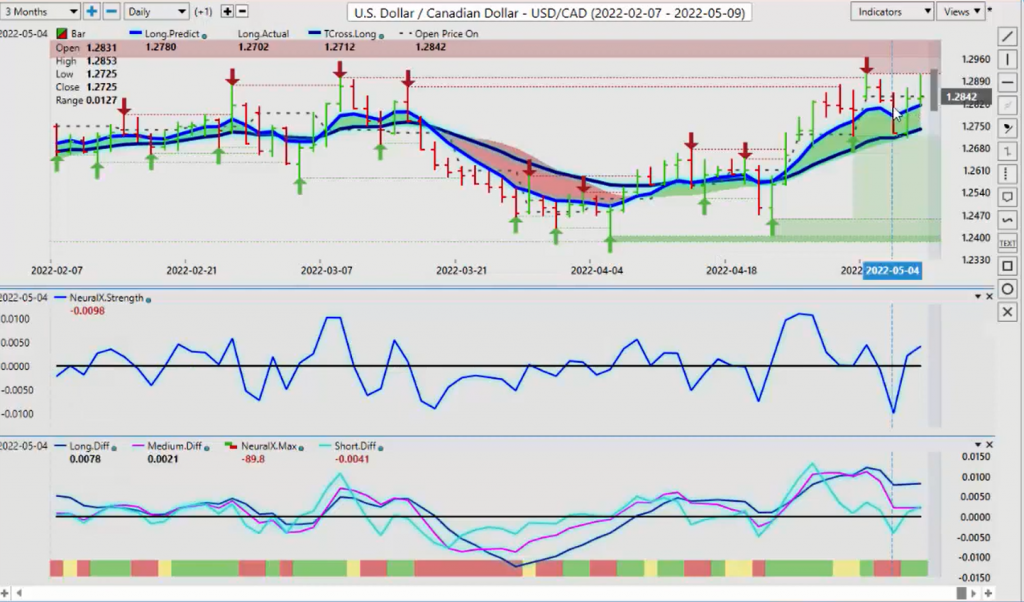
So when we look at The US Canadian pair, once again, this one is all over the map yet again, but when we use that weekly opening price, we can see that on the breakdown below the weekly opening price on Tuesday, true volume, pounded this thing down. But we, again, hit that VantagePoint T cross long to the number and then rallied huge off of it the next day. And continued to rally into that on Friday. Now we’ve hit into this verified resistance high 129.13. Respectfully, I would say that there’s still the potential for a short there with oil prices, where they are. And if the S&P 500 can turn around, even if it’s only corrective in nature, that will push US Canada down again. But as I had talked about most recently in the seminar in Tampa, was be very careful with US Canada, whatever it does on Monday, it very often does the exact opposite late day, Monday or into Tuesday trading.
Australian Dollar versus U.S. Dollar
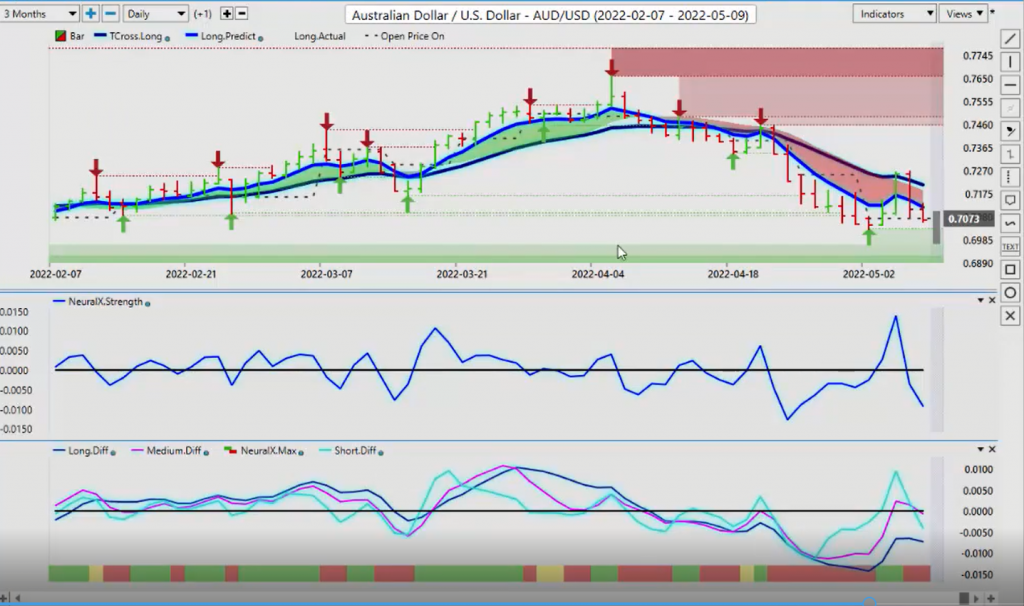
Now with the pound dollar, or excuse me, the Aussie dollar. And I don’t know why I keep getting that mixed up, but I apologize. So we can see a very similar pattern here, a big rally up. You can see there’s Monday trading with the holiday. There’s Tuesday trading. We close above the weekly opening price. And then we have a significant rally into Wednesday, only to sell off again on this thing.
But you’ll notice where we’re stopping exactly on the T cross long. This is why I prefer to use these predicted moving averages as pivot points, because there’s zero lag. It’s a point in time that we can use to sell from or buy from depending what we’re looking at. But for now the Aussie clearly bearish here. But if we can get back up above the long predicted, above 71.18 and re-challenge 72.13, the downside pressure may be off the Aussie. If we look back here going back into February, very early February, lows of 70.86, we’re sitting back right there.
And you can see what happened back then. We had a significant rally off this level. So keep an eye on Aussie, on the Aussie dollar for a potential rally here, guys, because it may turn around this month.
New Zealand Dollar versus U.S. Dollar
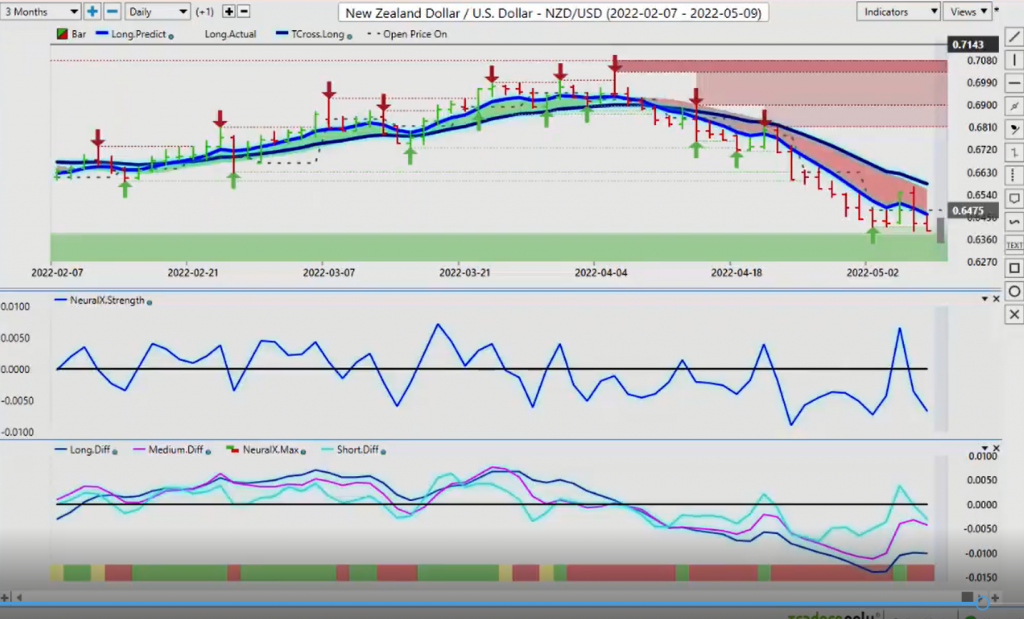
And if it does then our old friend, the Kiwi is likely to follow. Once again, we can see heavy support building down here, two ways that this can be played. We can buy counter trend off the verified support low, much higher risk. Or we can sell a break of this, but that also carries risk.
So again, always make sure when you start your trading week, that you allow all markets to come in. And what I mean by that is that the Asian session comes in Sunday night at eight, you’ve got Europe, then London, then the North American session. What I’ve advised my own direct trading group is that, look, no trades until about, 9:00 AM, 9:30 AM Monday morning. And very often I will sit Monday out and wait and then take the real trade, which will show up midday, Tuesday. So with that said, this is the VantagePoint AI market outlook for the week of may, the ninth-