


VantagePoint AI Market Outlook for the Week of September 28, 2020
VIDEO TRANSCRIPT
U.S. Dollar Index
Hello everyone, and welcome back. My name is Greg Firman, and this is the Vantage Point AI Market Outlook for the week of September the 28th, 2020.
To begin this week, we’re going to begin where we always do, with the very important US dollar index. We’re coming into a higher volatility week with the nonfarm payroll. What I’ve discussed in the past is that 80% of the time here, after the nonfarm payroll number, whether it’s good or bad, that is the extent of the dollar rally. While we’ve broken through this key resistance at the 94 level, you can see that the vantage point indicators are not completely in agreement here, that there’s a lot of upside momentum on dollar buying. We can see that the medium-term crossing the long term predicted difference, our RSI is sitting at 89.2, so we are getting a little bit overextended here. We are firmly below the yearly opening price. The dollar structure is primarily bearish.
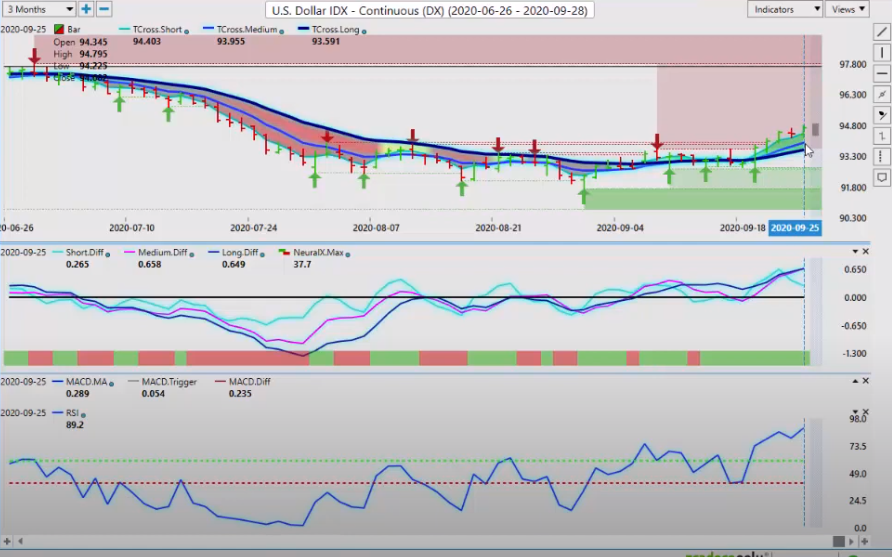
That doesn’t mean the dollar can’t go lower, but now that we’re out of summer trading, we’re back into normal trading, there is a relatively consistent cycle in dollar buying and selling. Usually the market is buying dollars in the first week of the new month, up until the end of the week, and into the following week. So, by a week coming Tuesday, whether that payroll number was good or bad, the dollar usually sells off.
What we want to do here is identify some key vantage point levels. The T cross long coming in at 93.59, the dollar is still predominantly bullish while above this level. If we click on our F8 in our software, we can see exactly when this dollar rally started. Right here, on September the 21st, we broke above the vantage point predicted moving average, and then we have been in consistent contact with it every day thereafter, including Friday. Once again, the dollar is currently bullish for the week leading into the payroll number, but it’s highly questionable whether the dollar will continue to move higher after that payroll number.
S&P 500 Index
If we cross-reference the dollar to the S&P 500, we can see that the S&P 500 is stalled at a very specific level, the yearly opening price. We also have Vantagepoint verified support at 31.94. So, as the indicators from vantage points start to roll over long on the S&P 500, this is yet another strike, potentially, against buying the US dollar. Now, if the equities can continue to recover, hold above this yearly opening price, than it is more likely than not, it’s stocks that will go higher, and your more risk assets will go higher, some of your commodities, than the US dollar.
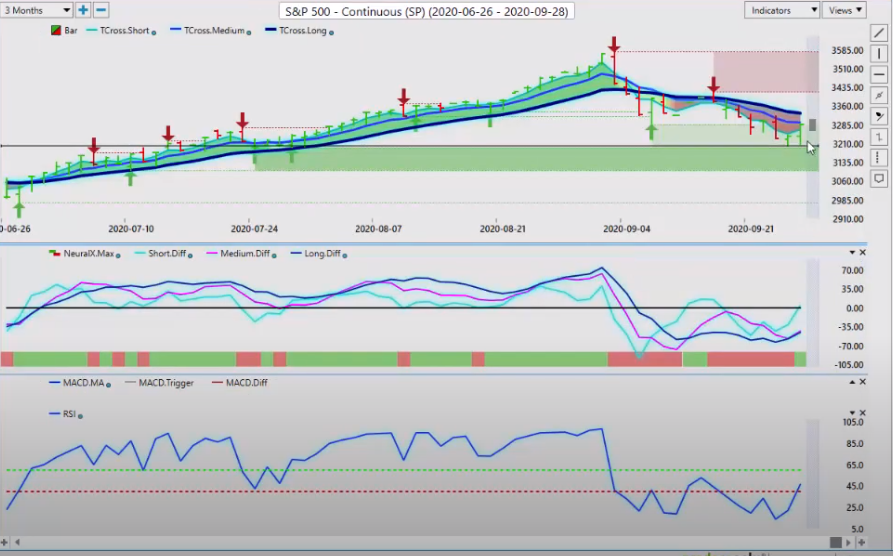
Again, we look at these, now, resistance points. The T cross long coming in at 33.32, that is a major hurdle that we need get above. If we click on our F8, we can see we are stopping exactly on that long predicted, the vantage point predicted moving average, with the correlation to 31 other markets. That level 30.82, 99. If we can break above this, that would take the immediate pressure off the downside, and we would look for stocks to extend their gains.
GOLD
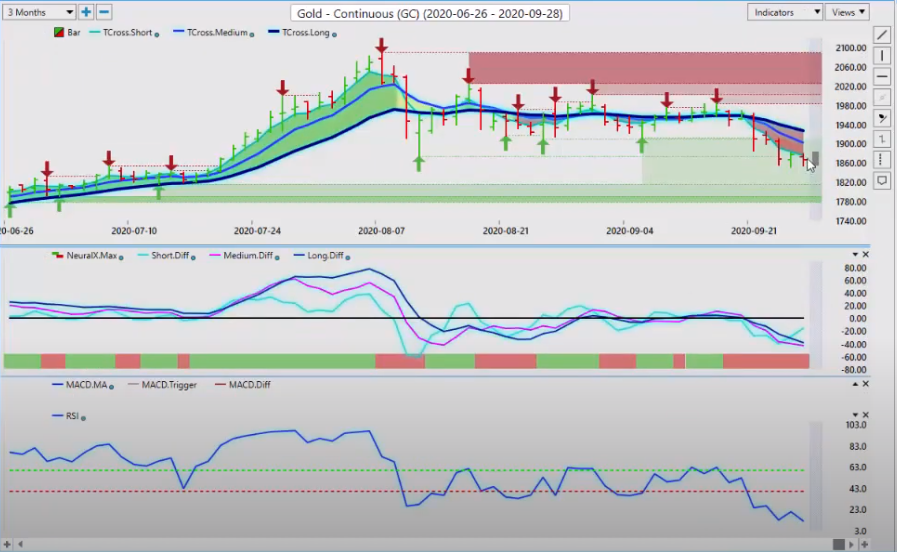
When we cross-reference this to gold, we see a very similar situation. We’ve got a verified support zone that’s coming in at or about 18.74, the level that I discussed in last week’s AI market outlook. When we look at that again, we’re hovering right around this particular area. This is a classic sign of a potential bear trap. Be very, very cautious in this particular level. We have additional support here in the broader range, that coming in at 1815, so we could extend a little bit lower, but ultimately, gold, in my respectful opinion, is still a relatively strong buy.
Crude Oil
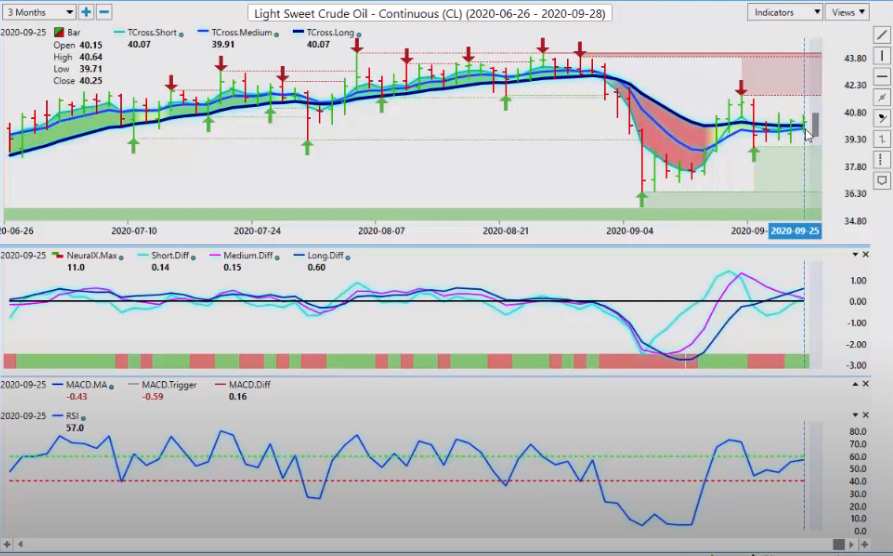
We can see our additional markets, light suite crude oil, again, covering the major markets here, guys. Our major global indices, commodities, and of course the currencies, when we look at oil, oil is breaking back above that key vantage point level at 40.07. If the S&P 500 can recover, it should pull oil up with it, but if the S&P and the global stock markets cannot recover, then it’s unlikely that oil will.
We do have a very ominous signal right here, the medium-term trend crossing against the longer-term trend, but the neural index at this current time is not in complete agreement. We would need that neural index break turning from green to red, and we would preferably, we would like to see the RSI breaking not only below the 50 level, but below the 40 level, to see momentum start to build in the market.
Euro versus U.S. Dollar
With the Euro, the Euro has come under pressure as the dollar index has broke the channel, as we’ve discussed over the last probably month and a half, almost two months, that it’s taken for the dollar index to break that channel. Again, only in my respectful opinion, it’s more likely than not the dollar will slip back into that channel. If that’s the case, then we may see the Euro start to turn around by the end of the week. But in most cases, again, after that payroll number, good or bad, the dollar index usually tanks, and that is what we’ll send the Euro higher.
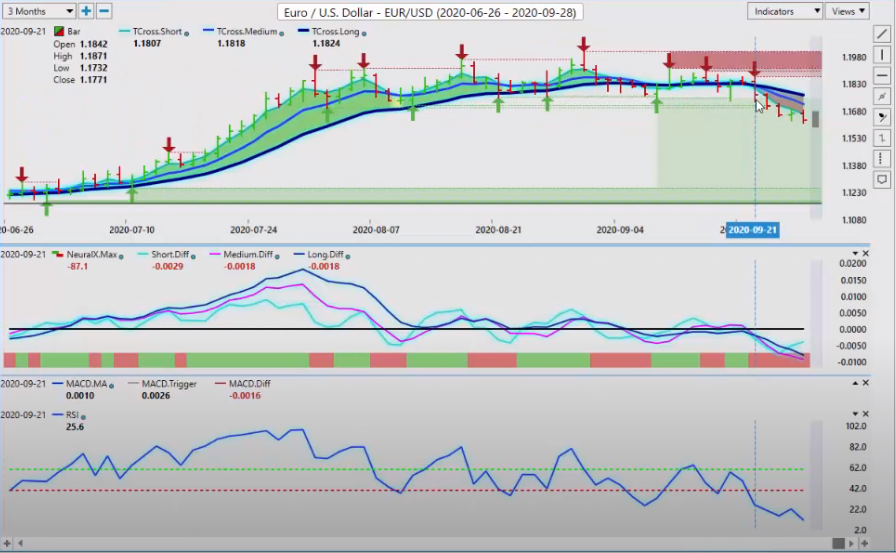
If you’re trading the Euro, we also want to be very mindful of gold contracts. Right now, that key vantage point level, the T cross long, 117.69, so we’re looking for potential retracement by the latter part of the week, back into this level. If we click on, again, our F8, we can see precisely when this trend started to shift into the downside, started on the Euro, 9/21, the exact same day that the dollar index turned higher. You can see the market is, then again, in contact with this blue line. This is the long term crossover, using the blue line by itself as a daily pivot area, with the predicted high and predicted low. Once again, that key level, right now to start the week, the 117 level is the level to watch here, guys.
British Pound versus U.S. Dollar
With the British pound, US dollar, the pound under pressure again, but once again, we can see that we’re stalling on this newly formed verified support low at 126.75. If the pound cannot push and close below 126.75, then there’s a strong risk of a bounce here, back towards that key T cross long. Again, that T cross long sitting all the way up at the 129 level, but if we click on our F8 in our software, once again, this is a very identifiable range here. We’ve got 126.75 on the downside, and 127.83 on the upside. To predict the medium-term crossing the long term predicted difference has not crossed to the downside, our neural index is green, our RSI running flat in oversold territory, but that certainly doesn’t mean it can’t go lower.
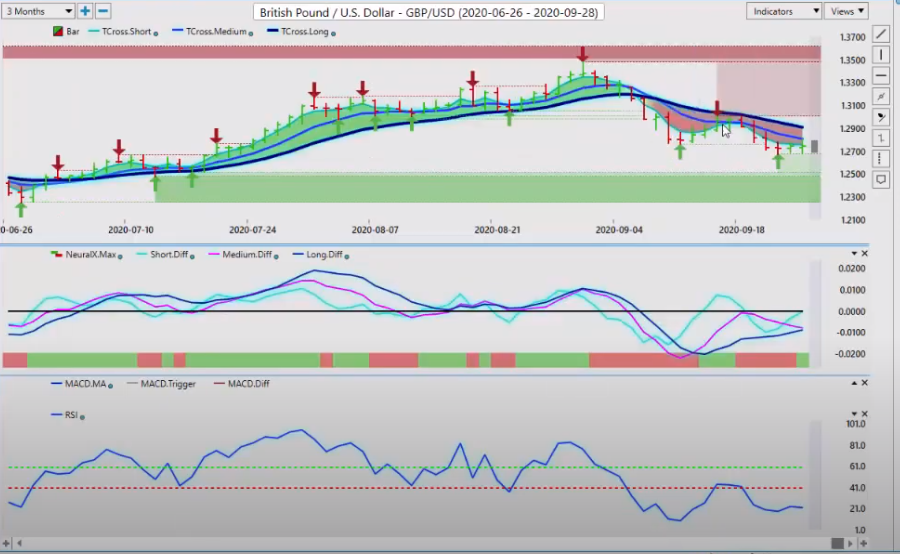
The key thing you want to understand here, guys, know your levels. If you’re identifying these levels using the verified support zones, and in this case, the resistance using the long predicted, then we can actually put limit orders below the support, and buy limit orders above the resistance for a break above that level. That’s the way we would want to play this.
U.S. Dollar versus Japanese Yen
In the week of the nonfarm payroll, in most cases, the dollar yen is bullish, up until we get the ADP report on Wednesday. Then, the dollar yen tends to go sideways. Right now, a very dangerous level to trade this at. We are moving about the T cross long at 105.44, however, you can see, we are smack dead in the middle of this high and low range between 106.55 on the upside, and the downside, which has made new lows, I will point out, at the 104 level. Right now, there’s a slight bias here, looking at the vantage point indicators for the dollar yen to extend its gains, provided that gold does not rise. If gold starts rising again, that is going to strengthen the yen, not the US dollar, so be cautious of this.
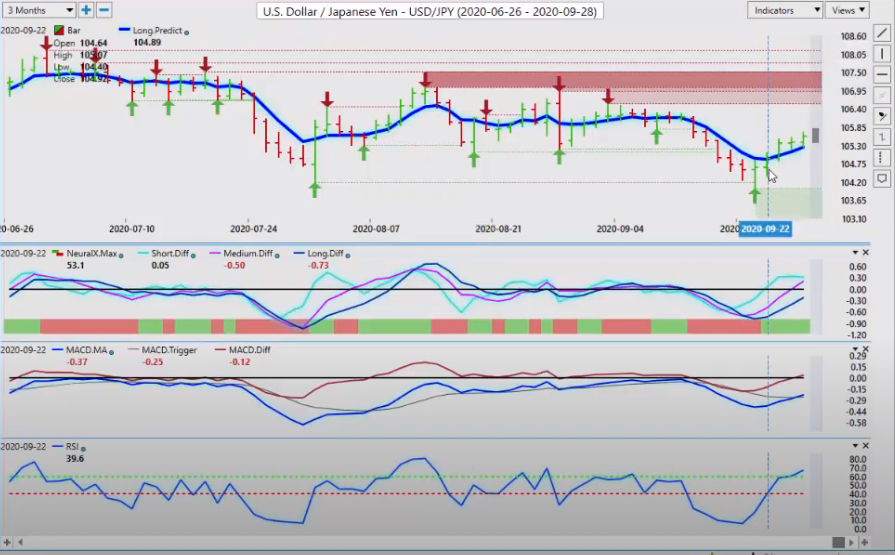
It does appear we have some type of momentum here with the RSI breaking above the 60 level, suggesting there is upside momentum here, but in my respectful opinion, that upside momentum will likely be exhausted by the end of the day on Monday, and then on Tuesday, we’re just going to go sideways on this particular payer. Again, in a very dangerous level between that swing high and that swing low. Right now, your order flow traders are focusing up near the verified resistance, and your other order flow traders are focusing around the verified support level. Right now, I would be very cautious trading this one.
Once again, we can identify, clearly, when this trend started. The break above the blue line, the long predicted, when it broke above here, we started to see a rally. Each day, we’ve come back and kissed that blue line, to the number. Again, using this strategy can be highly effective on a daily basis, but right now, again, slight bias to the upside with the dollar yen.
U.S. Dollar versus Canadian Dollar
Now with our three main equity-based currencies, we could see some real opportunity coming up here this week, guys, if the S&P 500 can hold above that 31.94, 32 level, and recover. If that’s the case, then the US CAD will run under the steam at these verified resistance. You can see that the medium term and long term predicted difference are starting to flatten out. We’re at 94.9 on the Martin Modified RSI, using a nine period RSI, and a 60/40 split.
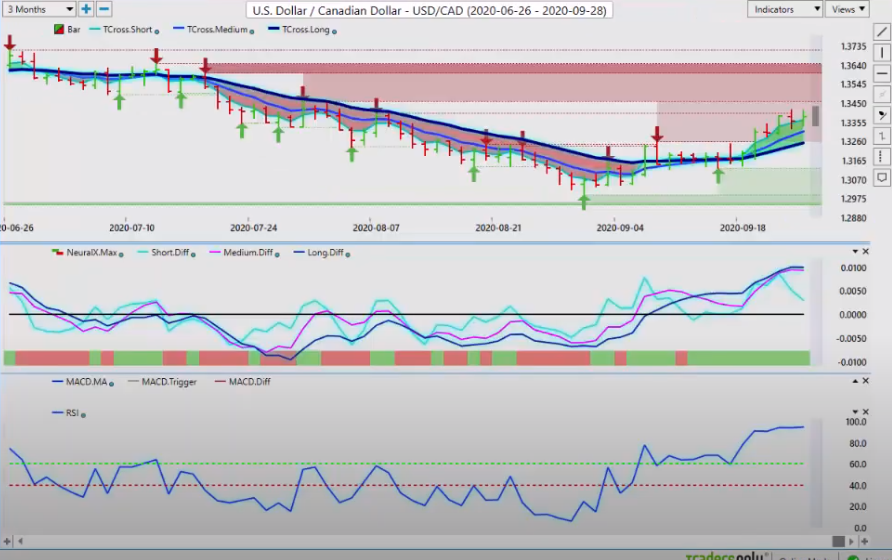
We are completely moving sideways here. Our neural index has been green for an extended period of time. All of this suggests a corrective move lower. I would look for that corrective move lower, not on Monday, but on actually on Tuesday. Those levels now, the T cross long, 132.53. Again, clicking on our F8 in the software, we can very clearly see when this trend shifted, on that move in the dollar index. Again, US Canada, was a little bit early, maybe a day early, but the main trend shifted on 9/21, when the dollar index, again, broke that channel. Then we come in constant contact with this blue line, but now we’re stalling, up around this verified resistance high. We have one sitting again at the 133.98, but a much bigger one here at 134.59.
Australian Dollar versus U.S. Dollar
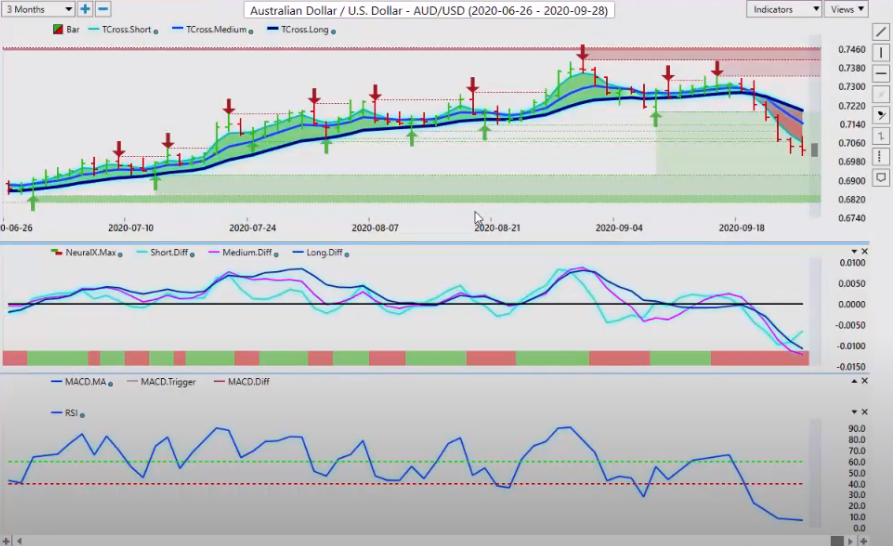
I would anticipate this level to be tested on Monday morning, only to turn around and fail, and reverse on Tuesday. Keep a very close eye on stocks if you’re trading this payer. And the same thing would apply to Aussie US and New Zealand US. Right now, we can see that the Aussie has pushed lower on that big stock market sell off. Again, if the S&P can turn around, then we will see money come back into the Aussie, back into the CAD, back into the New Zealand. We’ve got an additional verified support low at 69.21. I am not convinced, at this time, we are going to get down there, but if we do, and the S&P turns around, I think we have a good buying opportunity here on the Aussie.
New Zealand Dollar versus U.S. Dollar
The same thing here, guys, would apply to the New Zealand. The New Zealand dollar against US has hit that support low, 65.15, and we’re stalling. We have an additional verified support low coming in at 64.
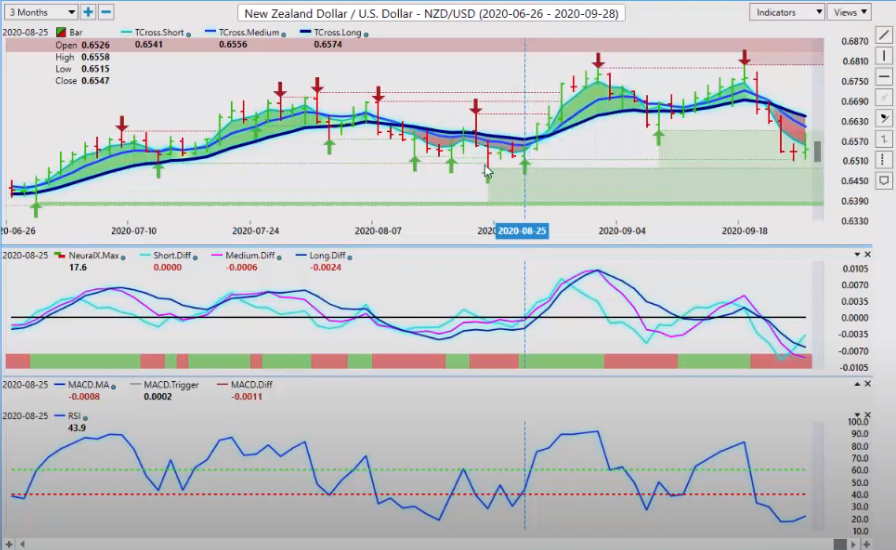
89 as identified by the vantage point software. We are in a heavily oversold condition here.
Very likely, we’ve got two upside targets here, the T cross long at 66.44. And if we click on our F8, you can see that the F8 is always in close contact with the market price. That level is 65.95, so between 65.95 and the 66.65 level, that’s where we would be looking for a retracement point.
With that said, this is the Vantage Point AI Market Outlook for the week of September the 28th, 2020.
Are you using A.I. yet?