


Register for a Free Live Training
Hot Stocks Outlook uses VantagePoint’s market forecasts that are up to 87.4% accurate, demonstrating how traders can improve their timing and direction. In this week’s video, VantagePoint Software reviews forecasts for Premier ($PNC), Humana ($HUM), United Healthcare ($UNH), Cleanspark ($CLSK), Electronic Arts ($EA)
VantagePoint A.I. Hot Stocks Outlook for August 15, 2025
Hello again, traders, and welcome back to the Vantage Point AI Hot Stocks Outlook for August 15, 2025. I hope you all have had a nice week out in the financial markets. And, as always, we’re here to take a look at the most recent Vantage Point predictive forecast. So, uh, if you haven’t already, make sure you go ahead and click on the link down in the description below and get yourself signed up for a live demonstration and learn all the specifics about how these predictive indicators and technologies are helping traders make much better trading decisions out in the marketplace.
Uh, now we’ll go ahead and start out really around the healthcare sector. We’ve seen really a lot of, uh, activity around that space.
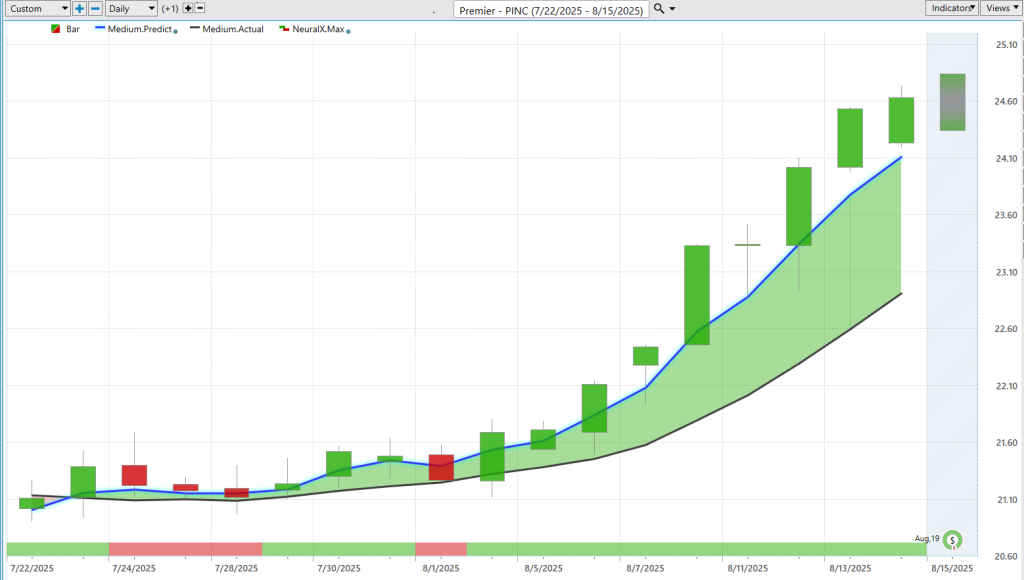
Uh, and Premiere ($PINC) — really nice example here in Premiere highlighting how all of these tools work together.
Uh, so what we’re looking at here is daily bars and candles. Each one of these candlesticks on the chart is going to represent a full and complete trading day. Uh, and the first thing we’re going to cover here is that, right up against that price data, you’ll notice that there is a black line value and also a blue line value. Now, the black line that you’re seeing there is a simple moving average, or what we refer to as the actual simple moving average. Uh, and in this case, it’s a 10-period. So it just looks at the previous 10 close prices, adds them all together, and then divides by that number.
Some of the shortcomings of traditional technical analysis like this is that all that data to generate that value comes from the past, and it also only looks at one market in isolation — in this case, Premiere. And so what we do is use that as our baseline to really let us know, “Okay, where have market prices been?” But, obviously, traders want to know, “Hey, where are prices headed next?”
And so what Vantage Point traders have access to is the Vantage Point proprietary predicted moving average. For this value to get calculated and then plotted on the chart every evening, well, this is where the technology of artificial neural networks comes into play, and they’re performing what we would call intermarket analysis.
And so what that means is that rather than just looking at past prices from a single market, Vantage Point is able to analyze dozens of other markets that are known to drive and influence the future prices of this asset. It’s using huge amounts of data from all of these other markets, finding those important relationships — whether they be leading or lagging relationships, positive or inverse correlations. This really goes globally across all the markets.
It can be individual stocks within the healthcare space. It can be ETFs that usually wrap up a large number of markets. It can also be things like the value of currencies or even interest rates, and even down to global commodities — whether it be gold mining stocks or oil — these are very important values to factor in. Hey, if you’re forecasting for Exxon, oil prices should probably be an important consideration.
And so what the software does is analyze all of these markets collectively and produce a singular output that traders can use to make trading decisions. Whenever we see that blue line crossing above the black line, well, it’s suggesting that these average prices are going to start going higher and traders may want to look to take a long position, buy calls — really express that bullishness through whatever instrument you like here.
We see since that predictive forecast has gotten bullish there, you’ve got about a 16% rally just in the past 17 trading days.
This is a really good example to highlight how all of these tools work together because, obviously, that forecasts the overall trend. But if we look at the bottom of the chart here, you’ll see this bar that goes from green to red back to green. This is also being updated every single trading day, but it’s tuned to solve a different problem — that problem being short-term strength or weakness over two candles, or you can think of it as 48 hours.
And so you’ll notice here that once we get that blue line crossing above the black line and the trend bullish, we get that neural index moving down to a red configuration, and you get a couple days of consolidation. But you’ll also notice that the blue line remains above the black line, saying the overall trend is still bullish here, and you want to remain on the bullish side.
Even here, you see that neural index gets bullish, you get a little dip the next trading day — it’s looking at the range of the next couple of trading days. Sure enough, that separation between the predicted moving average and the actual moving average is really getting more and more extreme, and that leads to a very nice rally in shares and persistence as far as that green configuration from the neural index as that momentum kicks into the market.
Lastly, when we look at these values every single week here, you’re even provided an intraday tool — the predicted high and predicted low for the next trading day. This being a Friday, we’re going to have the actual market data fill in here and we’ll be able to see how accurate all of these predictions are relative to the actual market data.
If we go back and look at all of those predictions, what we see here is that, okay, after we got that crossover, really the very next trading day, it’s saying, “Hey, look down towards that predicted low” — almost a perfect entry there. You also have your predicted high, again helping with intraday levels where you can expect the market to move over the short term. But, obviously, if the trend is up, we’re likely to start moving past those predicted high values and trend to the bullish side.
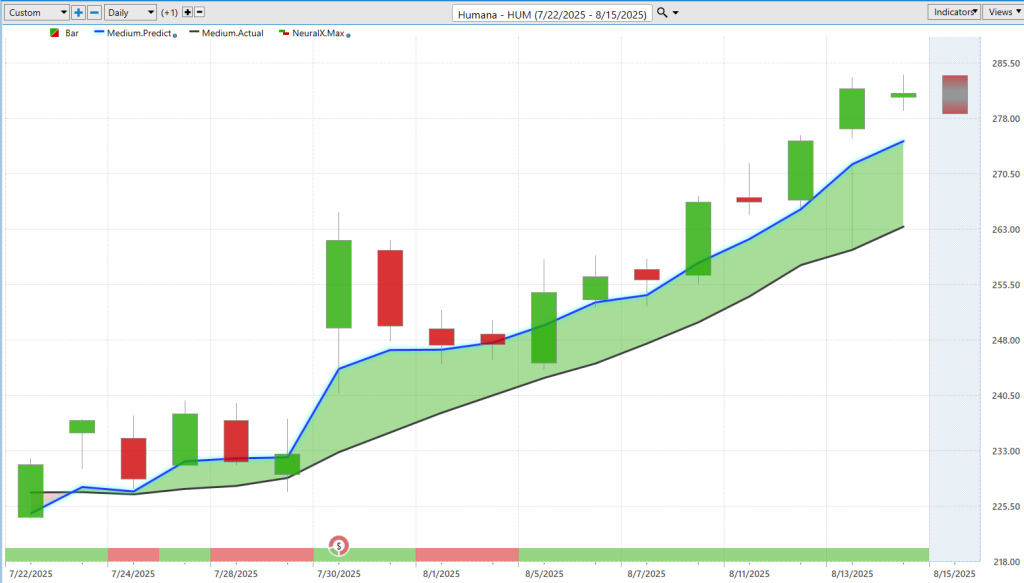
You see here about one, two, three, four, five, maybe six Humana ($HUM) days here, we’re almost perfectly hitting that predicted low value before that resumption of the uptrend, and really offering some excellent entries and excellent tools to manage that trading opportunity.
We’ve really seen a lot of strength throughout the healthcare space — obviously, a 16–17% rally here in Premiere. Here’s Humana stock — a health insurer. We see that blue line crossing above the black line. We get that noise around earnings, which is always something that you want to consider in how you want to position yourself going into earnings.
You’ll notice here that the predicted moving average has a lot of separation even going into that event. Take a look — even after all that volatility comes through, how are those predicted high and low values doing to help traders manage the opportunity? Again, you’re always going to get noise around the earnings report here, but what’s excellent about the software is it really adapts very quickly and says, “Okay, let’s get back online. Let’s figure out what’s going on here in Humana. Look at how those intermarket relationships are working and keep forecasting future prices with the help of these tools.”
And so you see we’re moving down to these predicted lows once again, and just a lot of momentum to the bullish side here with the neural index very, very bullish. This is a market that’s certainly been on the radar for a while, understanding that this health insurer is in an uptrend.
There are other markets where you can see that bullishness in the marketplace.
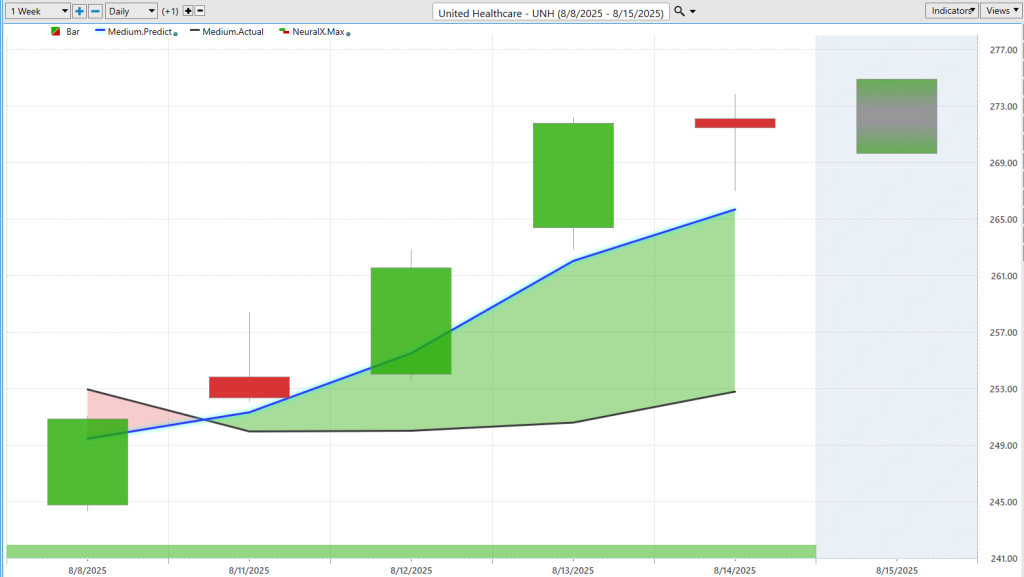
What happened this week is we actually got a crossover here in United Healthcare ($UNH).
And so there’s a lot of hubbub and excitement this week around United Healthcare, and Warren Buffett buying some, Michael Burry, I think, bought a little here. Monday actually saw that blue line crossing above the black line going right into the start of the week — a lot of strength from the Vantage Point predicted neural index. Even yesterday, we moved down to the Vantage Point predicted low. Today, we’re seeing about a 10% gap up in the market and really a lot of opportunity to get that position on.
Obviously, we’re only two or three days into this since that bullish forecast from the Vantage Point indicators here.
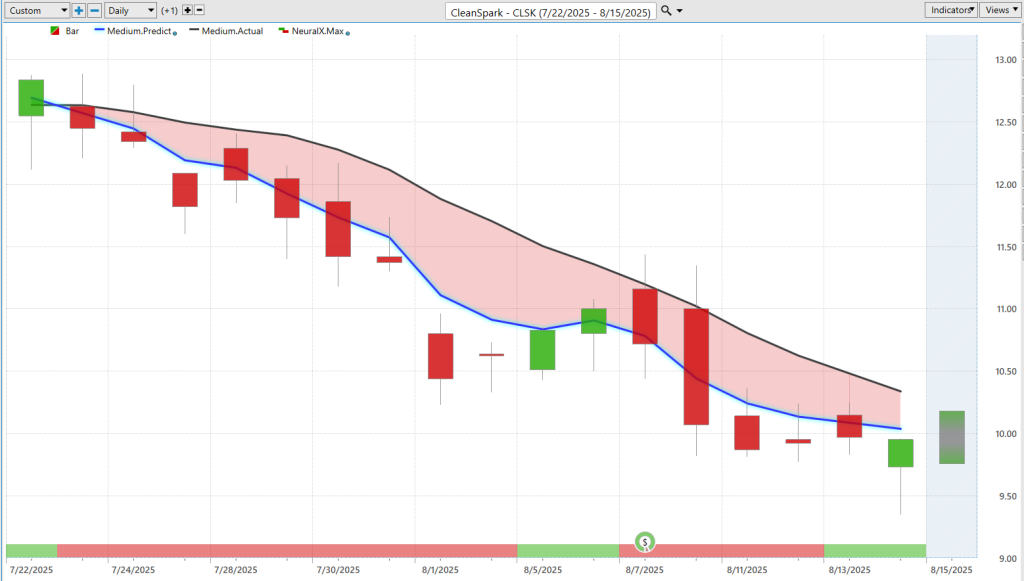
So, exciting stuff there. But here’s a different situation — this is Cleanspark ($CLSK), one of the Bitcoin miners. Here’s Cleanspark. Prices even hit an all-time high this week. However, in this Bitcoin mining stock, we see that blue line crossing below the black line. If you’re doing some trading, this is really not the place where you want to be doing especially some short-term trading on the bullish side.
We can wait until we start to see those crossovers to the bullish side to get bullish again and take those long positions. But, in the exact same way — whether you’re going long or going short the market — here we see that blue line crossing below the black line, and we can look at how accurate all of these intraday predicted high levels are.
You always want to be careful here. We see these levels where you just don’t fill the range, you move lower, and then you get that next day where you sort of fill in a lot of that space. But very clearly here — predicted high, predicted high — these are clearly places where you do not want to be long. If anything, potentially shorting the market, taking profits on those short positions.
Very clearly, not a place where we should expect strength, and that’s led to a decline in the share price. Now we’re looking at about down 22% — obviously pretty significant if this is a market that you trade and are interested in. You don’t want to be sitting around while there’s a 22% decline.
Of course, if you are on the bullish side, you can always hedge with options and sort of balance the portfolio out before you start moving into these strong downtrends.
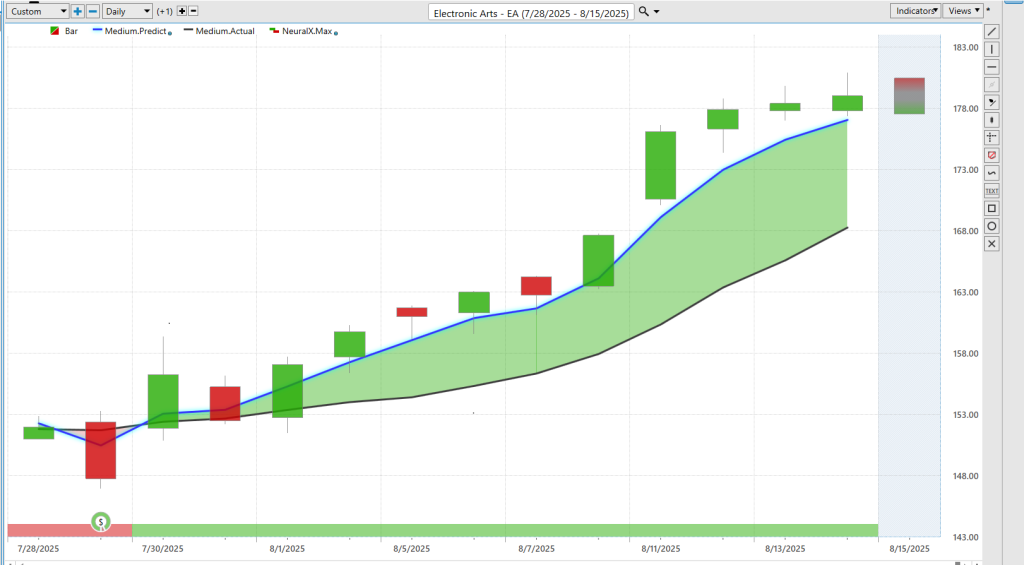
Lastly here, here’s Electronic Arts ($EA) — as plain as it gets. Blue line over black line. We actually went through earnings here. So, if you do any trading after earnings, you’re saying, “Okay, now we have a bullish trend here. The neural index is bullish every single day.” Some persistence as far as momentum goes.
Then, of course, you’ve got those intraday levels that say, “Keep looking down towards these predicted lows.” That’s where you’d want to accumulate a position. In the short term, you’ve got those predicted highs, but very clearly a very strong trend here with about four or five entries on the bullish side.
Overall, we can take a look at this move — so far about a 16% rally here just over the last 11 trading days. Really exciting stuff.
Obviously, you need to adapt with changing market conditions. When we start to see these forecasts start to get very bullish, like we see in the healthcare space, you really want your attention to start moving over there. This is where Vantage Point traders really have a leg up with tools like the Intelliscan feature.
This allows traders to see, “Hey, where are these fresh crossovers coming through? Where are we having those bullish forecasts as far as the blue line remaining above the black line?” That allows traders to really focus in on a sector area of the market where that strength is coming through.
So, we’ll go ahead and leave it there for today. Once again, this has been the Vantage Point AI hot stocks outlook for August 15th, 2025. Thank you all for watching. Best of luck out there, and bye for now.


