Welcome to the Artificial Intelligence Outlook for Forex trading.
VIDEO TRANSCRIPT
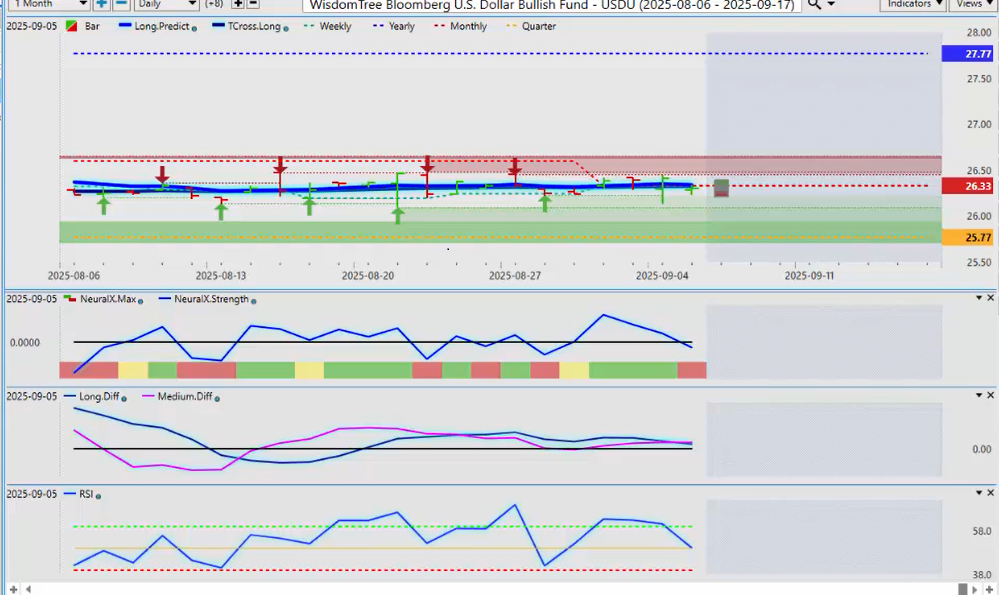
WisdomTree Bloomberg U.S. Dollar Bullish Fund ($USDU)
Okay, hello everyone, and welcome back.
My name is Greg Firman, and this is the Vantage Point AI market outlook for the week of September the 8th, 2025.
Now, a very choppy week this first back week back, which is pretty much par for the course in most cases here. Uh, holiday short week, uh, definitely, as I warned, there would be no shortage of volatility. Now, the US payroll number, uh, another bad number, but what I will point out is that we had a similar number like that last year. The Fed reacted to it and cut 50 basis points last September. I don’t think he’s going to do that in this year. I think he’s going to cut 25 basis points and then likely say, we’re on pause. We’re going to wait and see what the data says. So, what we’ll do here, uh, for next week, is look at two versions of the dollar index. One through the US DUETF, the other one through the UUP, the dollar bull fund. Now, I’m seeing two very different signals here coming from the ETF side. The UUP is showing a very bearish scenario.
The predicted RSI is breaking down below the 40 level, which suggests momentum is building. We have a medium-term crossover. Our neural index is down, and we’re below our T cross long. But once again here, guys, I will point out we are firmly above the quarterly opening price at 26.83.
Now, that’s the perspective from that UUP. But when we look at the USDU, it’s showing something very different. Barely below the monthly opening price. We, we do have an MA diff cross, but it’s actually crossing somewhat to the upside, and we’re above the 50 level on the predicted RSI. So, a very, very different perspective. And what I can tell you is that last year in September, the USDU was a leading indicator for the dollar rally in October and November of last year. So, we’ll see how this one plays out. But for now, what I wanted to show is that there is two very different signals coming from very similar ETFs. But the UUP is very heavily weighted to the euro, where the USDU is not. It’s tracking US dollar transactions. A very interesting ETF, actually. So, for now, uh, some dollar strength still cannot be ruled out, even though, again, a terrible, I will concede, a terrible payroll number, but there is such distortion in the month of August anyway that they could all be, uh, again, we could see, uh, going into next month in the October number for se September, we could see jobs being added back in because employers were sending in the numbers late, or they didn’t send them in at number of different things, but I will concede the picture is, from the technical perspective, bearish.
Gold
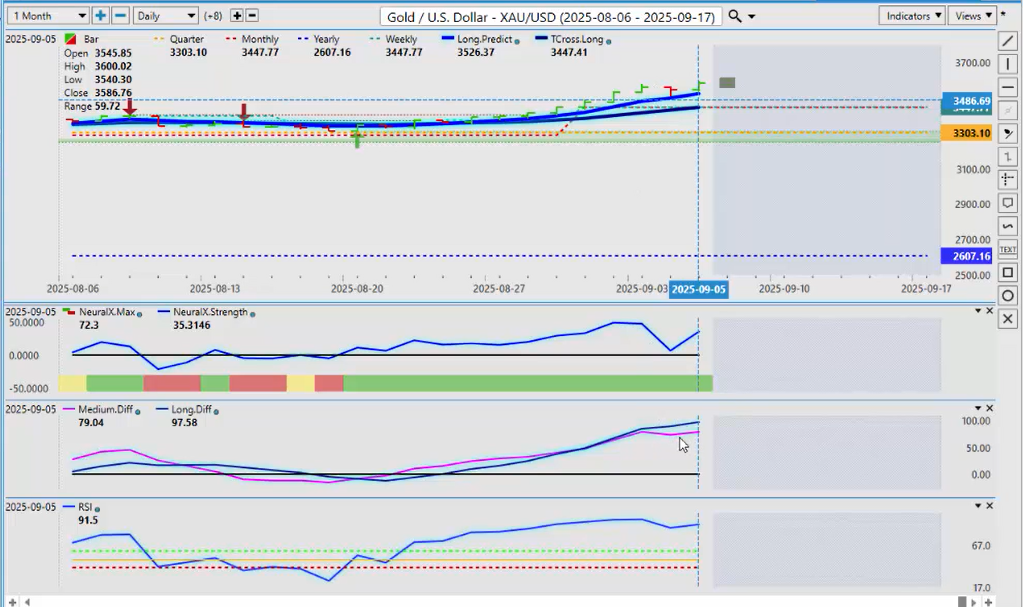
Now, gold obviously is responding, but I will point out that gold responded to, to the, uh, payroll number long before the number came out. Gold’s been moving up the better part of the week. But once again, we look for that difference in the VP software. The pink line measuring the strength of the medium-term trend. It’s actually below the long-term trend, warning that we could see a corrective move, and a clear picture of dollar weakness and gold strength is not present here at the current time. So, once again, structurally, gold looks fantastic. We’re above our yearly opening, our quarterly, clearly above our monthly opening price. It is absolutely bullish.
The question is, can it maintain this momentum if the market comes back in next week and looks closer at that payroll number and maybe revisits last year and the mistakes that the Fed made then? And they’re going to question, is the Fed going to cut 50 basis point only to turn around and have to say, okay, well, wait a minute, the data doesn’t support the cut, so we’re going to pause again. So, I think there, I think you’re going to get again a, uh, a hawkish 25% base, uh, cut, and if that’s the case, actually wouldn’t be overly supportive of gold. So, I’ll be watching it very closely, and I’ll update everybody each week. But for now, we are definitely overextended in gold, but that doesn’t mean it can’t move higher. The neural index is looking quite good, pointing back up to the upside, but a corrective move back down into this 3447 area, but the very minimum corrective level is 3526, and I could see that by the end of the week.
S&P 500 / NASDAQ
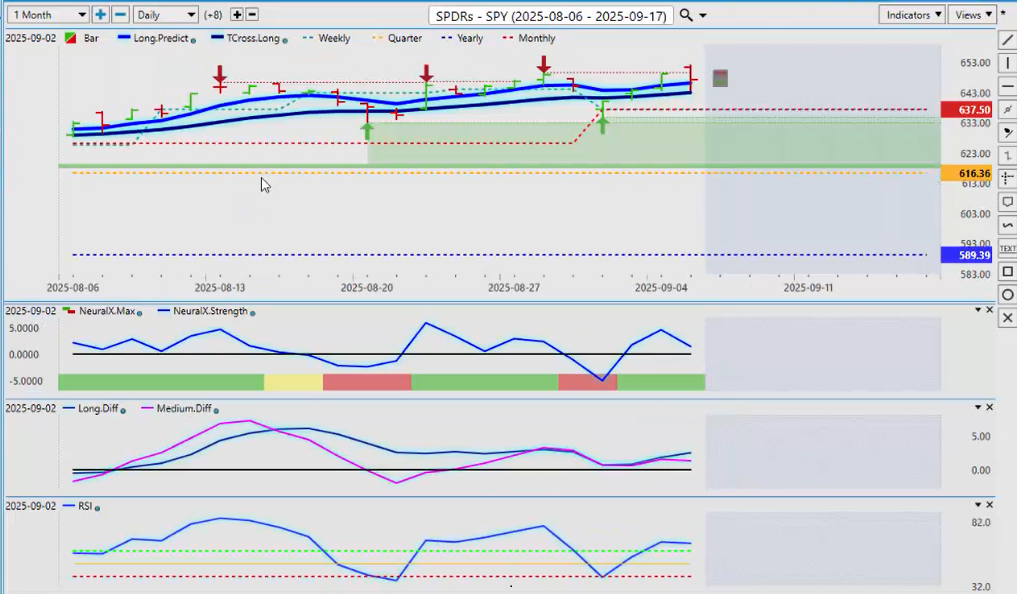
Now, looking at the spies and how they’re doing, uh, once again, the media narrative is a very interesting one here, guys. Right out of the gate on, on Monday of this past week—Tuesday, excuse me—they immediately pointed out, and they kept hitting that point, how poorly the equities do in September. So, just on a clarification standpoint, that wasn’t completely accurate, what they told you. And we did discuss this in the Vantage Point live training room in last year with that 50 point basis, 50 basis point cut from the Fed. The stocks actually did very well, uh, going into the end of the month after we got past the 10th of the month last year in September. Stocks did very well. So again, uh, they create a false narrative, and then they keep hitting that point over and over and over again. September is a bad month for stocks. They set it nine times on Tuesday morning in le, in less than a 2 hour period. That’s what I can point out to you. So again, stocks did very well the entire week. They’re climbing up the entire week. And again, we’ll see where this one goes, but, uh, for now, I think that the market should be more concerned with a recession than the seasonality in this particular case and what the Fed is going to do. So, our T cross long there is coming in at 64295. We need to hold above that area. But again, from a structural standpoint in the market, we’re above 589. We’re above 616. We’re above the monthly opening price at 637.
Very bullish setup here for stocks. And that was right out of the gate on Tuesday, while the whole time they were telling you how bad stocks are going to do in September, only to see the S&P 500 and the NASDAQ climb. So again, watch that key T cross long. As long as we’re above that in the monthly opening price, that narrative of a stocks weak in September—highly questionable at this particular time.
WTI Crude Oil / NAT Gas
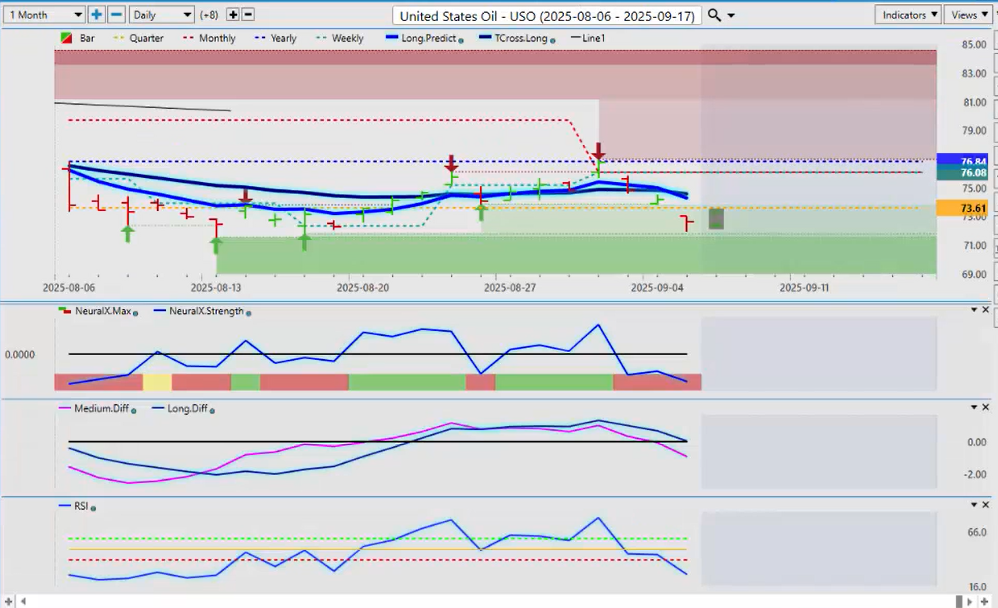
Now, looking at light sweet crude oil once again, uh, I’ve been relatively vocal on this one. I’m more a buyer of NAT gas at this time of year going into, uh, year end than I am light sweet crude oil. So, oil had a bit of a rebound there at the beginning of the week, up to the hit the calendar yearly opening price. Another great example of why we don’t look at the rolling performance model of a random 30 days, random 60, or 90, or 120 days. We look at from January 1st, the calendar first trading day of the year. Are we above it or below it? We have spent a pretty substantial amount of time below it. So, this is consistent with the seasonal pattern in oil, that it usually moves lower, uh, going into October, November, and December, and NAT gas starts to do better. So, we do have momentum building here. Predicted RSI breaking down. Medium-term crossover is complete, and we just about got a long-term crossover. Uh, and we’re firmly below that T cross long, and that will be your resistance for next week, 7457, 7429.
VIX
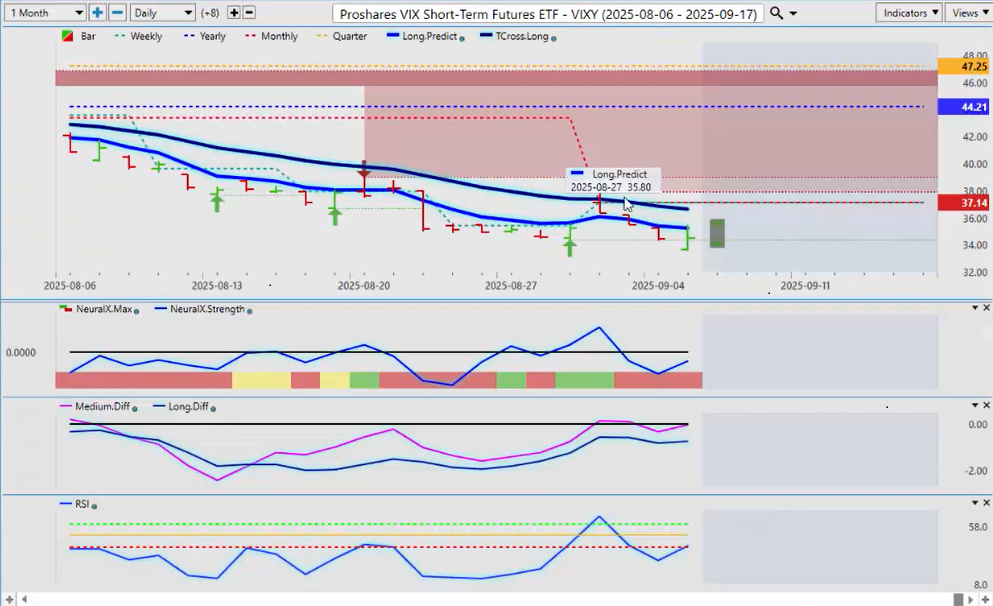
Now, when I look at, quickly look at the VIX, the VIX again, uh, starting off the week, the inverse correlation between the VIX and the S&P, the NASDAQ, etc., uh, it’s, it’s rebounded a bit on Friday, but again, it’s firmly down. Uh, little bit of movement on our predicted differences here, but overall, all, as long as we’re holding below 36, 666, uh, the bias on the VIX is clearly to the downside.
DAX / S&P 500 / Dow
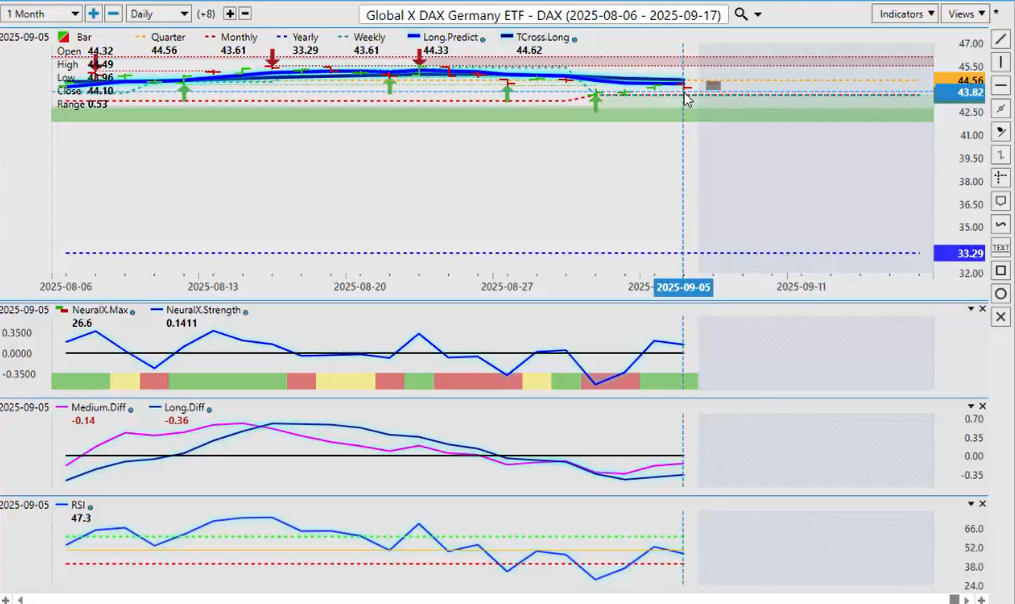
So, how does this play out with the German equity markets? So, once again, uh, the German equity markets doing pretty decent, uh, the rising the entire week with the S&P 500. So, what appears to be volatile actually is not. It, it becomes volatile if we believe what the media on CNBC, some of these channels, uh, are saying, and again leaving out that main point that the global equity markets were not weak last September; they were stronger, and it was based around that Fed rate cut, right? So, can the DAX rise? I believe the DAX can rise as long as the S&P 500, the Dow, and all the global indices that are tied together, if they all rise, then this will too. But again, we have to let that labor data digest going into next week. It’s not as dovish as it appears. That’s all I’ll say, and give you, forewarn you, uh, of that. So again, uh, predicted differences are rising. As long as we’re holding above 4361,
Uh, there’s still a bias to the upside here, but there is still that correlation to the euro, which I’ll talk about more in a moment. But for now, biased, uh, we’ve just got get above that T cross long at 4462.
The S&P 500, or the spies, it needs to get above and stay above its respective TCross long. Then they all move higher, or they don’t, depending on how the market interprets the upcoming Fed meeting. And, of course, we do have the CPI data this coming Thursday, which will be another layer of inflation data, albeit lagging. It’s still the month of August, and always remember that August unemployment data is lagging, right? In a month that’s notorious for distortion in labor reporting. So, I’ll leave it there, but I think that, uh, the picture’s a little bit muddied still for the Fed.
Bitcoin
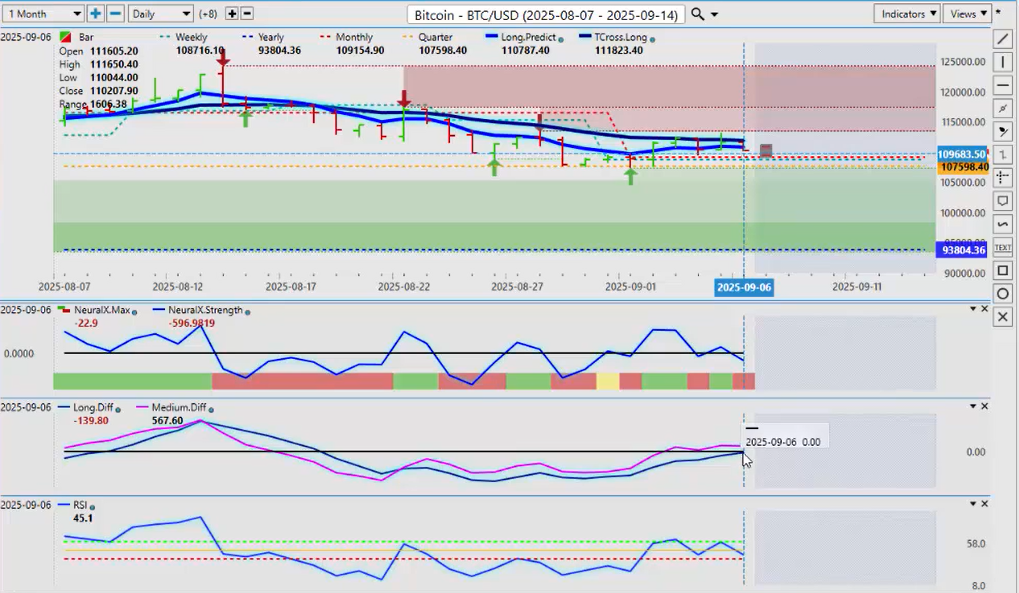
Now, when we look at Bitcoin going into next week, Bitcoin trying to recover, but you can see that was very short-lived.
Now, I’ve also been pretty vocal about this one, that I think that Bitcoin will have a pretty good size rally, end of September, third week of September, right into October. But this is the third year of a three-year rally in a three-year cycle with Bitcoin. Three years up, down s significantly, three years up, down significantly. So, this is the third year of a three-year rally. Uh, I don’t know if this is the top for Bitcoin. It very well could be. I’ve pointed that out, but I think, for now, uh, we would expect a little bit more downside on the Bitcoin side until the end of the month, and then we would look for longs. But the predicted differences are rising. The pink line above the zero line. Again, uh, there is no downward momentum here. Position of the predicted RSI with the 60 40 split. No, still, still could have, uh, longs could be building here. But, in my respectful opinion only, I believe they’re going to try and push this down towards the calendar yearly opening price at 93,804 before we see a bigger rally to the upside in October. So, watch those levels very closely.
Euro versus U.S. Dollar ($EUR/USD)
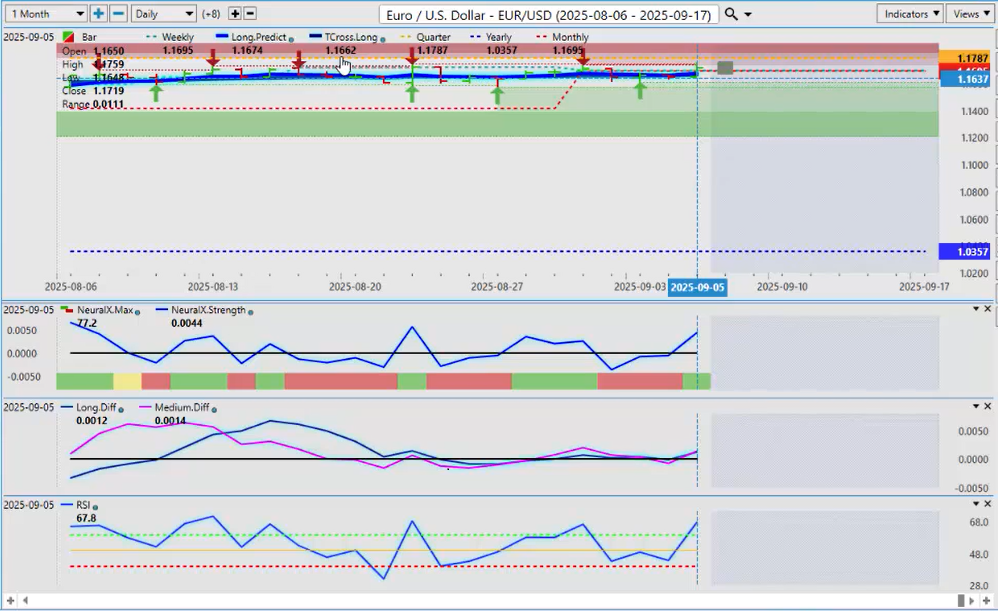
Now, when we’re looking at our main forex pairs, all eyes are going to be on Euro US next week yet again. So, what we need, or what this pair needs to do, is break above the quarterly opening price at 11787.
And despite that, um, weak payroll number, we still couldn’t get above it and stay above it. So, 11787. Another way to play this one, guys, is you can have a buy stop ready to go at, say, $11790.
It breaks above the quarterly opening price, you immediately take a long, because again, I will point out this is an outlook, not a recap of something that’s already happening or something that’s already happened. We’re looking at next week and trading strategies to apply. Right? So, that is one particular play. Okay. Now, our tcross long is 11662.
The alternative to this is to straddle these areas and put a sell stop below 11662.
So, if we break down below the VPT cross long, you can immediately get into a short position. But make no mistake, uh, the, an excellent way to gauge the strength of the US dollar is against this pair. The DXY, the UUP, they’re all heavily trade weighted to the euro, guys, right? So, if this breaks higher, uh, the euro US breaks higher, the dollar will see weakness right across the board. Okay? And the indicators right now are suggesting that the euro is going to push higher next week. But my optimism on that still remains slightly guarded, based on what I’ve discussed so far in the outlook.
U.S. Dollar versus Swiss Franc ($USD/CHF)
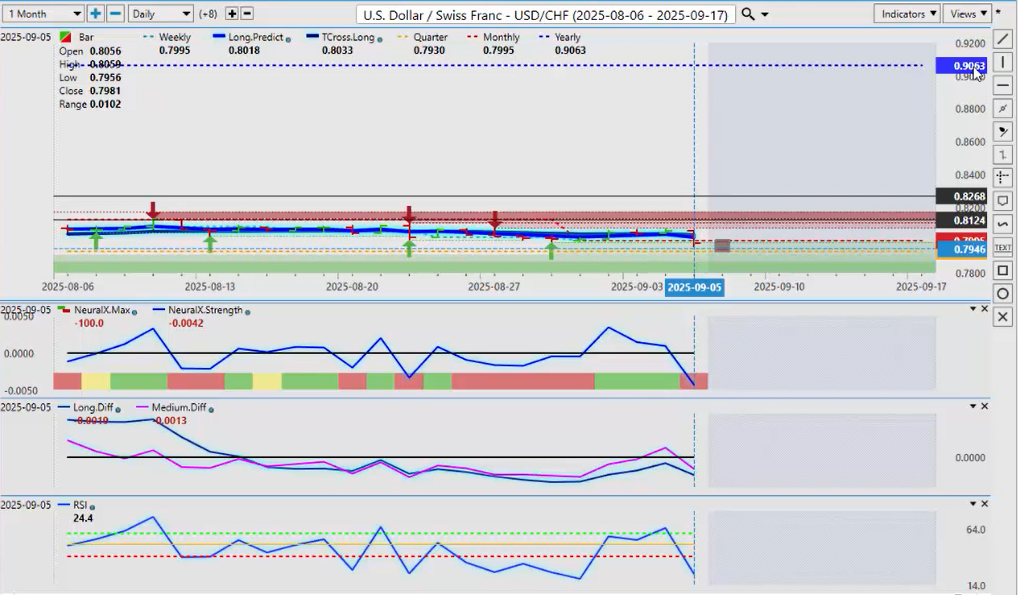
Now, the US Swiss Franc once again falling victim, breaking down below the monthly opening price, but not decisively, but the indicators here are bearish. The primary trend on the year is down, at, we’re below 9063. We’ve been below this the better part of the year. So again, uh, right now, the T cross long, that’s a big number, guys. 8033. We’ve got to get back above, above that quickly. Uh, by, preferably by Wednesday or Thursday, we need to be above this area if the dollar has any chance at all. And the core indicators in BP are saying that’s not, that’s unlikely to happen. But again, a lot can change, uh, with the CPI data next week, the Fed speaking, all the Fed members speaking. So again, watch those levels very, very closely.
British Pound versus U.S. Dollar ($GBP/USD)
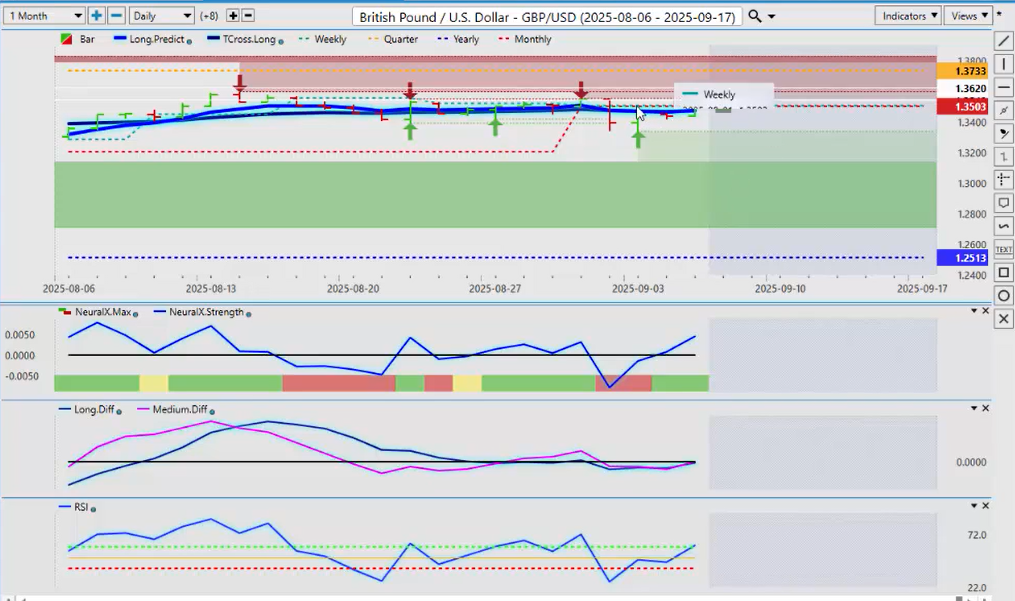
The pound dollar this week also succumbing to dollar strength right out of the gate, but it’s recovering. It’s above the tross long. It’s above the long predicted. Uh, so again, right now we’re closing the week at 13509, and you can see 13472, 13474, that’s the long predicted and the tcross long. We’re above both of those. We’re above the calendar yearly opening price. But that monthly opening price at 13503, there is a lot more going on around this particular area that the average trader will ever realize. Right? So, if we can get above the monthly opening price and stay above it, then that would confirm we do have dollar strength, uh, dollar weakness, excuse me, coming. But, uh, I would respectfully submit, getting too aggressive on dollar shorts, I would hold off until midday Tuesday, personally.
U.S. Dollar versus Japanese Yen ($USD/JPY)
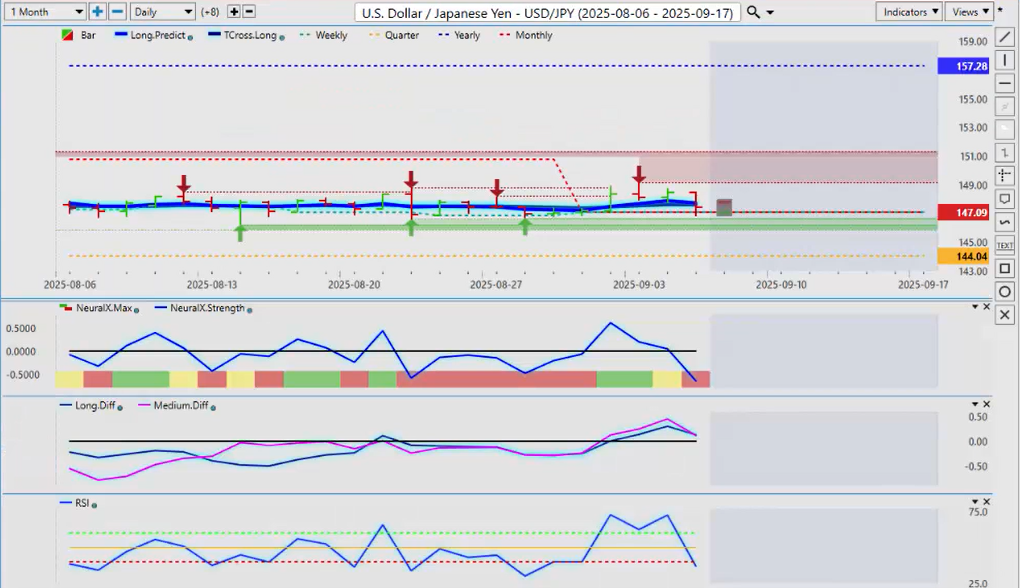
Now, when we look at the dollar yen, it too under pressure here. The indicators are looking quite bearish here. Now, when, when I look at this, there’s a number of things I want to take into consideration. What is the primary trend? The primary trend is down, guys. Don’t let anybody tell you otherwise. If the trend was up, we would be positive on the calendar year, which we are not. We are literally, uh, we’re down a considerable amount from the calendar yearly opening price. An exact number there would come in at, or about, on a, on a profit, profit calculator basis: we’re down 6.18%.
So yes, the dollar yen has had per, had periods of strength, but they’ve been very short-lived. So, right now, again, that is problematic, to say the least. If we lose 14709, the monthly opening price, we’re already below the TCROSS long at 14738.
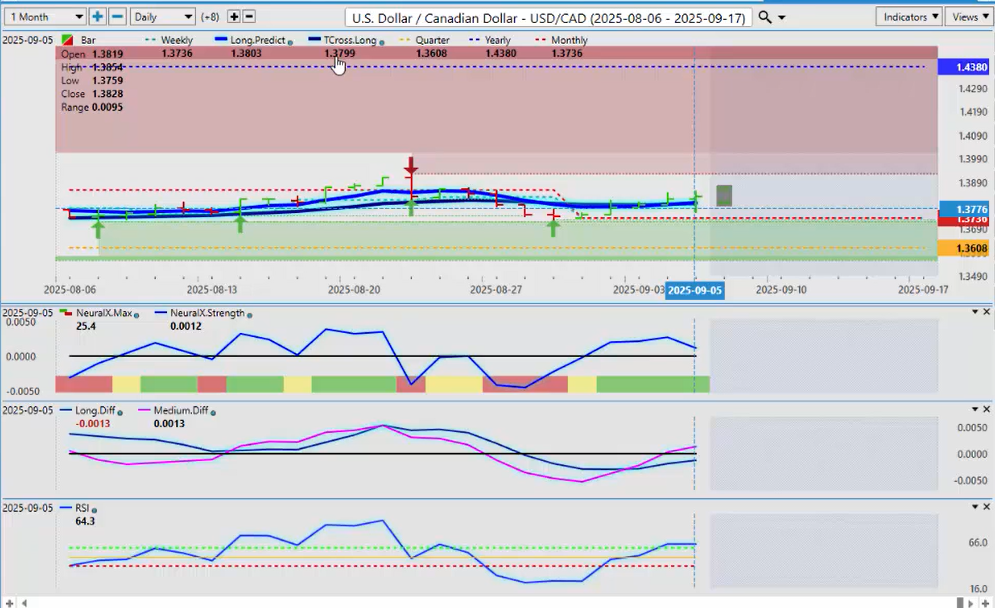
U.S. Dollar versus Canadian Dollar ($USD/CAD)
Uh, this could see the carry trade starting to come apart at the seams, meaning that the market believes a bigger rate cut is coming from the Fed, and maybe we get a little bit of a hawkish Bank of Japan. Hard to say, but this is a quite the juggling act between these two central banks. So, we’ll see how it plays out. But for now, definitely, uh, definitely on the bearish side. And it’s all basically because of interest rates and the market believing that the Fed is going to have to do multiple cuts in 2025. And I’m not quite in that camp yet. Uh, I believe that, um, the data is not exactly accurate, but it will become more accurate as we get into September, October, and November, pointing out again that the dollar index did rally in October and November of last year because the Fed got it wrong again in September of last year.
So, we’ll see how it plays out, but definitely bearish.
Now, very little to help the Canadian dollar here again, the tariffs, Canada likely moving into additional rate cuts. So, rate cuts are not just about the US, guys. They’re across the board. The, in New Zealand, Australia, um, Europe, Great Britain. So, you’ve got all these banks looking at cutting. So, they can’t just put all that on the US dollar, in my view, even though they’ll try. Right now, uh, there’s very, very few reasons to buy the Canadian dollar. And now, the primary trend is down from 14380.
But this appears to be the best the Canadian dollar can do. So, without a trade agreement and some of these tariffs going away, then it’s just going to get more and more difficult for the Canadian economy. So, I know that a lot of the banks are saying that fair value is at 120. I don’t know what their calculation is on that, because I would argue fair value would be 145.
Uh, so again, it all depends on the matrix we use to calculate this, but if I’m basing it on economics, uh, the, regardless of what happens in the US, its dollar is heavily favored against the Canadian dollar. So, right now, we’re again above the monthly opening price. We’re above our t cross long, 1379. That’s the area to keep your eye on, guys. And then the monthly opening price, 13736. So, we’ve got a lot of support here, and buying it down to those levels, for now, is reasonable. We’ve got oil prices sliding. We don’t know for sure if the equity markets are going to survive September or not. Questioning whether the Fed is going to cut 50 basis points, 25 basis points, or just a 25 basis point cut, and then that’s it—saying he’s not doing anything else until more data comes in. That’s the scenario I believe he will do after the debacle last year. So again, a lot going on here, but, uh, a good strong MA diff cross right there. We’ve got a medium-term crossover. If we can get the long-term crossover going, I think we’ve got momentum, and the predicted RSI, 64.3.
Momentum clearly is building. And if the US dollar is weak right across the board, that doesn’t mean the Canadian dollar necessarily will strengthen. So longsavily favored and ultimately, by year end, can’t rule out 14380. The only thing that could save the Canadian dollar is if the tariffs are dropped and a trade deal is in place. And right now, there is very little light at the end of that particular tunnel.
Australian Dollar versus U.S. Dollar ($AUD/USD)
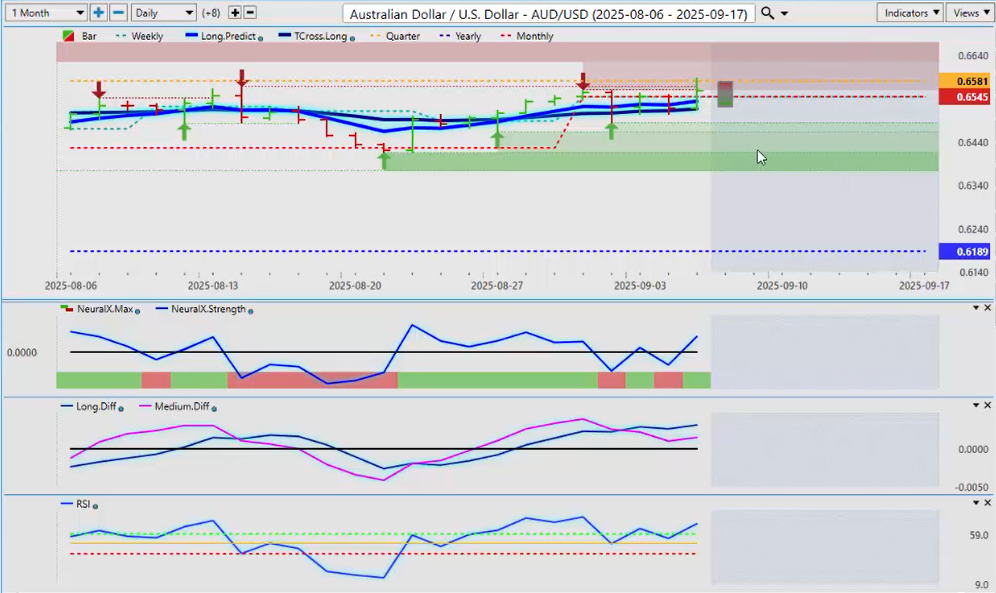
Now, the Aussie and the Kiwi, they’re going to fall into about the same category here. Can stocks move higher. So, right now, uh, we’ve retaken the monthly opening price. The question is, can we hold above 6545?
I believe it will be very difficult in the month of September. October, November, that may be different. December, but for now, our TORS long, the additional support, there’s your supports right there. Clear as day, guys. And the resistance support is down to as low as 6516, and our resistance is the quarterly opening price at 65.81.
New Zealand Dollar versus U.S. Dollar
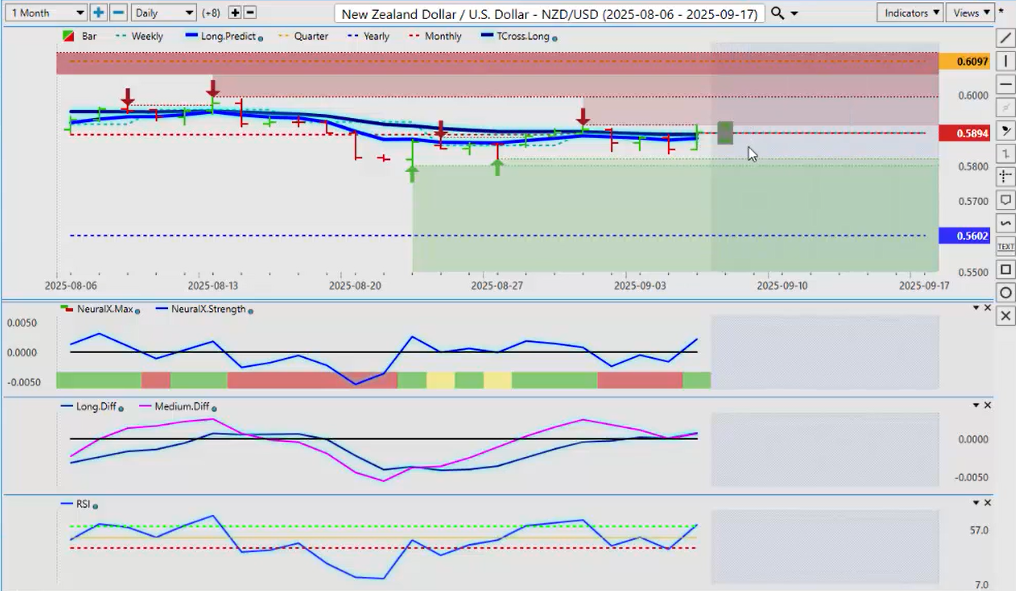
So, if we can clear 6581 and stay above that, you’ve got yourself a long trade there, guys. But, uh, my optimism on that at this time of the month remains heavily guarded. So, be careful of a false break of that area. But if we can stay above 6581, longs will be an easy play. And it’s a very similar situation with the Kiwi. The, the main thing is, can the, uh, can the Kiwi advance here? That’s the main thing. Now, the quarterly opening price there, and I’ll say this respectfully, I think the Kiwi is better value now that the market’s overreacted to this, to the rate cuts there. So, the monthly opening price, 58.94, the question is, can we get above this and stay above this? It is looking good down here—the predicted RSI, the MA diff cross, the neural index—everything is looking quite good here. Uh, so again, uh, maybe a little bit better value, uh, on this pair versus some of the other G7 pairs. And I believe we have some type of trade deal the US does with Japan. If they can get something going with China here, that would benefit these Pacific currencies, the Aussie, the Kiwi, the yen. It would help all of these. So, it’ll be a very interesting week ahead next week, too. Just remember, Thursday is where you’re going to see your volatility with that CPI, but also remember it’s lagging data from August, just like that payroll number. So, with that said, this is the Vantage Point AI market outlook for the week of September the 8th, 2020.