Register for a Free Live Training
The Hot Stocks Outlook uses VantagePoint’s market forecasts that are up to 87.4% accurate, demonstrating how traders can improve their timing and direction. In this week’s video, VantagePoint Software reviews forecasts for SPDR SPY($SPY), Crowdstrike ($CRWD), Netflix ($NFLX), Uber Technologies ($UBER), SNAP ($SNAP), Abbvie Inc. ($ABBV), Northrop Grumman ($NOC)
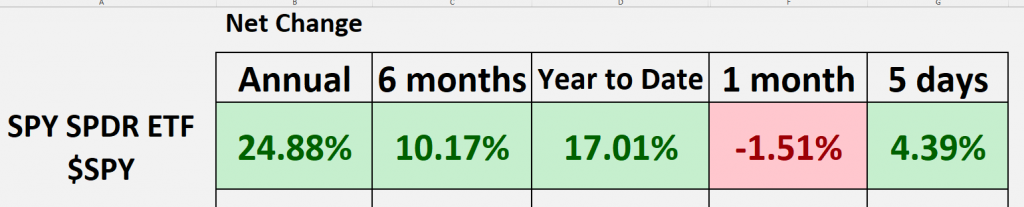
SPDR SPY ETF ($SPY)
Hello again, traders, and welcome back to the Hot Stocks Outlook for August 16th, 2024. I hope you all are having an excellent week out there in the financial markets, and as always, we’re going to be taking a look at the most recent VantagePoint AI predictive forecast. So, if you haven’t already, make sure you go ahead and click on the link in the description below, and you can sign up for a live demonstration so you can learn all the specifics about how these predictive technologies are helping traders make better trading decisions day-to-day in the marketplace.
And so, I thought it’d be a good opportunity to really review a lot of the markets that we’ve looked at over the past several weeks, so we can really understand how these predicted forecasts adapt and are forward-looking as the markets trade and move forward here. Typically, we like to look at the SPY—it’s really a gauge of where we’re at—and so, with the recent rally, we see that bumps us back up to about 17%. We had a really rough month here, and so this is what we’ve highlighted over the past several weeks here: You really want to be careful. We see a lot of markets downtrend; it’s a great opportunity to hedge the portfolio or even get short. But over the past couple of weeks, really after the futures open last week, we saw the markets go about 5% lower, and they’ve slowly crawled back each and every day, now the past 5 days up about 4%. And so, it’s a great opportunity to go ahead and revisit some of those markets that we’ve looked at over the past several weeks and highlight how all of these predictive indicators work.
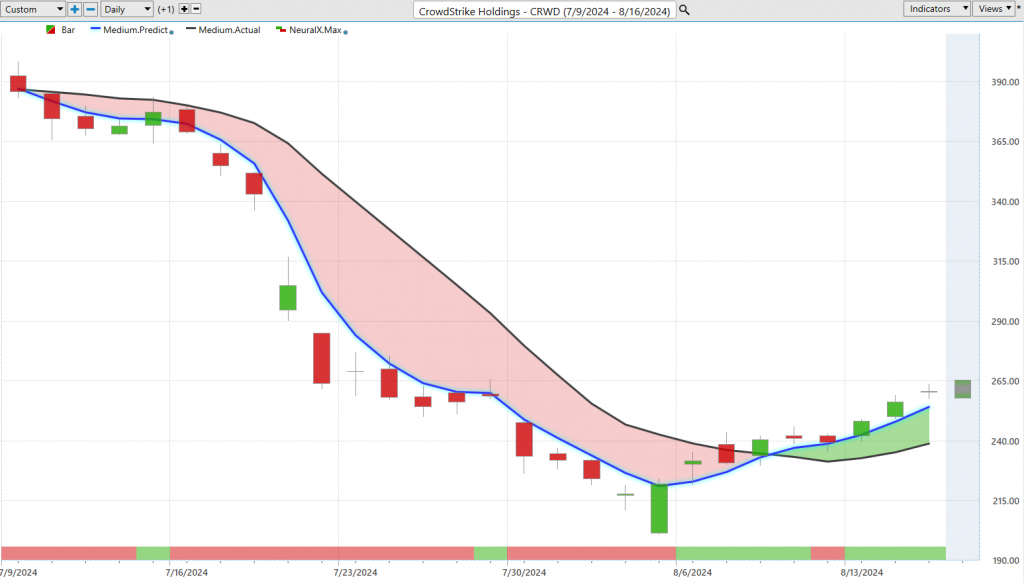
So, uh, here we have CrowdStrike Holdings ($CRWD)—shares of CrowdStrike—and what we’re looking at here is the daily price action, right? So each one of the candles on the chart is going to represent a full and complete trading day. And right up against that price data, the first thing that you’re going to notice here is there’s a black line and a blue line value. Now, the black line that you’re seeing there is a simple moving average; this is a very common technical analysis indicator. In this case, it’s a 10-period, so to look back over the previous 10 closes, add them all together, and then divide by that number. But what we’re able to do is really use that as a baseline; it lets us know where market prices have been, but all of the calculation that goes into generating this value comes from the past, and it also just comes from the single market here, in this case, the past closes of CrowdStrike. And so, what VantagePoint traders are able to do is compare that value—essentially, where prices have been—to this forward-looking predictive value. And for this number—essentially, a price, a calculation of future prices—for that number to get calculated and plotted on the chart every evening for traders, well, this is where the technology of artificial neural networks comes into play, and they’re performing what we would call intermarket analysis.
And so, what we understand is that there are many markets that affect and drive the future price of CrowdStrike. Now, these can be positive correlations, inverse correlations, leading and lagging relationships, but this is where the neural networks are able to figure all of that out and understand what are the important price clues that we can derive from those data sets to generate highly accurate future price predictions. And so, this can be things like the ETF or other tech stocks, but it can also be things like the value of currencies, like the dollar index, or global interest rates, as well as, you know, ETF groups that are going to scoop up a whole grouping of individual shares all the way down to even individual stocks, right? That may share some very subtle but important market relationships that offer these very valuable price clues. And so, that information is used to generate highly accurate predictive indicators that don’t suffer from the lag of traditional technical analysis. And so, whenever we see this blue line cross below the black line, well, it’s suggesting average prices are going to start going lower—essentially, those predictive indicators are skewing in a bearish way based on those intermarket relationships. And so, what we can see here is as long as that blue line remains below the black line, you’d want to short, take profits on shorts, look towards that style of positioning. And you see, we got about a 37% decline in the past 23 trading days. But what I want to highlight to you is, well, what’s happened more recently? Well, if you actually look at the very bottom of the chart, you see you have this bar that goes from green to red back to green. Well, you can combine that with the overall trend from our VantagePoint predicted moving average, and this is another indicator that’s also utilizing that predictive data, but it’s very short-term, so it’s only looking ahead 48 hours, or two trading days, and it’s picking up on short-term strength or weakness in the market. Now we see, as we’re in that downtrend, sometimes that neural index will get bullish; you might get a gap up in a couple days of strength, but as long as the overall trend is lower, you would want to short and keep taking profits on short positions. What you’ll notice in these subsequent forecasts is, look how bullish our neural index gets over the past couple of weeks. And so that’s what the software is doing, is it’s going to use these indicators to start skewing, in this case, to the bullish side, letting you know, hey, there’s some short-term strength coming in. Now, based on your criteria, we can say, okay, well, once that blue line crosses above the black line, well, then we might want to go ahead and get long, and can help us with the positioning—actually predicted high and low levels—so every single day, you’re actually provided a prediction of the next day’s high or low range, and this is what traders are using to really get excellent entries in the marketplace. And again, all of these indicators are utilizing neural networks to really pinpoint and find, uh, really solve this specific problem, right? So, when we look at those predicted highs and lows against the actual market data, well, we can see when we’re in a downtrend, it really works great as a level to go ahead and take a short position, and so, subsequently, maybe take some profit on that weakness. But notice how, after that crossover moves to the bullish side, we get this excellent level where we move down towards the predicted low, and since we’ve seen about a 9% rally here, uh, in shares of CrowdStrike. So just in really this past week—this being Monday through Thursday—you actually would have had this crossover, uh, at the end of last week on Friday, letting you know, hey, this week we actually have some strength here; you may want to go ahead and get long. And again, really pinpoint that entry that allows you to really capture that 9.8, almost 10% here, uh, going into Friday morning’s session.
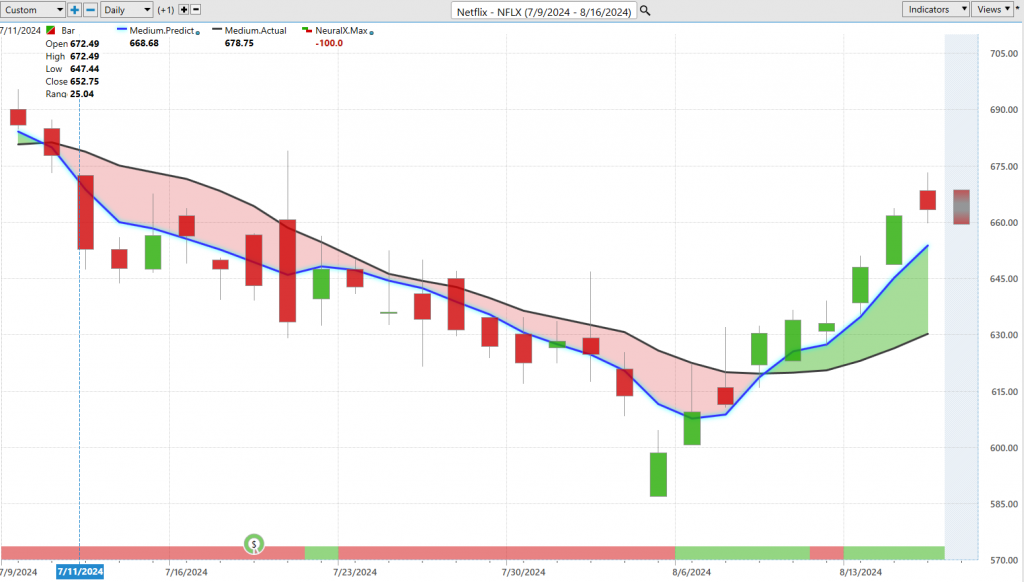
Uh, here, let’s move Netflix ($NFLX) forward to Netflix. So we saw again, a lot of these tech stocks very bearish, and so we got those indications that say, look, if you want to hedge the portfolio, you can get short, take profits on short positions as a shorter-term trader, uh, and really take advantage of this really, really aggressive decline that we got over the course of uh, last month here. But you see about a 133% decline just over 19 trading days. Obviously, traders want to avoid a lot of that mess and noise, but what you’ll notice here again is the neural index gets bullish, a couple of days of strength, but the overall trend remains lower. But let’s look more recently; look at all this strength from the neural index saying, look, every subsequent 48 hours, expect strength, outside of this one trading day here where, in that case, it would be a wrong, uh, uh, forecast. But this is what’s excellent about this neural index; it gets this right upwards of 87% of the time. So when you know the overall trend direction, you’ve got tools like the VantagePoint predicted highs and lows to really pinpoint the entries. Well, this is real where traders really combine all of these predictive tools. And again, you see this move lower on Monday, moving down towards the predictive low, uh, and seeing a lot of strength broadly here in the market as the overall trend is up, and we see these neural index and predicted ranges start to move higher.
So, uh, again, about a 6% move just in the past four trading days, again, a lot of this strength we’re seeing being very recent here.
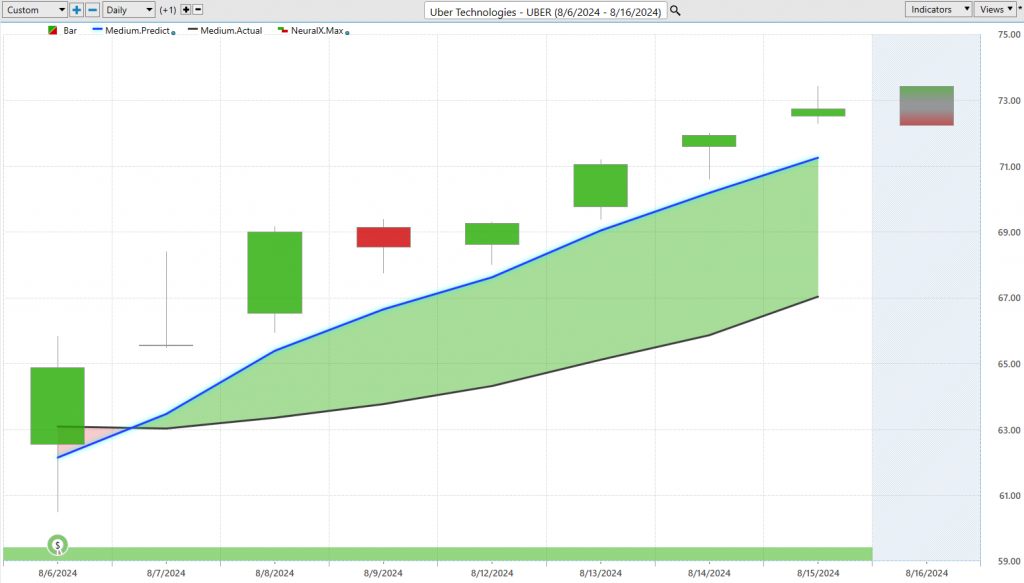
Uh, here’s Uber Technologies ($UBER)—a market that really responded well to earnings. So as you see, all that noise comes through and earnings, you’re going to get a lot of volatility, but look at this neural index forecast. I mean, pretty much for the last, let’s see, seven, eight trading days here, you’ve had a bullish configuration says the overall trend is up, and much like those previous examples, well, we have these finer, you know, refined tools to come in and say, okay, well if I’m trying to be a buyer, where do I want to come in and accept the position? In this case, you see actually on Friday, uh, is where we moved down towards that predicted low, a little bit of volatility going into the end of the week there, but again, about a 6% rally just in the past five trading days on Uber. And so this is what allows traders to get excellent entries into the market and keep adding additional positioning, uh, that gives them that edge where they can really minimize the risk and make the most of whatever this move really turns into.
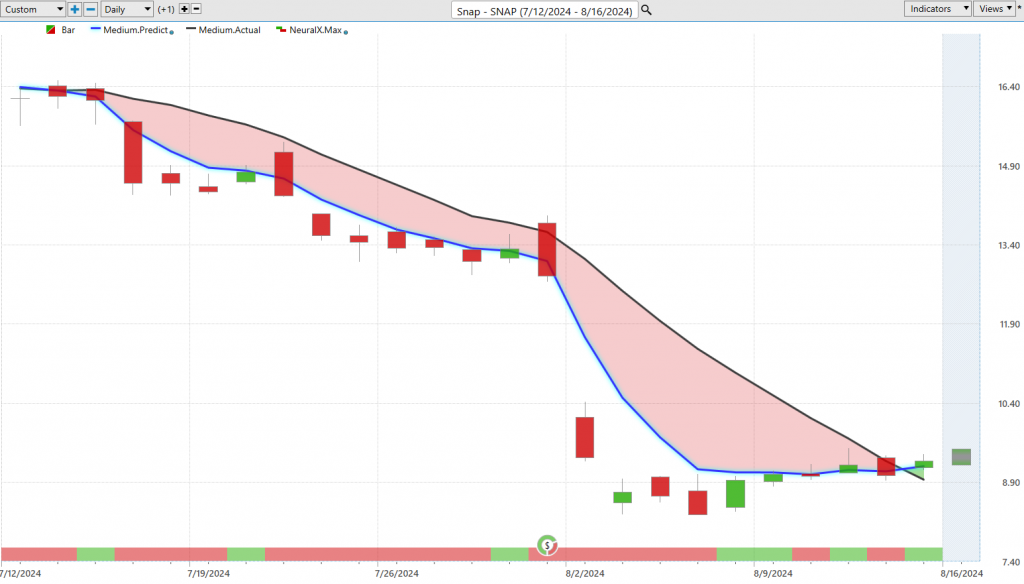
Uh, snap, so this was actually SNAP ($SNAP)—one of the uh, uh, really bearish opportunities that we highlighted, and a lot more weakness here, you see that blue line remaining below the black line until this most recent forecast. And again, we see a lot more strength starting to sneak into the markets, but this is really a fantastic opportunity to get some bearishness into the portfolio; this ended up being a 43-and-a-half% decline in just 23 trading days. So this is exactly what the VantagePoint predictive indicators were warning of—is all of this weakness coming through the tech space. Warning you, hedge the market, maybe go short, depending on your trading style, timeframe, and approach, uh, but now we’re seeing a lot of that start to turn around. And even here in SNAP, a very weak, uh, opportunity, getting a crossover; neural index bullish, uh, and we may see some strength there as well.
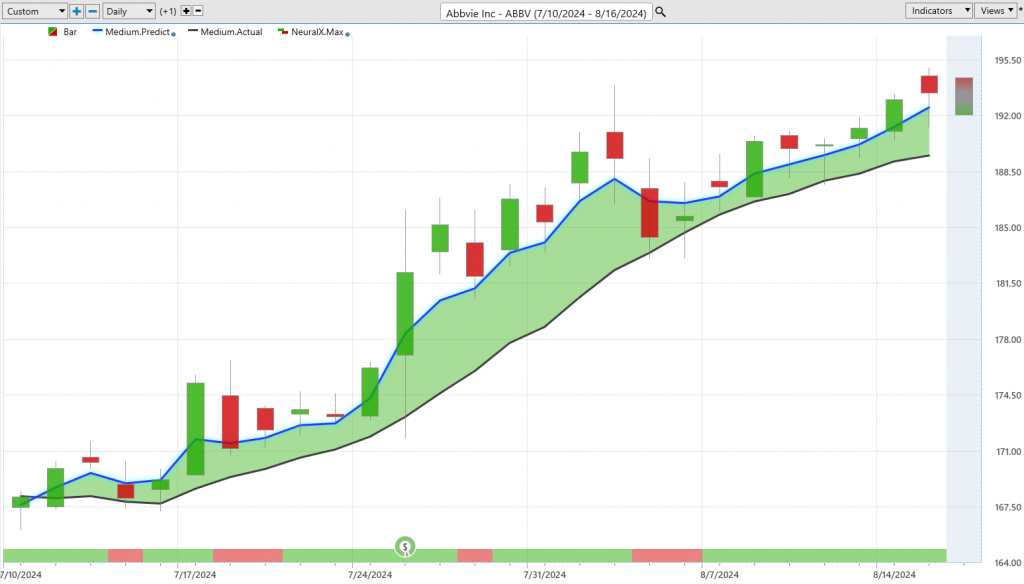
Uh, AbbVie Inc. ($ABBV)—here’s ABBV, a pharmaceutical stock, and so this is getting to some of these opportunities that never turned lower, right? So when you have these tools that say, okay, well, look, ABBV is still in an uptrend; it’s not like many of those other tech stocks that are turning lower, uh, we see a lot of that was really confined to those bigger, you know, Nvidia, Microsoft, all those bigger stocks weighing down the overall index. Again, here you see this blue line crossing above the black line, a little bit of bearishness from the neural index when you sometimes get these sideways periods, but overall a very, very bullish trend. And of course, we can look at those predicted highs and lows, and you see how this works; get a little bit of choppiness here, but you’re just moving down towards this predicted low, and the market just keeps marching higher each and every trading day. Again, this being a weekend, see a lot of noise around some of these levels, uh, but look at this last week—predicted low, predicted low, predicted low, predicted low, uh, and the market grinds higher each and every trading day. But again, this being one of these areas, had never gone into a downturn, had repeatedly the forecast been very bullish. We see about a 14, almost 15% rally in the past 26 trading days.
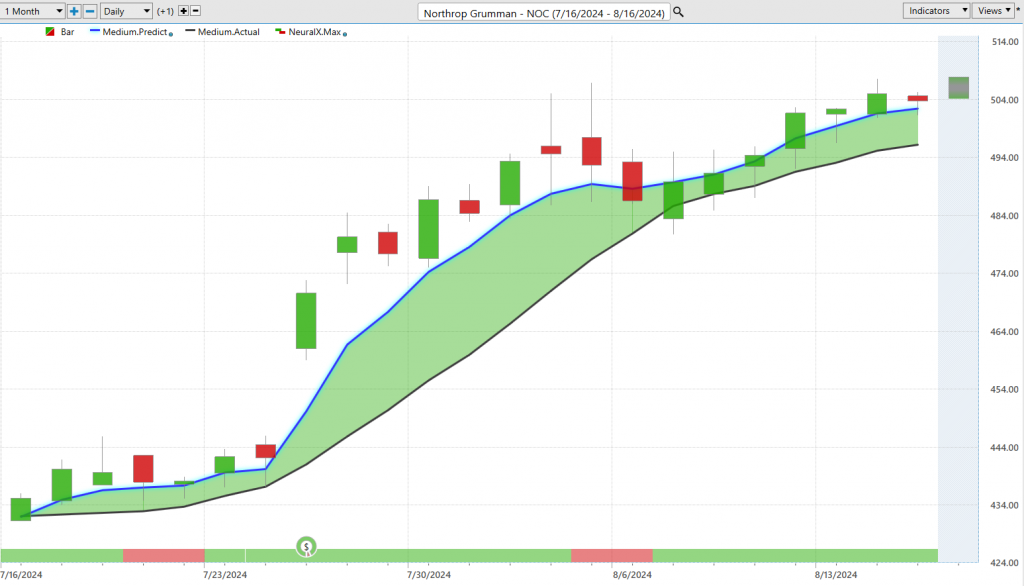
Lastly, we’ve got Northrop Grumman ($NOC)—so one of the areas that while the tech stocks were turning lower, actually highlighted a lot of this bullishness are those tech stocks, and we look took a few at I think Lockheed Martin and Northrop Grumman here. Uh, here again, another refresher here as we see this blue line cross above the black line, neural index goes a little sideways here, but you see that is a very strong, uh, uh, forecast, of that blue line is still very healthy above the black line, neural index gets bullish again, then we see this huge move after earnings. But that’s the one thing is, is the market, or the, the software here can’t account for earnings, right? You’re going to see that volatility, and of course, you’re likely to move past things like the VantagePoint predicted highs and lows when you get that big rush of buyers coming in. But look how quickly the software adapts here, right? So we get all that noise, and then very quickly, the software does a very good job at saying, okay, what’s happened here in Northrop Grumman, what’s happened in some of those intermarket relationships, and what’s most likely to occur here as far as the short-term price action. And again, we see even this week offering another really nice entry over the week here, and maybe even a potential, you know, a couple-day trading opportunity as you move from predicted high, or from predicted low to predicted high, about a 2% rally there just over a couple of trading days.
So, again, there’s been some really nice opportunities that have opened up, but this is where VantagePoints and Telescan, and many of the features found that allow you to scan for VantagePoints predictive indicators can help you identify those shifts as they’re occurring. So, whether you want to look for fresh crossovers or some of these other predictive indicators skewing to the bullish side, this is what’s helping traders identify these things as early as possible, uh, and participate in some of these rallies that we’ve seen most recently.
So once again, this has been our Hot Stocks Outlook for August 16th, 2024. Thank you all for watching, best of luck out there, and bye for now.