


Hot Stocks Outlook for the Week of
December 11th, 2020
The Hot Stocks Outlook uses VantagePoint’s market forecasts that are up to 87.4% accurate, demonstrating how traders can improve their timing and direction. In this week’s video, VantagePoint Software reviews forecasts for Wynn Resorts (WYN), Spirit (SAVE), Gray Television (GTN), Regeneron(REGN) and ElectronicArts (EA)
Register for a Free Live Training
This Week’s Hot Stocks Outlook
Hello again, traders and welcome back to the Hot Stocks Outlook for December 11th, 2020. Hope you all are having a excellent week out there in the financial markets, and we certainly have a lot to cover today. So I’m going to start out here with shares of Transocean. We’ve looked at energy stocks really over the past several weeks. We’ve got Wynn Resorts, Spirit Airlines, Grey Television, Electronic Arts, and lastly, Regeneron here.
Transocean (RIG)
So, but what I really want to highlight is really going through things a little bit differently today, and Transocean is a good way to explain these predictive indicators that you see on the chart. And so, for shares of Transocean, that being a energy exploration company, obviously that’s going to share an important market relationship with markets like oil, but it’s also a equity, right? So it’s going to share correlations with the S&P 500 and other stocks. It’s going to share correlations with oil sector ETFs as a group.
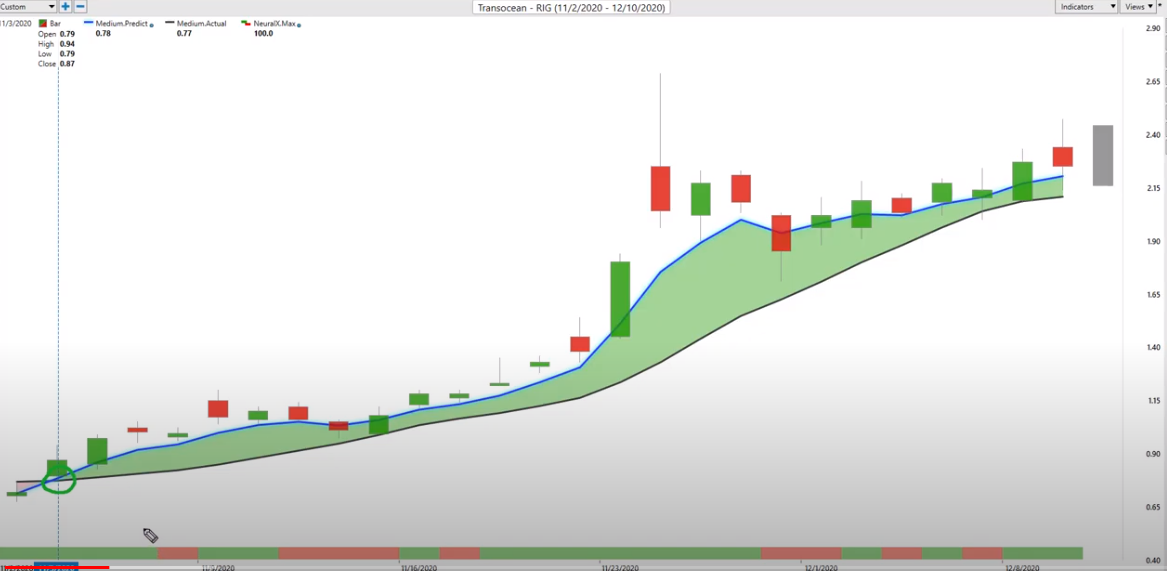
And that gets to the heart of what VantagePoint does here. If we look at this, we have a set of really a few indicators, right? This blue line and the black line, right up against the price data. At the bottom of the chart, you see that you have this bar that updates every single day and on the very right of the chart, you see, actually you have a predicted shadow candle, so a predicted high and a predicted low for the next trading day. All of these work together to really round out the forecast that VantagePoint provides.
But what’s important to understand here is what’s happening is VantagePoint’s artificial intelligence is neural networks specifically is looking at those intermarket relationships. It’s looking at oil, it’s looking at the S&P 500. It’s looking at ETF groups, it’s looking at global interest rates and global currencies, and it understands how those relationships are likely to influence the target market, so in this case Transocean. What it does with that information is actually generate future predictions of price, so things that haven’t yet occurred yet, really a raw prediction of what’s going to happen in the market over the next couple of trading days and it takes that data.
And in the case of this predicted moving average, works it into the value of this indicator. So rather than having something like a simple moving average or an exponential moving average, that just looks at the past closed price and has the problem of really getting dragged around by the most recent prices, this indicator is actually forward-looking and thus generate signals earlier more broadly.
So when we aggregate this over all the different stocks you can trade, you’re going to be getting signals earlier in helping you understand that, hey, there is an opportunity and something going on, not just here in energy stocks, but broadly across the markets. Because as we know, energies and oil crude ETFs, and the crude oil market affects equities. There’s a strong relationship there. And when oil prices move higher, stocks tend to do the same way.
So here in Transocean, again, we looked at this really last week and we’ll update the forecast, but you see that at the beginning of November was really where we started to see all these markets move higher. And that’s where the really great asymmetry, as far as a trading opportunity opened up. You’ve seen this market specifically has moved up 167%. And this is not just Transocean, you’ve got Plains All American, PBF Energy, oil refiners, all these things, making huge gains 50, 60, 70% in this case, more than doubling here.
If we go ahead and I can actually highlight how accurate these predicted highs and lows had been. So this is something we looked at last week, but if you’re looking at okay, well, how would a short-term trader want to come in and trade Transocean over the last week since we looked at this stock, well, you see that you get these updated predicted high and low forecast before each and every trading day. And what happens is the actual candle will then populate that space.
And you see, we’re not going to hit that every single day, but you see this trading day, you don’t get too much of a dip. You move up to the predicted high and the next day selling off, you’re selling off here, but excellent entries in that overall trend. And that’s what’s going to help short term traders, swing traders, people who trade options, get the best price possible to really limit their overall risk and exposure to the market. So huge opportunity there in Transocean, 165% rally, but just this daily move here about 10% move, eight, if you hold onto it for a couple of days, you’ve got an 18% rally there just in the past few trading days.
Wynn Resorts (WYN)
Moving on to Wynn Resorts. So what you’re going to see with a lot of these markets that have started to move higher is they all started to move higher at the same time. And you want to recognize these things when it all starts to happen, when those fresh signals from VantagePoint come through and are saying, look, average prices as seen through this predicted moving average are going to start moving higher. That blue line is above the black line, and therefore look for opportunities to get long.
Now, the neural index at the bottom of the chart here, this is also utilizing that neural network technology, but you have to train artificial intelligence to do something, right? You have to say, this is what we’re trying to get at. What’s the timeframe, as far as what we’re working in? Well, this specifically is looking at 48 hours ahead short-term strength or weakness, and there’s a component to volatility there, right? So if the market is in an uptrend and your blue line is above the black line, average prices are going to be moving higher, but your neural index is bearish, well expect average prices to move lower over the next 48 hours.
But depending on your trading style and approach, this doesn’t mean get out of the market, oftentimes that means look to buy on the dip. And what’s going to help you do that are those intraday predicted high and low levels. So you see here that even before this trading day here, you have the predicted high and low range slanting lower and saying, look, expect average prices to move lower here, make sure your stops aren’t sitting anywhere inside of this area. But as long as that blue line remains above the black line, the trend is up.
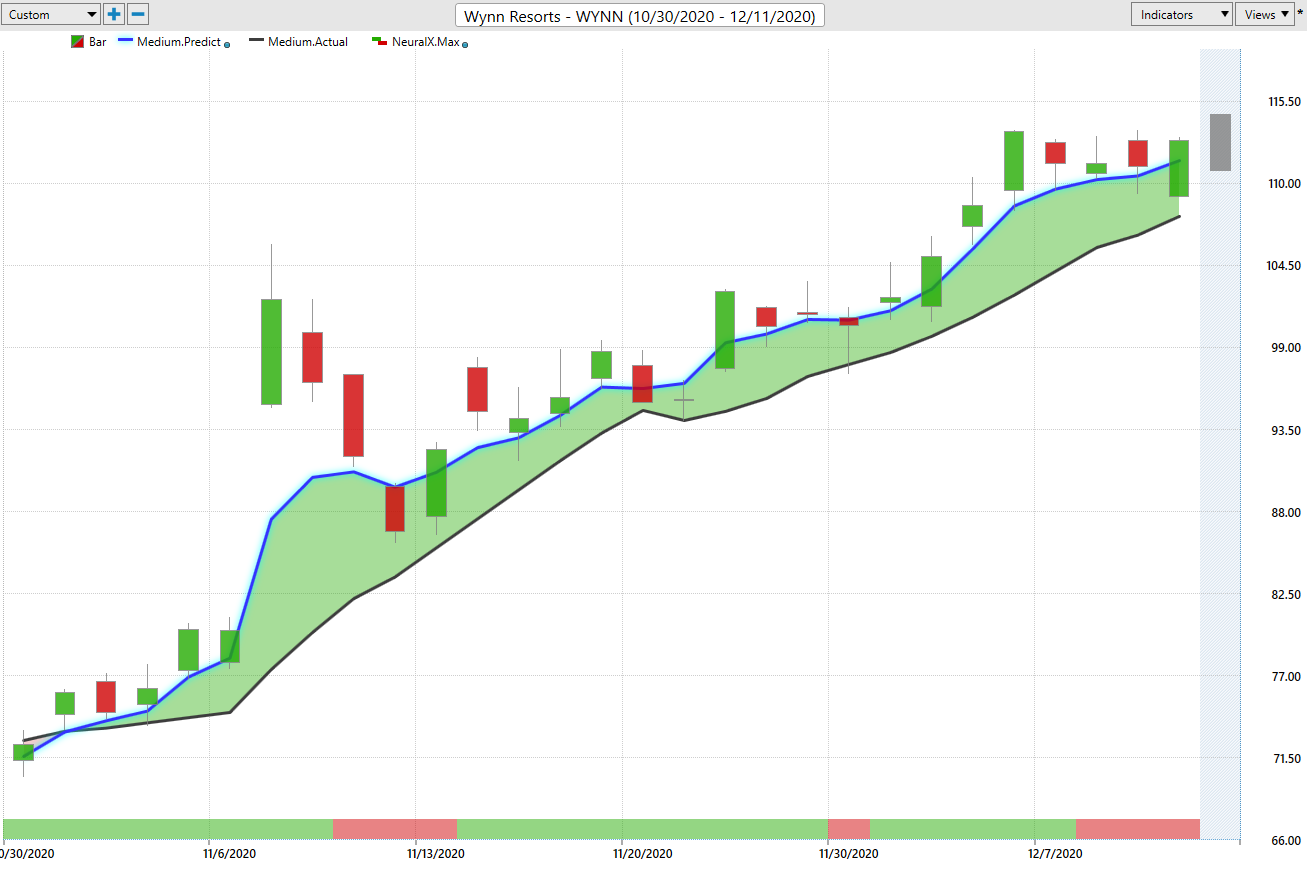
And you see here that neural index goes back up to a one, and you’re pretty hitting down at those predicted lows and immediately moving higher over the next 48 hours. So again, regardless of your trading style and approach, you can take the combination of these predictive indicators because they’re tuned to these different timeframes, right? If you’re a longer-term swing trader, you’ve got the overall trend. If you’re a shorter term trader, you’ve got not only the neural index, but those predicted highs and lows to understand what type of price actions should you be expecting over the next trading day so that you don’t get out of your position too early and also don’t have stops too close to the market, or so far away that you’re taking on too much risk.
Here in Wynn Resorts, up 48 and a half percent, just over the past 25 trading days. And a lot of these resort companies really vacation, destinations and things like that, theme park companies, same thing have a very strong correlation with airlines. And we see here that blue line crossing above the black line right at the beginning of November, that’s where the real opportunities open up, where there was a huge asymmetry to get long in the market. And we’ve seen stocks move up considerably and very broadly, right? This isn’t just one tiny area of the market, the S&P 500 has made a very similar move since the beginning of November.
Spirit (SAVE)
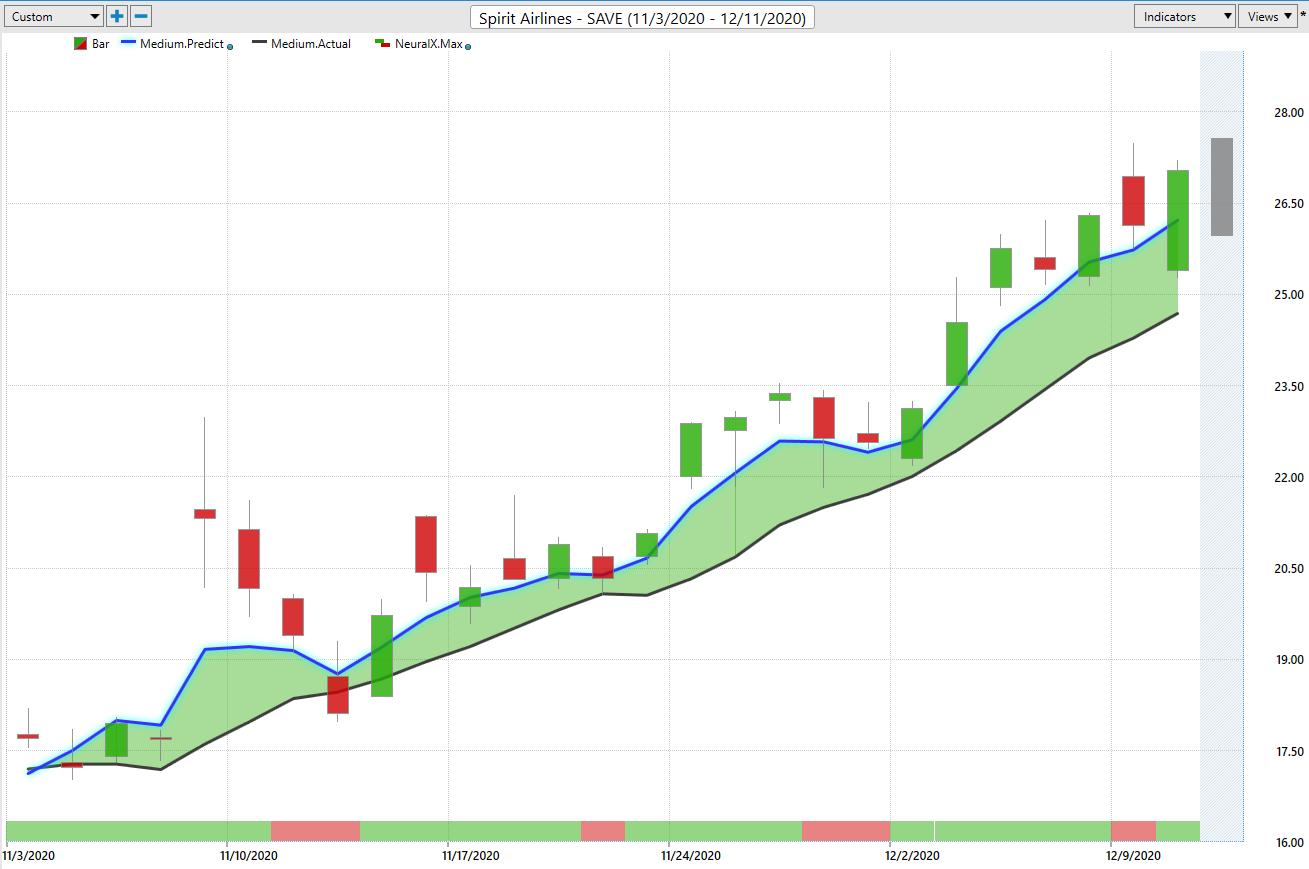
Here Spirit Airlines up 52% in just the past 25 trading days. Again, we can take a look at those predicted highs and lows and understand that, okay, well, if I’m trying to get a position here, well, all of these areas in the market where this predicted low is hitting, well, those are good areas to go ahead and take a position within that intraday timeframe as long as that blue line remains above the black line. So you see there are about what was one, two, three, four, five, six, seven, eight entries into that market over that 52% rally over really the past five weeks as far as the overall calendar here, about 25 trading days.
Gray Television (GTN)
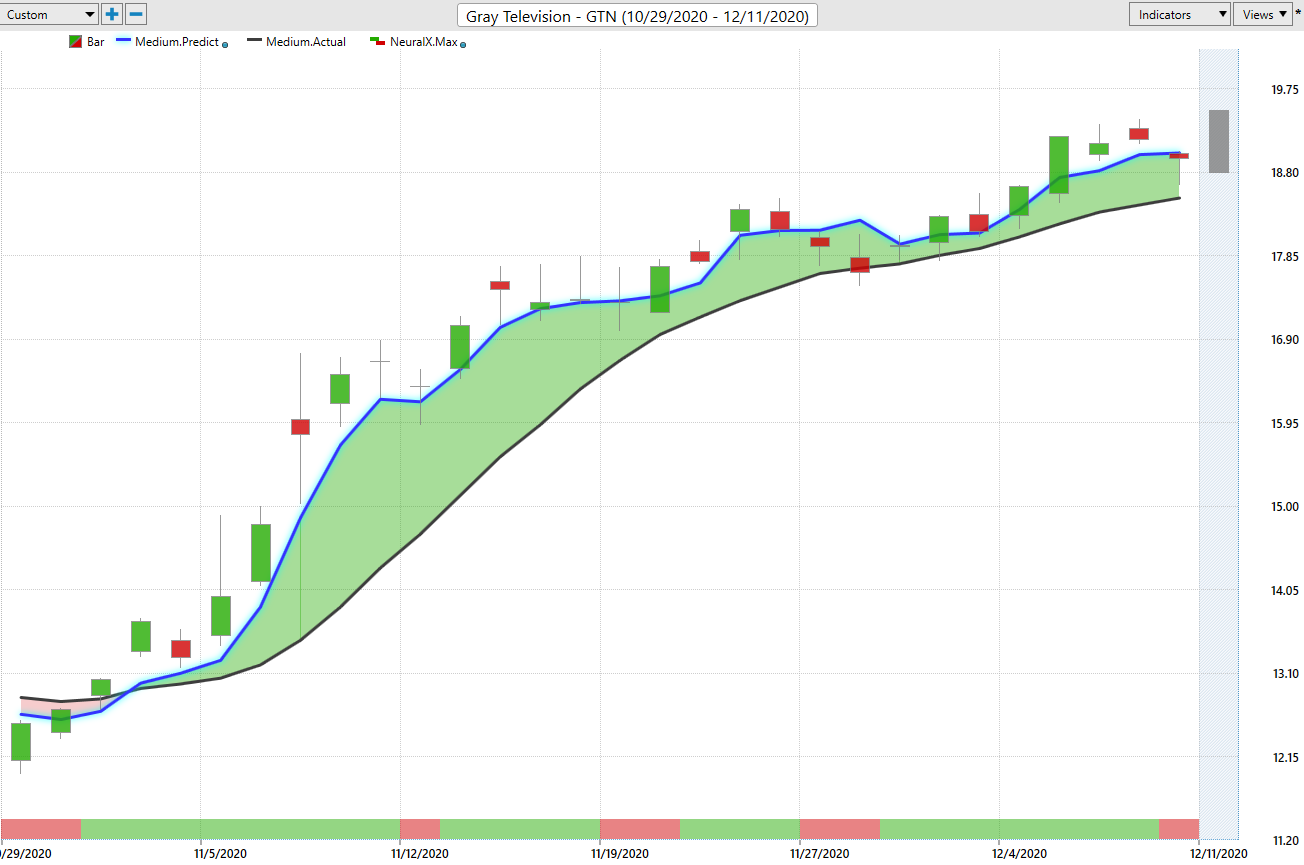
Gray Television, same thing, right? Blue line crossing, the black line. And what you’re able to do is run a scan on all of the markets every evening. And what that makes you aware of is where are these areas of the market turning higher. And as we know, when things like energies start to move higher, that’s going to have a ripple effect through the S&P 500 stocks more broadly. Here, Gray Television, again, same period of time, blue line crossing above the black line. But again, even if you’re shorter time frame, you’ve got these predicted lows updated each and every trading day. And all of these levels, this black line is posted before that candle is generated. That’s the actual market data compared to the prediction.
So you see here again, one, two, three, four, five, six, seven, eight entries, nine entries here as Gray Television moves much, much higher, and this is a very cheaply price stock. But, the big thing is, again, recognizing these trends earlier and also recognizing the big correlations in the market, that things are starting to shift out there. A lot of these markets are related, and there’s an opportunity really opening up here at the beginning of November to get long. Gray Television up 45% in the last 25 trading days.
And you see that, Gray Television, Spirit Airlines, Wynn Resorts, Transocean, many different areas and sectors of the marketplace, but all making a similar move. And that speaks to the inner market nature of trading nowadays is when you have global equities, whether it’s the Nikkei and the DAX and the S&P 500 interest rates, currencies, all of these play a role. We have the dollar weakening over the past several months, that’s had a lot of boost to commodities and also individual stocks.
ElectronicArts (EA)
Here, Electronic Arts, blue line over black line, neural index bullish all but really one day here. And the neural index, again, is that 48 hour short-term forecasting. And it’s accurate essentially four out of five times. It’s upwards of 87 or 88% accurate over the long haul when we average that out. And so, what you understand is if you’re using that tool to gauge short-term strength or weakness in the market, you can see overwhelmingly here, you’re understanding this is an opportunity to get long. The trend is up, the 48 hour forecast is up. And when you’re at those intraday predicted lows, those obviously generate a nice area to go ahead and get long.
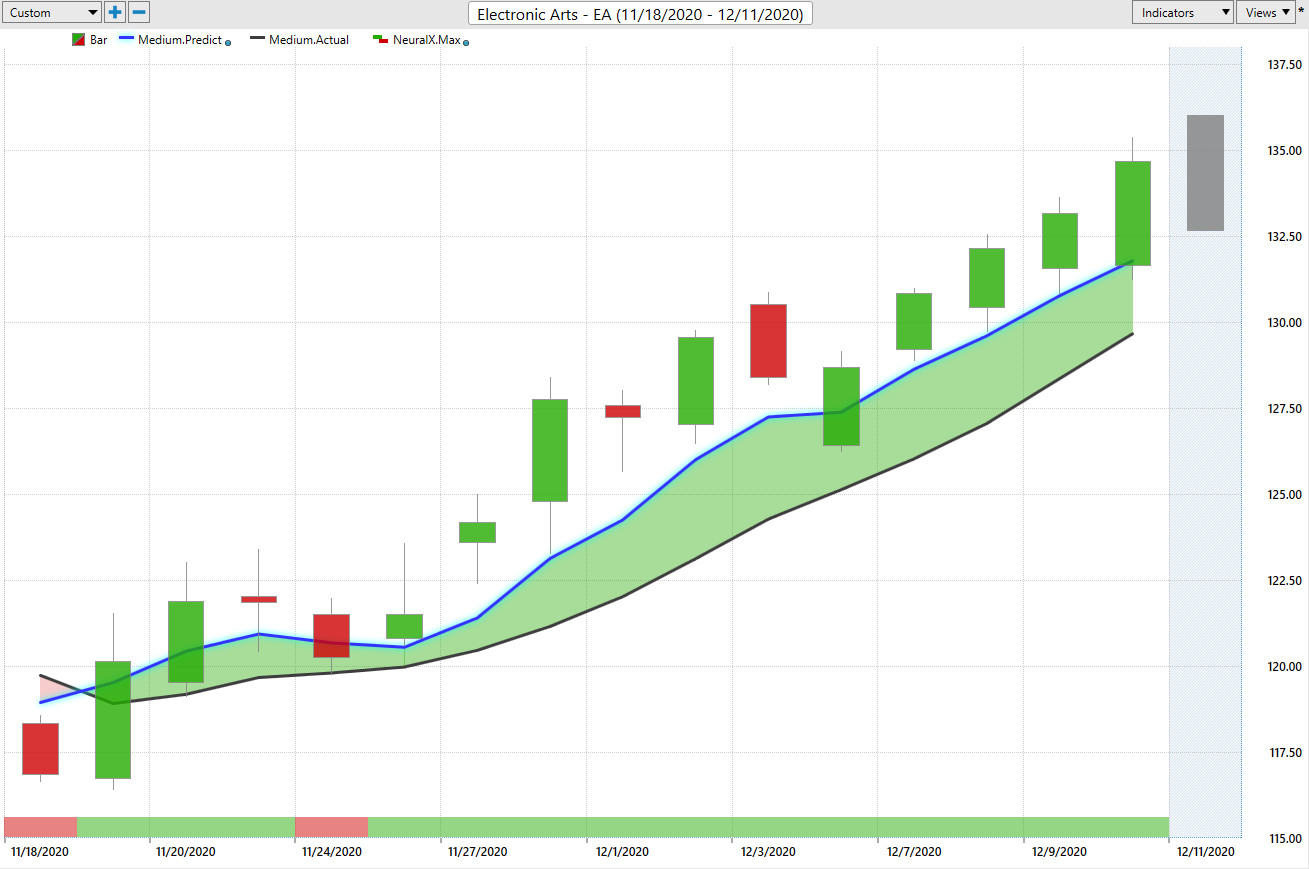
This is what’s interesting about days like this is, if you have a limit order waiting down at those predicted lows, you get filled at the open on a gap down, right? So price is a frothy thing, right? We’re not going to get these predicted highs and lows perfect, but oftentimes when the market opens there’s illiquidity and then all that volume comes in, you really benefit by being ahead of the market and having those orders really waiting and ready to go.
Regeneron(REGN)
Lastly, I just wanted to highlight that there are some areas of the market that are not fairing so well. And here we see shares of Regeneron, in the middle of November this starts to turn lower. And so, what you understand is, look, if you were long in the stock, this is not an area to be long. If anything, you can even hedge your portfolio and potentially look to get short. And look how accurate again, that early predicted high is at really nailing that level and shares almost immediately trading off that neural index very bearish. And we get that acceleration to the downside. Again, you’re going to get frothiness, right?
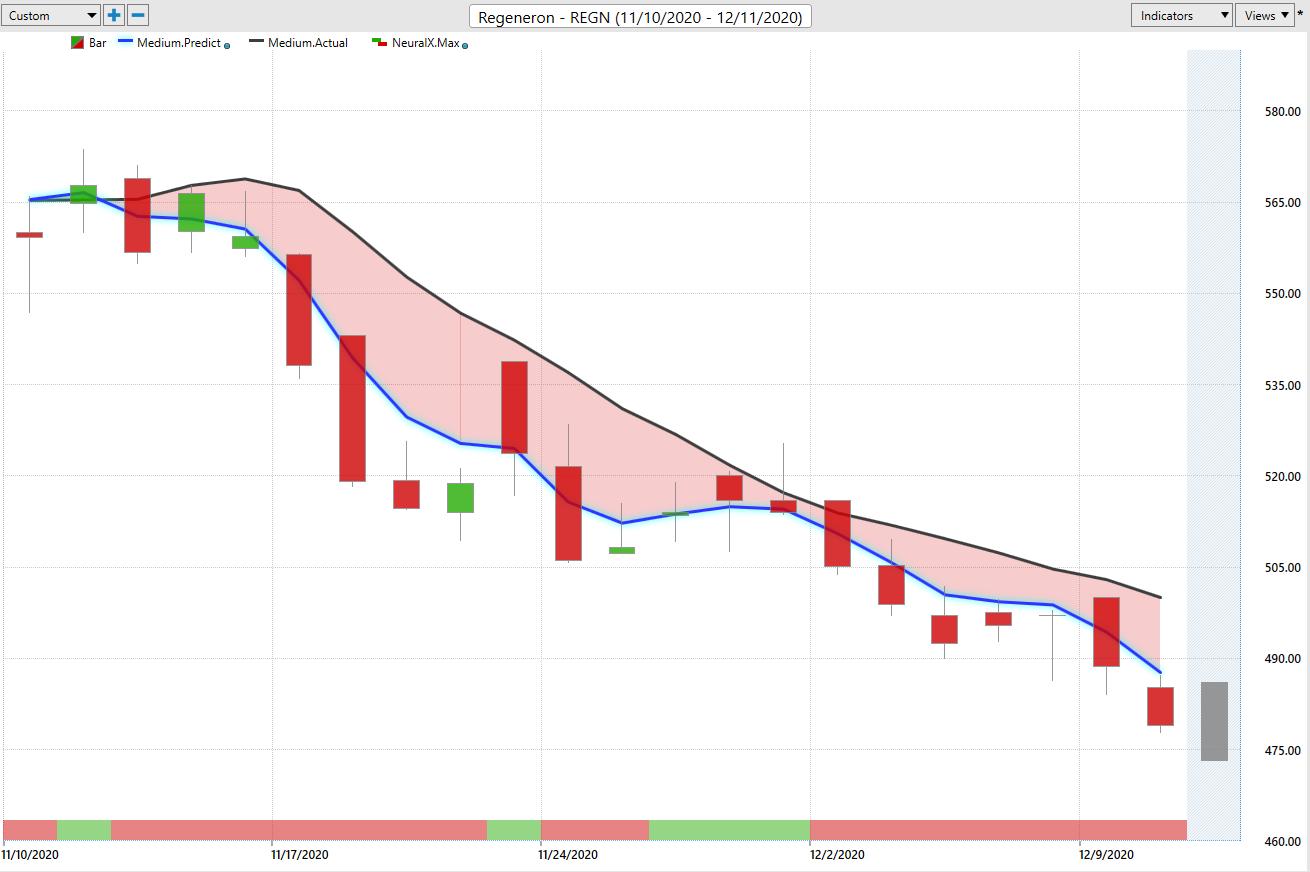
There’s a lot of volatility here, you end up gapping up, but look at the market immediately gap up and trade lower over the next 48 hours. Neural index gets bullish here. You run a little bit sideways here, but still those predicted highs are proving as the higher part of the daily range before things are ready to move lower over the longer-term here.
So shares of Regeneron off pretty good here, not as much as, obviously not 150% like some of these up moves and energies, but 13% to the downside, certainly not an area where you want to be long and that can help you focus on well, where are things really benefiting from that correlation that’s happening in November that carried up equities, carried up oil and a lot of these individual stocks.
So once again, this has been our Hot Stocks Outlook for December 11th, 2020. Thank you all for watching, best of luck out there and bye for now.


