


Hot Stocks Outlook for the Week of
December 25th, 2020
The Hot Stocks Outlook uses VantagePoint’s market forecasts that are up to 87.4% accurate, demonstrating how traders can improve their timing and direction. In this week’s video, VantagePoint Software reviews forecasts for TakeTwo Interactive(TTWO), DishNetwork(DISH), AMDOCS(DOX), REDFIN(RDFN) and ElectronicArts (EA)
Register for a Free Live Training
This Week’s Hot Stocks Outlook
Hello again traders, and welcome back to the Hot Stocks Outlook for December 25th, 2020. Hope you all are having a excellent week in the financial markets, and as always plenty to cover in this week’s Hot Stocks Outlook. So we’ll start out. We have shares of Take-Two Interactive as well as Electronic Arts, so a couple of software video game companies there. Also, Dish Network, Amdocs and Redfin.
Take Two Interactive(TTWO)
So, starting out here with Take-Two, and we can really look at these first two examples really together. And Electronic Arts is actually one of those markets we’ve looked at over the past few weeks and really followed that along as these trends continue. But starting out here with Take-Two Interactive, you have a very similar situation, and that’s really where many of these predictive indicators can be very helpful, is identifying trend reversals across an entire sector or group of markets early.
So what we have here is daily price action. So each one of these candles represents a full and complete trading day. And right up against that price data you’ll see that there is a black line, and also a blue line. Now the black line there, that is a regular simple moving average. So, a very common technical indicator. But one of the weaknesses with an indicator like that is it just look at the past. So really how we’re utilizing it here is to really smooth out the price data and let us know where have average prices been over a given period of time. But what we want to compare that to is the value of this blue line that you see right against the chart. And for that number to be calculated, VantagePoint is performing what’s called intermarket analysis, and it’s specifically utilizing the technology of artificial neural networks to do that. So, artificial intelligence to actually forecast future price.
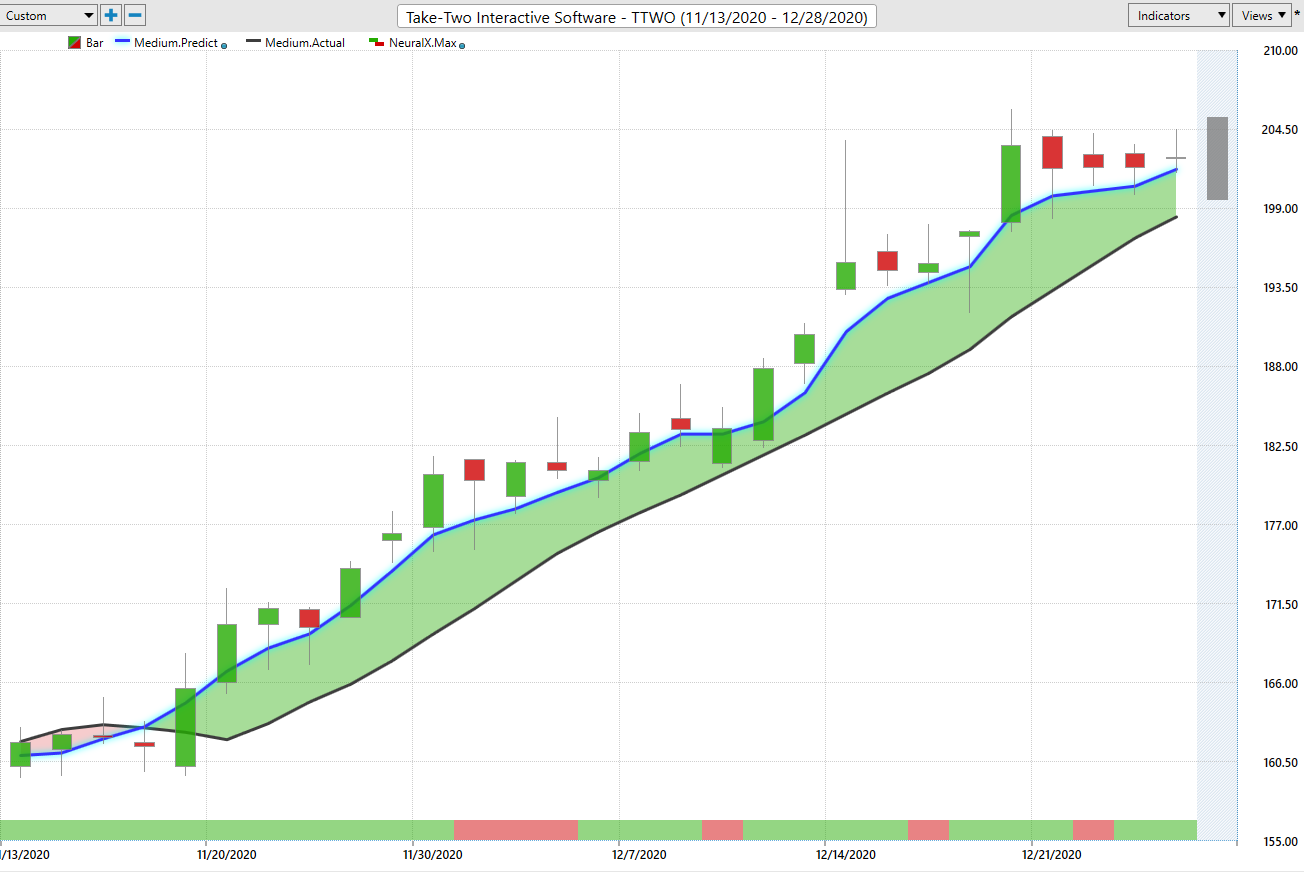
So what that means is rather than just looking at the past price of the target market, in this case, Take-Two Interactive, it’s looking at related markets that are known to drive and influence future prices moving forward. Now that can be things like big global futures markets, like the S&P 500, things like the NASDAQ. It can be things like ETF groups, global interest rates, global currencies. And what it’s able to do is actually understand how those markets are pulling and pushing against that target market, and actually generate future price predictions. So, things off to the right of the chart that haven’t yet occurred. And then those values as actually predictions are built into the value of this moving average, turning what was a lagging tool that just gets dragged around by the most recent close price, into a forward looking predictive tool. So, whenever that blue line and that calculation of that value crosses above that measure of where market prices have been, it suggests average prices are going to start moving higher, and therefore you’d want to go ahead and look to get long in the market.
Electronic Arts (EA)
Now, this is especially important, because we have a scanning feature that actually allows you to scan the entire stock market at once and identify which sectors or which groups of stocks are starting to turn and open up a new opportunity. And so what we see here with Take-Two is very similar to what we see with Electronic Arts, and they often validate each other. And you can understand that, look, something’s going on in this entire sector. This is definitely a place to go ahead and look for opportunity.
So if we look at the very bottom of the chart, you’ll also notice that there is a bar here, and every single day this bar gets updated. And what it’s doing is actually using that artificial intelligence to forecast out just 48 hours ahead. So again, utilizing that predictive approach of how inner markets are affecting this target market, but tuned to only look ahead for the short-term strength or weakness in the market. Oftentimes, I want to look at that as some higher highs or lower lows over that next 48 hour period and use it in context with the overall trends. So as long as that blue line remains above the black line, the overall trend is still up. And in combination with that approach, we can also utilize this shadow candle at the very right-hand side of the chart, is actually a predicted high and a predicted low. And again, that technology of artificial neural networks is being used every single day to pinpoint an intraday low and an intraday high, so that you have levels that you know are acceptable to accept orders, set limits for profit targets and that sort of activity based on again, your trading style and your timeframe.
But again, as long as that blue line remains above the black line, we can see that this market is in an uptrend. And what we have is what that black line represents each day’s predicted low, but before that trading day ever occurred. So at 6:00 PM the night before, you have the value of that black and red level of those intraday predicted highs and lows, and that’s going to help you understand that if you want to be a buyer in this market, look to go ahead and wait for cheaper prices. And even on days like this often work out in your favor in the market where you get a little bit of a gap down, but you see the market immediately trading higher back into the range, and then continuing that uptrend.
So you see here, if we look overall we’ve got about eight entries in that uptrend, and overall the market has had a significant push higher, which if we look at the overall move of that first entry at the beginning, you’ve got a move of about 26% just in the past 24 trading days. So, literally about a month on the calendar, shares up about 26%.
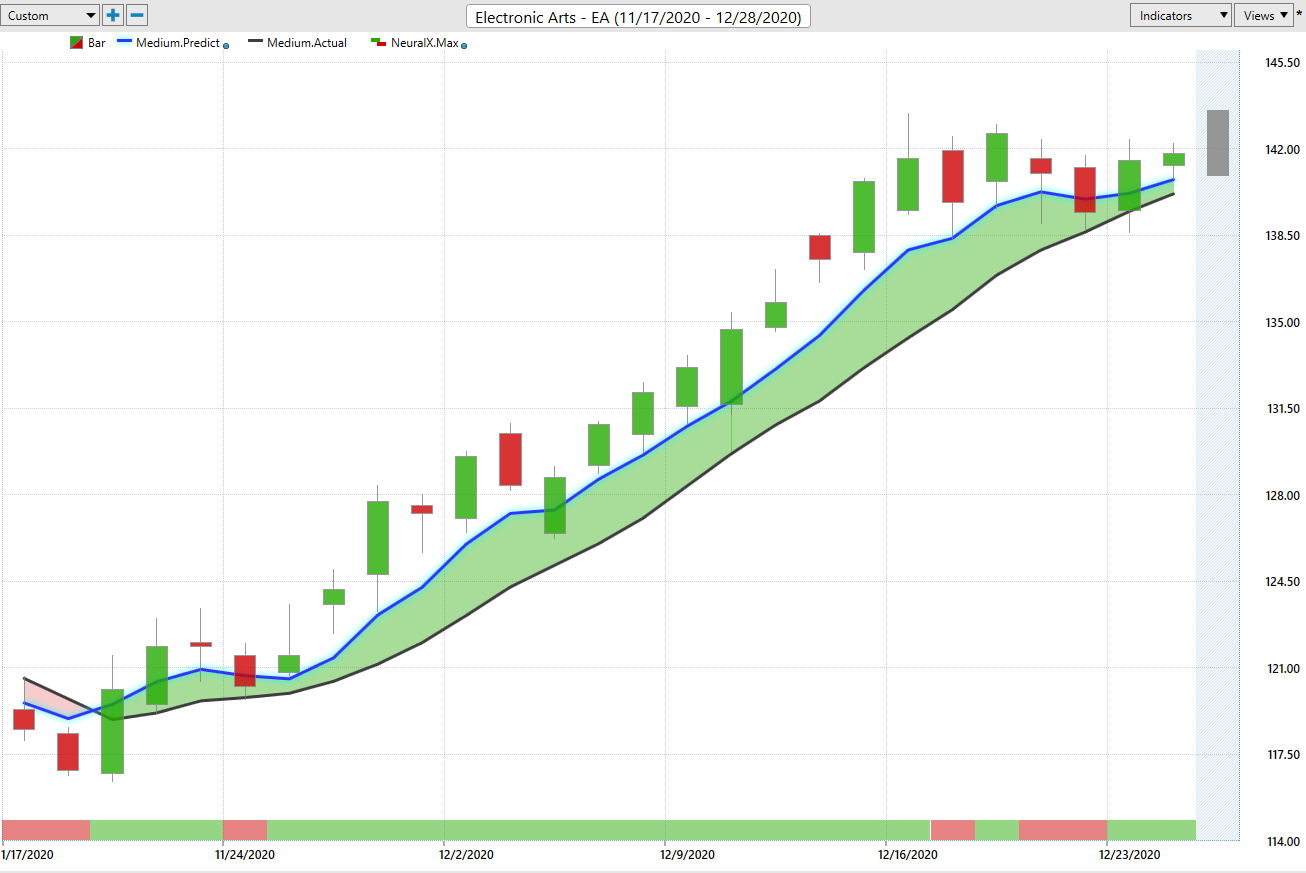
Now, I want to bring in Electronic Arts because we’ve looked at this now three weeks in a row. And what I really want to highlight is that continued effectiveness of the short-term forecasting. So once you understand that, okay well, something’s shifting here, it’s time to go ahead and get involved in these markets. That blue line and the trend is to the upside. We have other markets like Take-Two Interactive also trending higher. You can look at those short-term forecasts. So when we look at the last couple of weeks here, and combine the entirety of the overall predicted moving average, saying we’re in an uptrend, but also things like this neural index going bearish. And what that’s warning you of, is over the subsequent 48 hour windows, expect some weakness in the market. And that can really get you prepared to say, okay, well, be conservative with your price entries, try to buy at these predicted lows or better if you still want to add to that position and participate on the upside.
So you see that combination of factors as we have the overall trend, very much to the upside, but that neural index getting bearish. And you see that the upturn really dies down and we run sideways, but that doesn’t mean that the opportunity’s over. It just actually means that look, be conservative with those entries, really look for the market to decline. Especially how I like to think of it as, expect the market to trade below this predicted moving average, because you can trade above and below an average. And if there’s that weakness over the 48 hours, expect that weakness to come through relative to that average measure of future average prices that you have there.
So again, Electronic Arts, we’ve run sideways here for the last week, but still this market very similarly up about 18 and a half percent over the past 23 trading days. So when you start to see similar markets start to turn up at the same time, it adds to that confirmation that there’s something really happening here, let’s go ahead and pay attention. And really what we’ve seen generally across the market is that shares really rallied in November, and have kind of settled down going into the Christmas and new year period as the S&P sort of runs flat, but that doesn’t mean that there’s sideways action where you can be making money in the markets as well.
Dish Network(DISH)
Here in Dish Networks, a good example though of, as the markets have run sideways, some markets have really fallen off here. And so when we look at this market back at the beginning of November when really the entirety of the market started moving higher, well, great! We recognize that that’s a really great time to start buying stocks. We can identify where that blue and black line separation is the strongest and that there’s a very strong trend. And of course, use the help of those predicted highs and lows intraday to really pinpoint those entries into the marketplace if we’re trying to participate in that move.
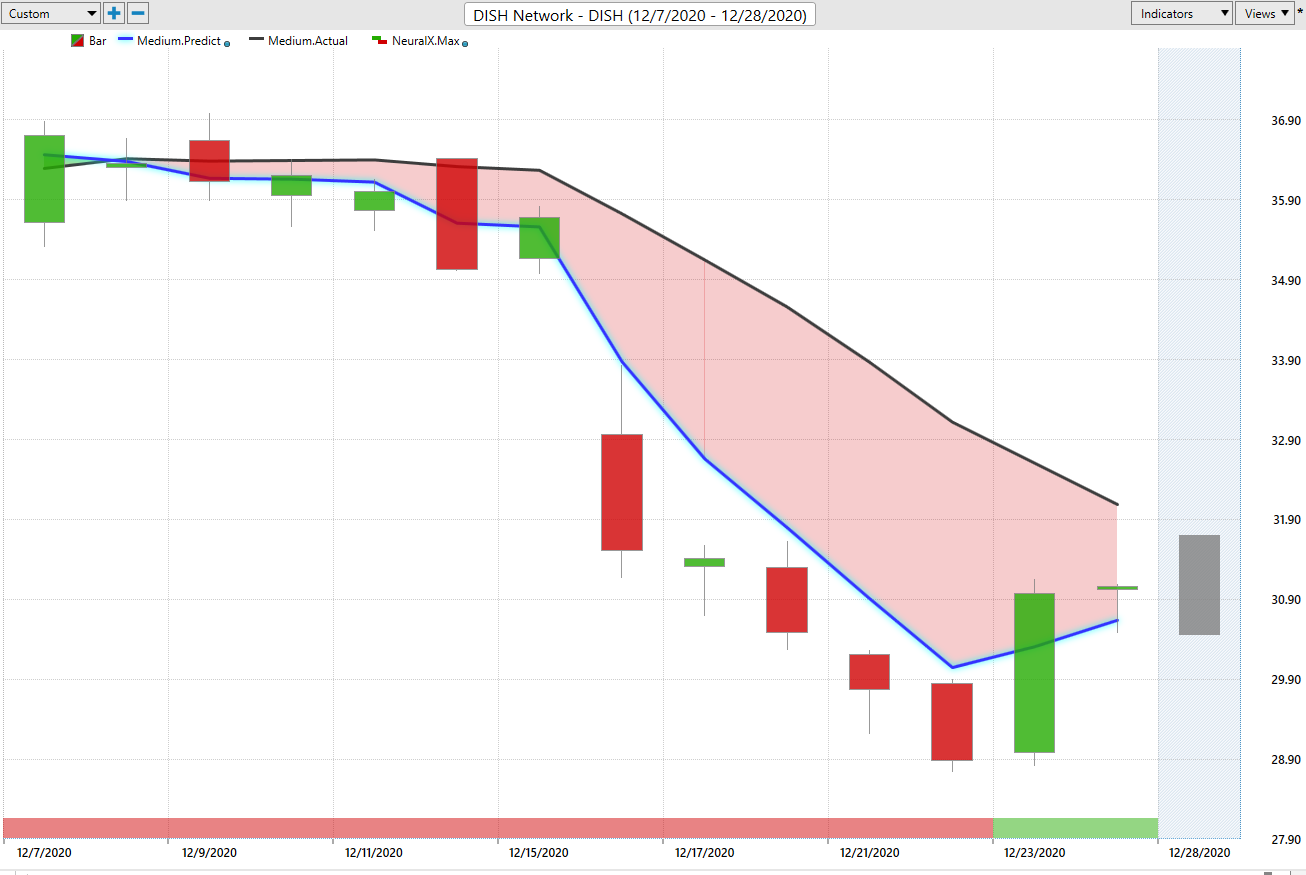
But what we recognize is when those shifts happen in the market. So, what was an uptrend and an opportunity to buy here, you see that that neural index goes bearish. You run a little sideways, it goes bearish again here, and you expect at the very least this weakening of prices over this four or five day period, even if you’re still on the long side of the market. But very clearly, you’re going to get that indication that, look, now the blue line is below the black line. The trend is there for down. Expect average prices to start declining. You still may run sideways over the next few days, but look at all this weakness from the forecast, the overall trend, the 48 hour outlook. And then what you really don’t want to do, and this is why it’s important to recognize these trend reversals early, is you don’t want to get caught up in situations like that, where very clearly this market was four or five, well, let’s say about five days early as far as saying, look, we’re in a downtrend. Look to short the market and cover those short positions, if anything. And then again, you see those really nice entries at the early part of the move before things really start to accelerate.
And so overall, we have Dish Networks down a little bit here. We had this first interaction. It Was almost perfect here. We had some volatility coming into the market as the market bounced back. But even after this big update, having a 16% move to the downside, at one point being a 22% decline in just 10 trading days. So very important to recognize that, get out of the way. But in these opportunities that are still moving higher, opportunities to be buying on the dip. We haven’t gotten that blue line crossing below the black line.
AMDOCS(DOX)
So another example here of Amdocs. Again, that early November period is when we saw a huge turn in the market. And you want to understand, okay, which stocks are continuing that move, which stocks aren’t, and you should go ahead and cover those positions. And we see here with Amdocs, pretty-much over the past couple of weeks, that blue line’s still solidly above the black line. We can again look closely at those predicted highs and lows, and understand that, okay, well, if you’re actually a buyer here in these periods, you’re doing a good job of buying down on that dip at better prices and participating, again, as long as that blue line remains above the black line. We also see very early on in the trade here, even as volatility really picks up, you get a good job with those predicted highs and lows and really adapting to what’s going on, and making sure that you’re getting a good forecast so that you can make better trading decisions over the next couple of days in the marketplace.
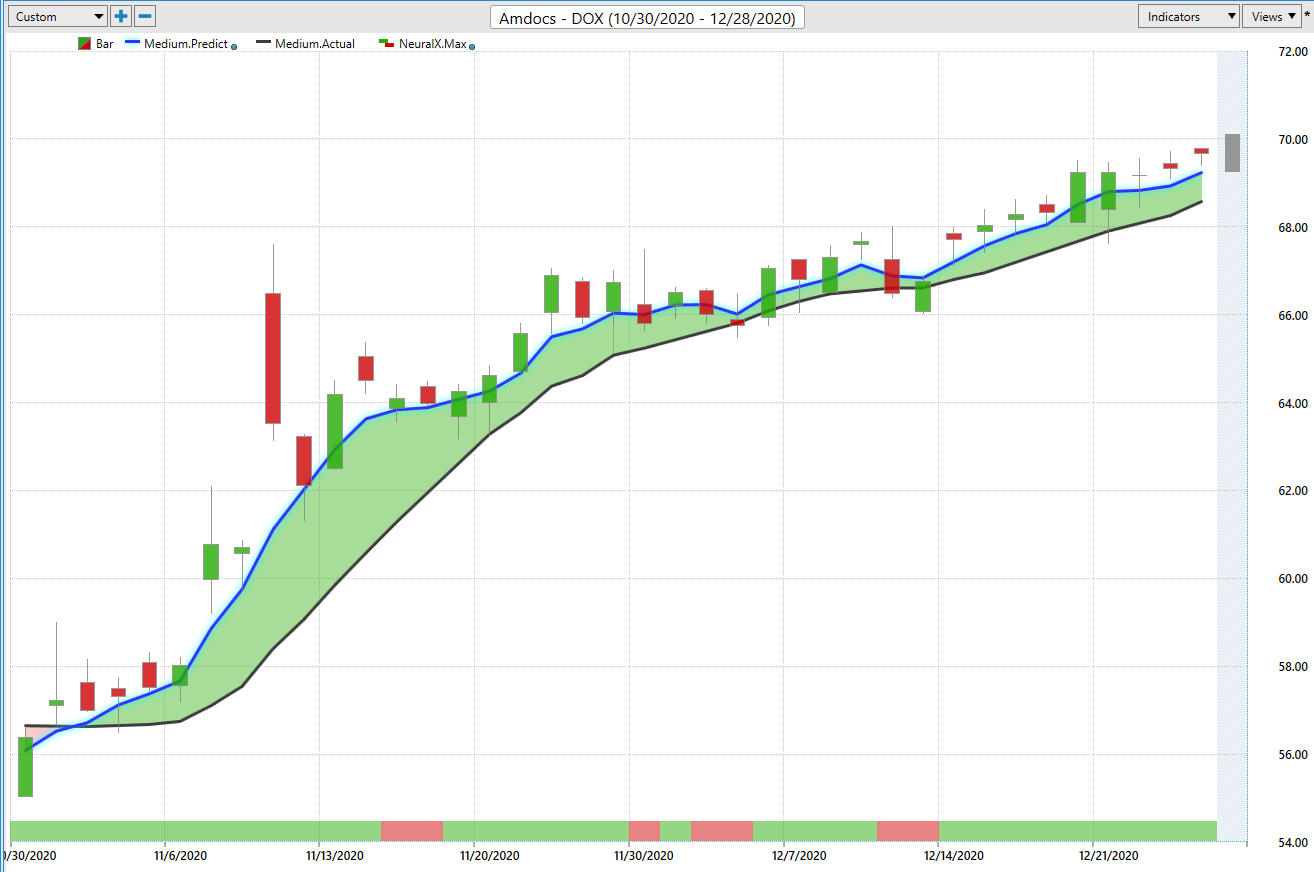
So overall, a really nice move here in shares of Amdocs. We still have that blue line again, above the black line. So some of these areas in the market still showing a good amount of strength along with trend, and the market up 21% in just the past 35 trading days, there, again, in that November period where almost the entire market started to turn higher. We saw the S&P 500 really start to move higher, and over the past couple of weeks things have sort of run sideways. And again, you want to make that differentiation of, well, where are things that you can hold on to, and where are things that are certainly likely to turn into some trouble?
REDFIN (RDFN)
Here, with Redfin, again, this blue line crossing above the black line, and you see situations like this, where you’re getting the sideways price action and that’s what causes that blue line to remain right above the black line with very little separation. You see your neural index goes bearish here, but quickly turns bullish. And then that separation between that predicted moving average and the actual starts to expand. And that really leads you to say, okay, well, this is getting to be a stronger and stronger uptrend as those values separate. And of course, again, we can always utilize that intraday help from the VantagePoint predicted lows to understand that, okay, well, if I’m coming as a shorter term trader, I really need to be particular as far as prices you look to accept in the market. That can be a huge help in getting involved early in an overall trend, but also adding to those positions at very strategic levels so you don’t have to risk a whole lot more to build a larger position and make more money, as that trend continues and things start to accelerate in a particular direction.
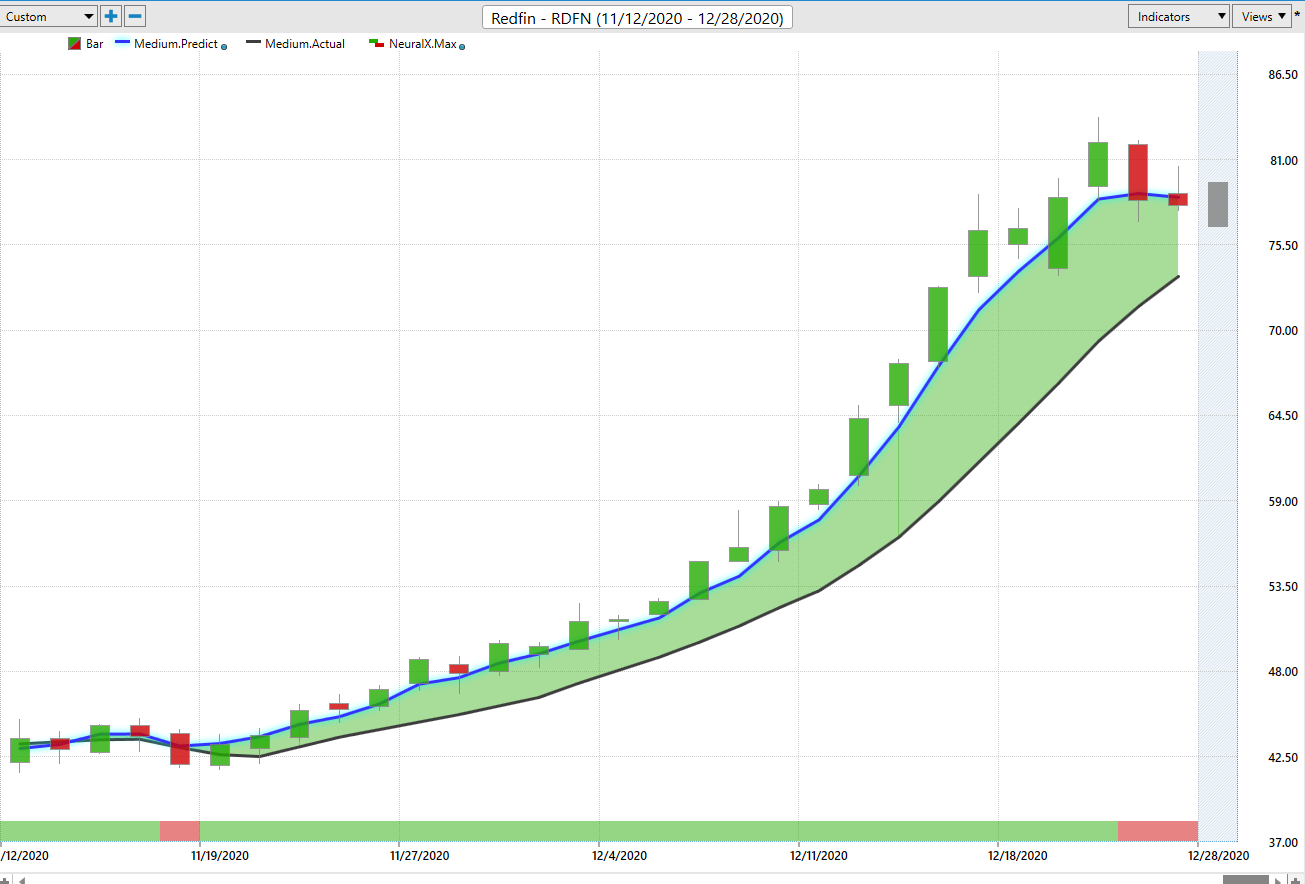
So, a really exceptional move here. We’ve got almost a doubling of the stock price here. Shares up about 78% just in the past 26 trading days. So again, barely over a month on the calendar, some of these markets, they’ve slipped it, some of the energy stocks that are up 60, 70% over that rally period from November. A really nice opportunity here of a 78% rally in just 26 trading days. Again, just a 500 share position here has you up about $17,000 just over the past month.
But once again, this has been our Hot Stocks Outlook for December 25th, 2020. Thank you all for watching. Best of luck out there in the marketplace, and bye for now.


