Hot Stocks Outlook for the Week of February 7, 2020
The Hot Stocks Outlook uses VantagePoint’s market forecasts that are up to 87.4% accurate, demonstrating how traders can improve their timing and direction. In this week’s video, VantagePoint Software reviews forecasts for Square (SQ), Texas Roadhouse (TXRH), Waste Management (WM), which we brought in a couple of weeks ago, a couple of energy stocks, and lastly here, shares of Skechers (SKX).
Register for a Free Live Training!
This Week’s Hot Stocks Outlook
Hello again traders and welcome back to The Hot Stocks Outlook for February 7th, 2020. I hope y’all are having an excellent week out in the financial markets and as always, plenty to cover in this week’s hot stocks outlook. We’re going to go ahead and start out with shares of Square (SQ), Texas Roadhouse (TXRH), Waste Management (WM), which we brought in a couple of weeks ago, a couple of energy stocks, and lastly here, shares of Skechers (SKX).
Square (SQ)
Starting out with shares of Square, what we have here is daily price action. Each one of these candles that you see represents a full and complete trading day. Right up against that price data you’ll see that there’s a black line there and also a blue line. The black line that you see is a simple moving average, so very common and technical indicator. All it does is take the past 10 closed prices, add them all together, divide by that number. The problem with indicators like that is that they only look at past price data.
They have no ability to look forward and make predictions on where prices headed, really only acting as a measure of where have prices been already over a given period of time. What we’re able to compare that black value to, or that metric again of where prices have been, is to this blue value that you see right up against the chart. For that value to be plotted and generated each and every trading day.=, VantagePoint is utilizing the technology of artificial intelligence, and specifically neural networks, to understand other markets. What it’s doing is called Intermarket analysis to understand how other markets are driving and affecting shares of Square. That can be ETF groups, which can be the S&P 500, dollar index, commodity markets, individual stocks, currencies.
It’s able to look at that information and understand the very subtle and important relationships that drive, in this case, the target markets specifically of Square. And then it takes that information, actually generates future data. You can think of that as candles here generated before any of this has occurred, and it builds that into the value of this moving average. Turning it into what was a lagging technical indicator into forward-looking predictive indicators. Whenever we see that blue line cross above the black line, it’s suggesting that average prices are expected to move higher than where they’ve been in the past, and you’d, therefore, want to look to take a long position.
Now in addition to that predicted moving average, this technology is also tuned to generate this indicator at the very bottom. And you see how we can go from green to a red. This indicator is generated each and every night. You see your most recent prediction here, but it’s only looking ahead 48 hours at a time. It’s very short term strength or weakness in the market. Not the overall trend, not the overall average prices, but just over the next 48-hour short term strength or weakness. To really round out the entirety of all of these forecasts, which really works exactly the same regardless of which market you’re trading, you’re also given a predicted high and predicted low. Actually those neural networks pointing out intraday for the very next trading day, so you can go ahead and set limit orders, set profit targets. You see the entirety of all this gives you the overall trend direction, short term strength or weakness in addition to those predicted highs and lows and all of these values again generated via that technology.
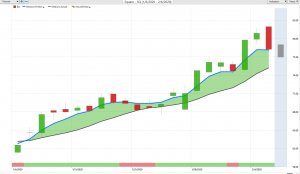
We see here in shares of Square, we see that blue line crossing above the black line. You’ll see these periods as we go through these subsequent charts of neural index will go down to a red configuration. What I like to understand there and say, okay, well you’re likely to see this predicted moving average or the market prices trade below that predicted moving average. It’s a good opportunity to even go ahead and look to buy at a cheaper level assuming you say, if I want to be long a asset anyway, where should I look to go ahead and take a particular position? You see market starts to move higher. You get these multiple predicted levels aren’t going to be hit every single day, but often doing a very good job of really adapting to that changing price action generating and updating those predictions and making sure that you’re on the overall right side of the market here.
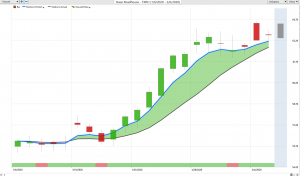
We see shares of Square sets, those crossovers came through. You’re getting about a 22% rally but also multiple opportunities in the shorter term and those intraday levels where you can be adding to that particular position, managing the trade as things move forward. Shares of Texas Roadhouse, so you see that we have again black line moving over the blue line here. You get those very short term periods where that neural index goes to a red. Next trading day, you’re trading below the overall prediction of the average. Same thing here, trading a little bit below that previous predicted moving average, but wanting to use those predicted intraday levels to say, if I’m looking to stake out a position here, where do I want to go ahead and get involved? To make sure that you’re not taking a huge amount of risk to get the same amount of MOOCs, you can really decrease that exposure that you’re taking to the market by getting better price levels, staying patient.
Texas Roadhouse (TXRH)
We see Texas Roadhouse here shares up almost 13% just in the past 15 trading days. Really just a few weeks on the calendar there.
Here in waste management, I just wanted to bring this back in cause we brought this over a couple of weeks ago. Not a huge moving stock as far as the intraday movements, but over the past couple of weeks you can again see how these predicted trading ranges can help you manage a position. Even a market that’s not necessarily moving a huge amount into today, you’ve got consistent levels to come in and be a buyer. You see overall that predicted moving average still moving to the upside a pretty nice move here. Even in a market, something like a utility almost, it doesn’t really move a whole lot.
Waste Management (WM)
You’ve got a 10% move higher in shares of waste management over the past 33 trading days.
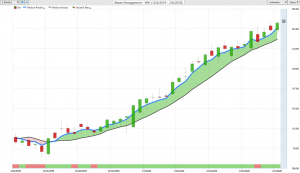
If you’re saying, how do I want to manage this? Over the past couple of weeks, able to take those accumulated six, seven, 8%, and deploy more capital, and make some more money As this market continues to march higher. You see a ton of separation between that blue line, to that prediction of average prices, and the black line, that measure of where they’ve been suggesting the market is still moving higher. One of the areas of weakness that we’ve had a certainly been in the energy space. We see here shares of Exxon Mobil, crossover to the downside neural index bearish. Here you see that it comes up to a green configuration there. You run sideways here for a few days, but very quickly moving back down to the red and saying, this is a downtrend. The last thing you’d want to be doing is being long here and you see shares going on the decline.
Intraday, where do you want to be taking those positions? If you want to go ahead and deploy capital a very clearly saying, go ahead and look to short at these predicted high levels and get involved with that move lower. You see still that blue line still well below the black line. You see a little bit of volatility moving around here as far as the daily range is increasing. A really nice opportunity to the downside here is we see shares down well over 10% here just in the past 19 trading days. If we go ahead and look at shares of HollyFrontier, so very similar situation where you say, this is where all these energy stocks start to turn lower. You understand that really the last place to be, whether it’s the commodity or a these stocks related to the commodity.
I want to go ahead and use those vantage point forecast to actually look to take short positions. You see how these values really adapt over time to say, the overall trend direction is down, but if you’re going to take a position, take it at these levels. You see how rather than taking positions intraday and getting an inferior price, wait until those levels get hit, wait until the market wants to move back to those levels, and you get a far better price as far as their trading style that early going ahead and trying to execute there. Nice opportunity to the downside here, great place to get short, in addition to having some of those long positions as well. Shares in many of these energy spaces down well over 10%, this market down 13% just in the past 24 trading days, 500 share position here, about $3500 on the short side there.
Skechers (SKX)
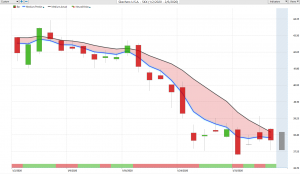
Lastly here, similarly to the energies, shoe companies. Whether it’s you know, Wolverine Worldwide, Steve Madden, here we got shares of Skechers all moving into a downtrend here. You see that blue line crossing below the black line, neural index bearish. A little bit more volatility here, you see that you get into a little bit more movement in the SOC as far as neural index gets bullish. You get that move higher, but the overall trend, you see that blue line or that predicted moving average still very much below the black line and saying, you may get these bounces higher in the market, but you want to remain short here. You see what ends up happening is the market goes into a big decline. You start getting gaps on the charts and really aggressive moves lower, and a really nice opportunity to stake out a short position and make some money on the downside.
Markets generally are staying pretty bullish. You see a lot of these tech stocks like Square, utilities doing extremely well. Some of these areas certainly areas of caution, you don’t want to go ahead and be long. Definitely, if anything, want to go ahead and take a short position or just not focus on these areas, right? If you want to get long, find some of these other areas in the market that are doing well, forecasted to be an uptrend, and really avoid some of these spaces that really show that there’s some trouble as far as prices advancing.
Shares of Skechers here down over 11% you’re just seeing big moves, whether it’s to the upside or the downside, tremendous opportunities. You want to make sure mostly that you’re on the right side of that market and really recognizing how the sectors are shifting and saying, energies, the shoe companies, some of this retail stuff stay out of the way. There are definitely those opportunities to go ahead, stake out along position, and make a lot of money as we see shares moving higher and higher day after day, for the most part. Have a great rest of the trading week. This has been our Hot Stocks Outlook for February 7th, 2020. Thank you all for watching, best of luck, and bye for now.