


Hot Stocks Outlook for the Week of
February 19th, 2021
The Hot Stocks Outlook uses VantagePoint’s market forecasts that are up to 87.4% accurate, demonstrating how traders can improve their timing and direction. In this week’s video, VantagePoint Software reviews forecasts for Viacom(VIAC), Activision(ATV), Western Digital(WDC) and Abbott (ABT)
Register for a Free Live Training
This Week’s Hot Stocks Outlook
Hello again, traders and welcome back to the Hot Stocks Outlook for February 19th, 2021. Hope you’re having an excellent week out in the financial markets, and there’s always plenty to cover in today’s outlook. So we’re going to start out with shares of Viacom. We’ve also got Activision here, Western Digital, and lastly Abbott.
Viacom(VIAC)
So starting out with here, ViacomCBS stock, what we have here really with all of these forecasts, work off of end of day data. So each one of these candles that you see right up against the chart represents a full and complete trading day, the open, close, high and low, and you’ll notice right up against all that price action, going back now to really the end of December, there’s actually a black line and a blue line right up against that data. The black line that you see on the chart that is actually a simple moving average. It’s a very common technical indicator. And what it does is it looks back over the previous price action. In this case, it’s a 10 day simple moving average, where you take the last 10 close prices, add those all together and divide by 10.
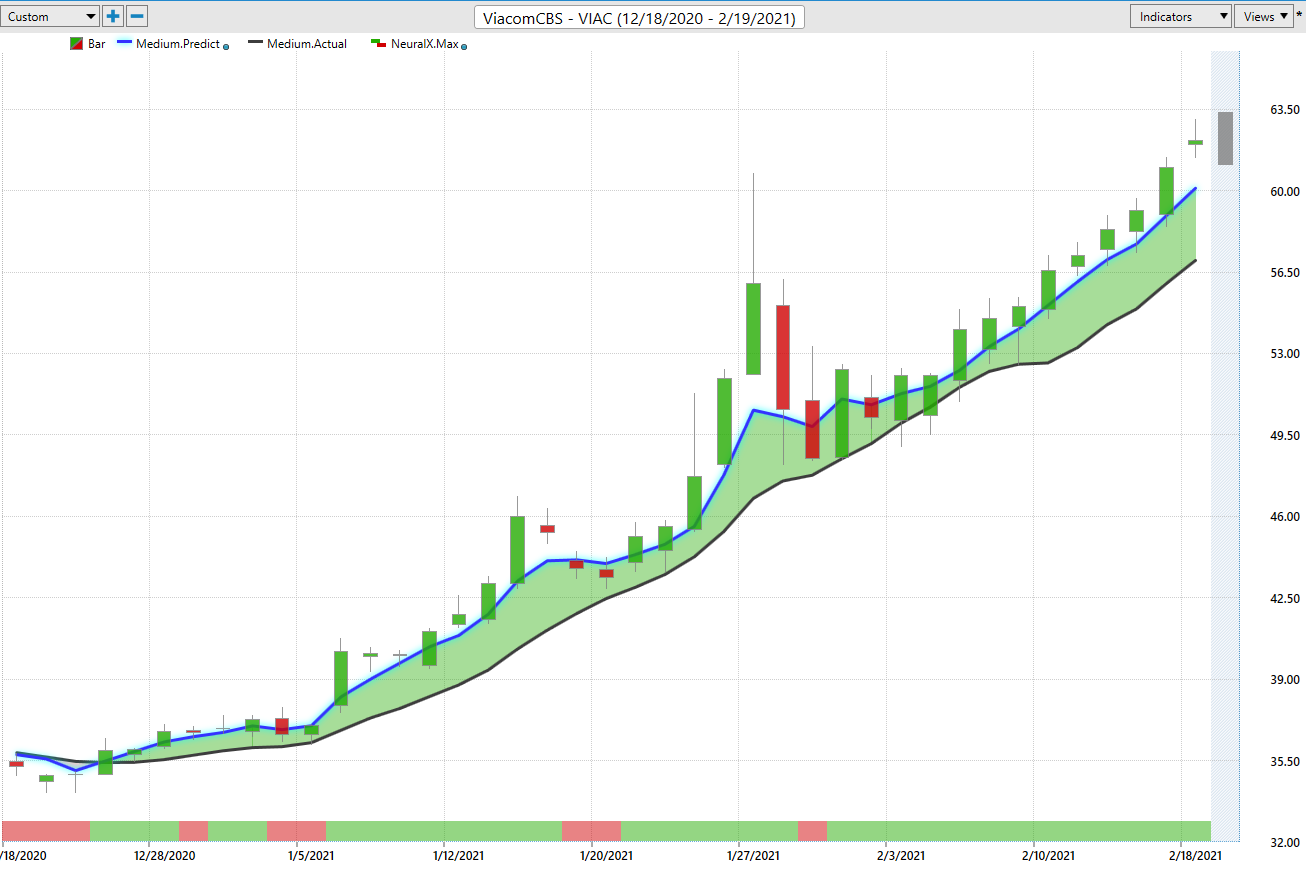
And that’s a really good measure of where market prices have already been, but obviously traders need to know where are prices headed going forward. And so what we’re able to do is actually compare that black line, or value on the chart of that simple moving average to this blue value that is generated via this technology within VantagePoint. So what’s going on to calculate that value is specifically for ViacomCBS, there’s what’s called intermarket, so known markets that are driving and affecting future price of this target market. Now, that’s going to be different for every single market that VantagePoint forecast for, but it’s going to include things like the S&P 500, things like the NASDAQ, the major stock indices. It can include ETF groups. It can include global currencies, or global interest rates, as well as even commodity markets like gold, or oil, or wheat.
And what it’s able to do is understand specifically to Viacom, what are those markets that share very important market relationships? Whether they be positive correlations, inverse correlations, leading, or lagging relationships. And that’s really the benefit of artificial neural networks, specifically this technology that’s doing this analysis. And so what’s happening with that information is it’s actually utilizing it to generate true price predictions. So things that haven’t yet occurred in the market, and it’s actually taking those predictions and using that to construct this movie average, turning what was a lagging indicator that just summarizes where price has been, into a forward-looking predictive tool. So we refer to as this is the predicted moving average.
In addition, there’s a couple of other indicators that are also utilizing that predictive technology. If we go to the very bottom of the chart, you’ll notice that there’s a bar here and it’ll update every single trading day and either be green, or red. So it has a yes, no, binary sort of output. And what it’s doing is actually calibrated to look ahead 48 hours. So every time there’s a forecast or prediction there, it’s actually looking ahead over the next 48 hours of training and forecasting short-term strength, or weakness in the market.
Now, lastly, if you look at the very right hand of the chart, you’ll notice that there is a shadow candle here. And what that is, is these neural networks actually picking out intraday price levels, whether they be predicted high, or predicted low, to help you with your limit orders, profit targets, and any short-term trading that you might do in that intraday timeframe. So whenever we have that blue line crossing above the black line, and we actually have some scans that we’re able to identify right when that occurs in a huge selection of markets. So you can identify trend reversals early.
And that’s really the benefit of having this predictive tool, because if you oftentimes get in the market late, it makes a huge difference as far as your overall risk/reward and how much money you’re able to make in that particular opportunity. But once that blue line crosses above the black line, you want to be essentially long the market, it’s suggesting average prices are expecting to move higher. And you see here, Viacom shares up, just in the past 36 trading days, you got a 70% rally in the stock, just 500 shares there has you up for $12,500. Now, in addition to that really know exciting move over the course of the past couple of months, you also have those predicted highs and lows.
So when you get into the market at the right time, and then have the ability to add to that position with profits, you’re actually able to make a lot more than that 70% or that $12,000 over that time period. And you see here that as the market moves forward, you’re getting that consistently updated forecast. Now, the Neural Index, it will go bearish from time and you often see price move below the predicted moving average, at least for a short period of time. But the overall trend, as long as that blue line remains above the black line is to the upside.
So you see here about a dozen entries over this 36 trading day move, where that market moves up about 70% over that time. Now, why is this important to recognize as soon as crossovers occur? Well, oftentimes you get the market moving very, very quickly once those crossovers come through.
Activision(ATV)
So here you have Activision shares and you see if you’re a day late, you really missed the entire move, but here you see that blue line crossing above the black line and saying Activision as a place to look for prices to move higher. You also see that Neural Index is very bullish over this time period and signaling that, look, this is the trading day where you potentially want to come in and look to get involved in this position. You see, you get very close to that predicted low. You really tap that predicted low, probably a low amount of volume, actually taking place at the lower price, as you see here at about 92.61. And then almost immediately the market moves to the predicted high, closes for the day towards that predicted low, and then it’s gapping up and making a really nice move higher.
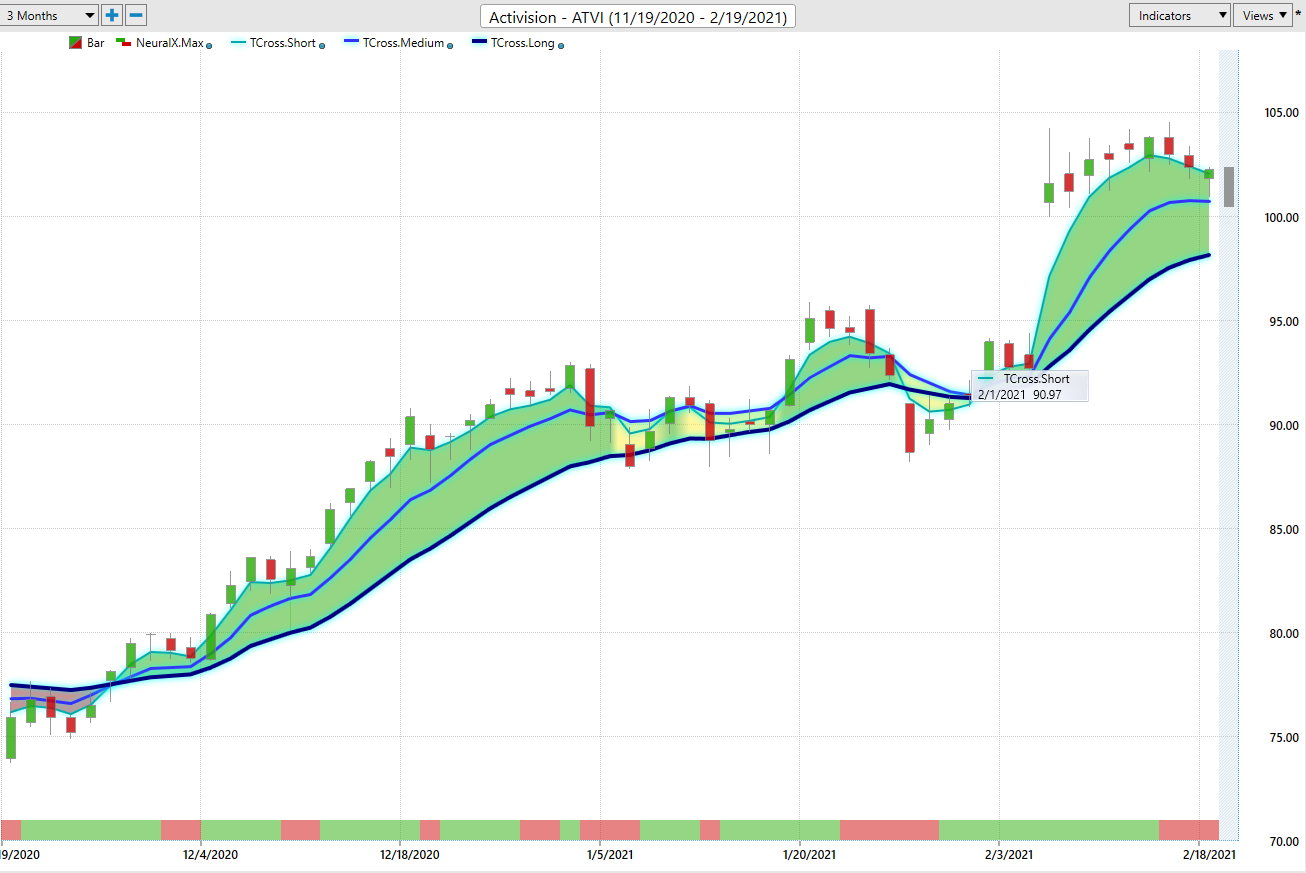
Now, if we look a little bit more closely, you’ll see a couple more entries here as the market taps against those predicted high and low levels. And you see more recently that you’re finally seeing the Neural Index say, “Look for some weakened prices over these next couple of trading days.” We’ve caught a nice up move here. As far as the overall percentage of that move. I think you’re up about 10 or 12% over the day, but you can see here how utilizing each of these indicators here, knowing now’s the time to go ahead and get involved in this next trading day. Look at the overall projections. You’ve got strength over the next 48 hour period, and then look towards those predicted highs and lows to get a really good entry intraday, and benefit as this market moves higher. And you see that pretty much forecasting strength along all of these days until very recently, now saying, look for that, short-term weakness, at least over the next 48 hours.
Western Digital(WDC)
Here’s, shares of Western Digital. Sometimes you’re going to have a lot more volatility in the market, but as a trend trader, you want to recognize that reversal, and as long as that blue line remains above the black line, the overall trend is still up. So you see, once again, you get that crossover to the upside, market dips a little bit lower, but you see from that end of day basis, the overall trend is very much still to the upside. So you get in on that move lower and subsequently the market moves up over about 18 trading days, about 30%. And you’ll notice that once the market gets running, you get multiple levels here that are going to act as a very good guide of where to potentially get involved in the markets. So you get this big uplift here, market settles down.
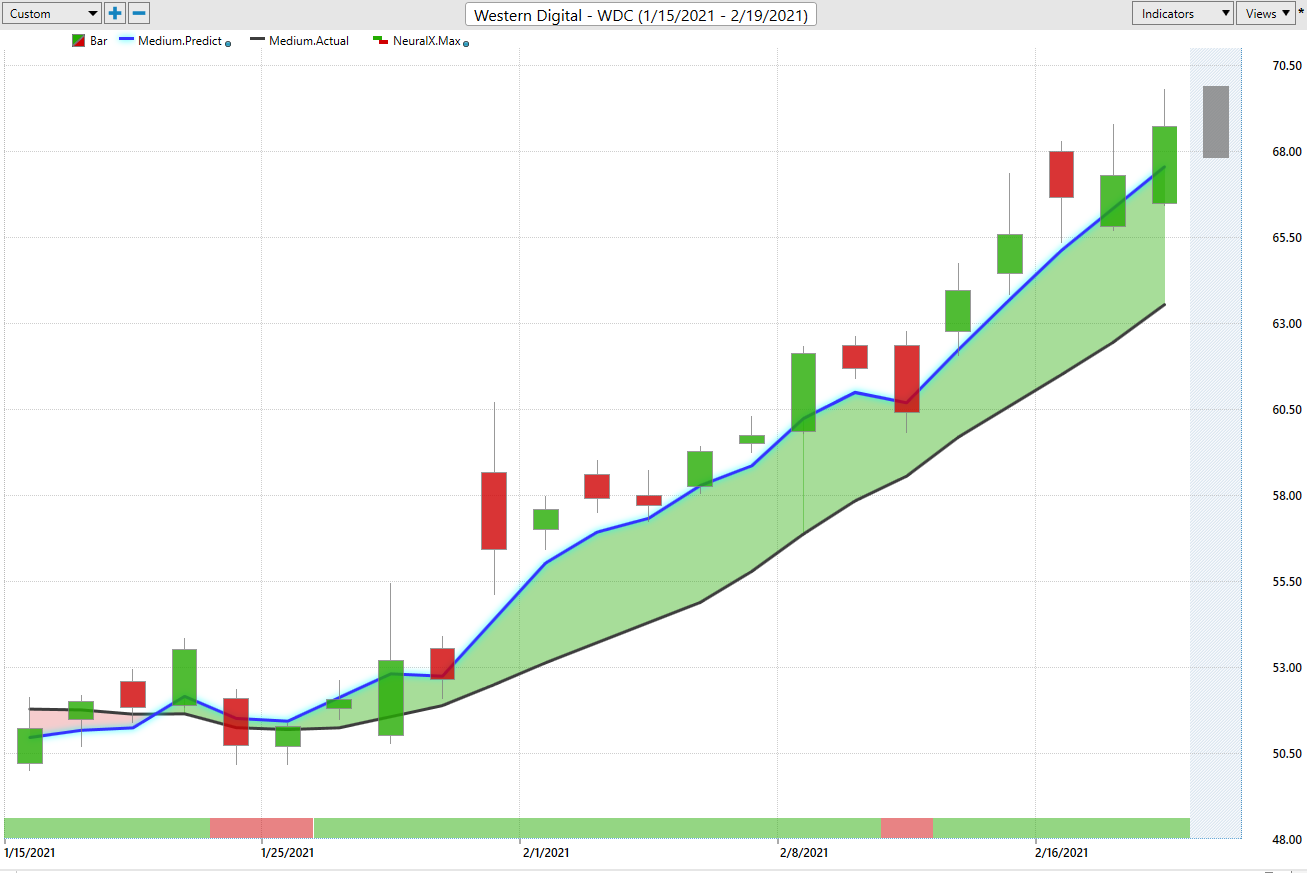
Well, you want to be getting in again at the lower part of the range there, before the next leg high. It settled down once again. And then again, seeing that market proceeded to the upside. So about a 30% rally, 500 shares here, as you have about 78, almost $8,000 in just the past 18 trading days. That’s literally less than a month on the calendar here.
Abbott (ABT)
And lastly here shares of Abbott, a much longer trend, but of course you want to recognize when a trend is working, and when you should hold on to that position. You see that things went sideways and up here for a while, but you want that blue line and black line to indicate, “Look, the trend is still up.” The worst thing that you could do is get out of this market early, before this tremendous rally as prices and the overall range really starts to expand. So again, we can say, “Okay, well, from this point all the way back in mid-December, where do we want to be looking to get involved in the market?”
And you’ll see every once in a while, these days where you do come outside of the range, but where the software’s really has a huge advantage as in its ability to process that information, see where things closed, look at those intermarket relationships, and then forecast future price out. And you see how quickly things adapt as far as the overall volatility and also acting as a good measure that says, “Okay, well, you’re still trading this market. Where do you actually want to get involved as far as prices are concerned?” So you see a lot of the sideways action, getting in again at the lower part of that range, a lot of areas where you could take profit up at the predicted highs. But again, as long as that blue line is remaining above the black line, you want to make sure that you catch the bigger part of that move, and we see shares taking it really nice rally here.
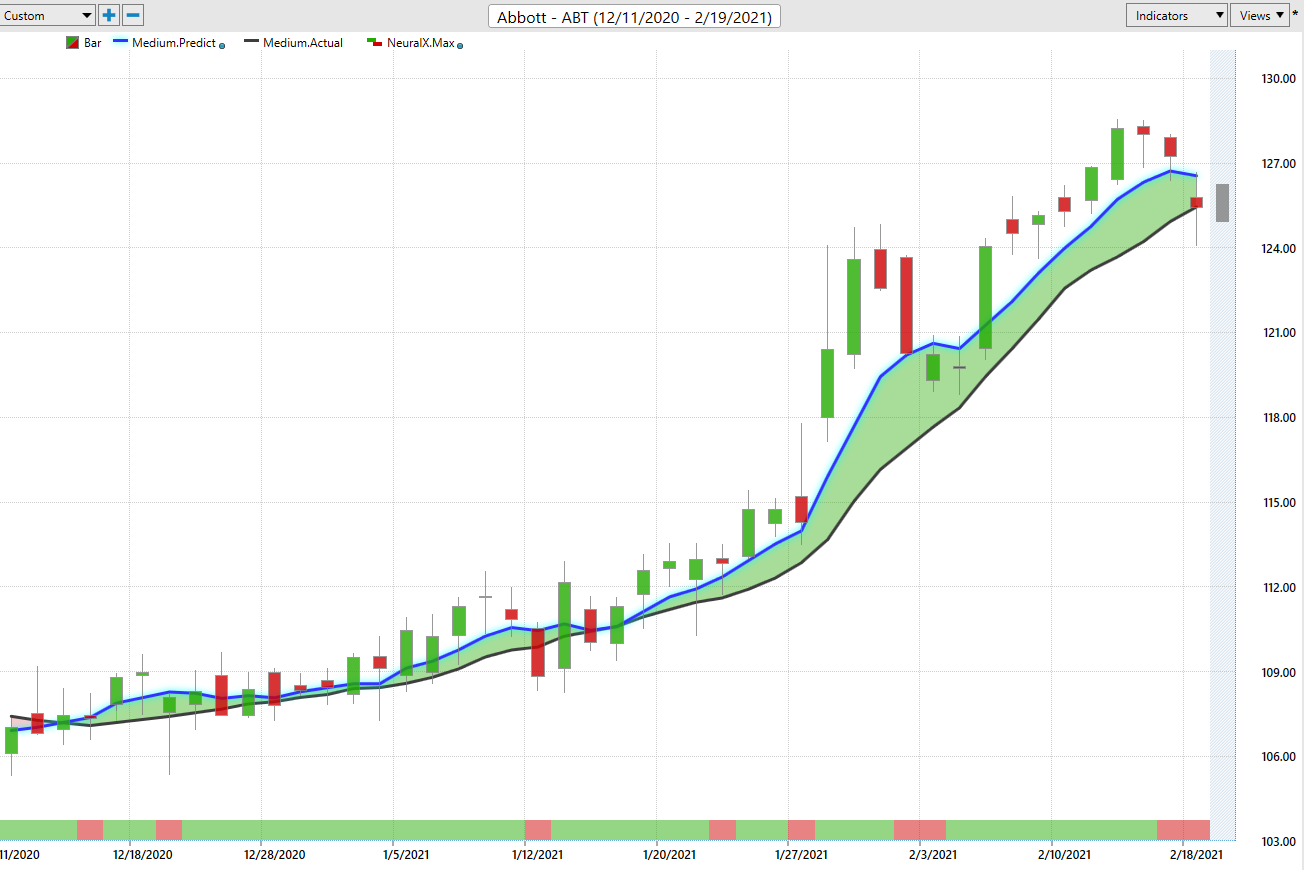
Let’s take a look about 18% here in just the past 42 trading days. So again, you see how many opportunities over this period, where those predicted highs and lows are doing a really great job, letting you know, “Hey, intraday, you’re at the predicted high, maybe take some profit, look for things to retrace over the next couple of trading days and buy back in at a lower price level.”
Now, what’s really helpful about the VantagePoint tools here is we have this tool that’s able to scan for new opportunities. And so I’ve included all the individual stocks. It’s literally hundreds of stocks that VantagePoint forecasts for. But what this allows you to do is oftentimes look for new opportunities. So if you’re looking for a fresh direction change in the market, you can set these crossovers to look for a fresh crossover of that predicted moving average. You could go the upside downside. You can make sure that the Neural Index is also in the right direction, as well as these other predictive indicators that specifically to your trading style and timeframe, you may want to include in that overall scan.
And you have the ability to scan all these things by what sector, or category, or group of markets that they’re in. You can sort alphabetically if you want, but the point is to help you identify some of those new trading opportunities. So you can open up a new chart, identify where there’s some fresh crossovers going on. And then combine your trading style and your approach and say, “Okay, well, what is the timeframe that I’m looking at? What are the VantagePoint forecasts as far as the indicators forecasting for the next trading day? And what should be my game plan going in and participating in that market?”
So once again, this has been our Hot Stocks Outlook for February 19th, 2021. Thank you all for watching. Best of luck out there in the markets. Thanks again, and bye for now.


