


Hot Stocks Outlook for the Week of
January 1st, 2021
The Hot Stocks Outlook uses VantagePoint’s market forecasts that are up to 87.4% accurate, demonstrating how traders can improve their timing and direction. In this week’s video, VantagePoint Software reviews forecasts for Cameco(CCJ), Cleveland Cliffs(CLF), Dennison Mines(DNN), Goldman-Sachs(GS) and Verizon (VZ)
Register for a Free Live Training
This Week’s Hot Stocks Outlook
Hello again, traders, and welcome back to the Hot Stocks Outlook for January 1st, 2021. Hope you’re all having a excellent week out in the markets and getting ready for a new year of trading here. We’re going to start out today with a few basic material stocks. We’ve got Cameco, Cleveland-Cliffs, Denison Mines, and then we’ll move over to Goldman Sachs, which we looked at at the beginning of December, and lastly, Verizon here. And really a good group of markets to really understand what’s going on in these different areas of the broader markets.
Cameco(CCJ)
Now, starting out here with Cameco, this is a good example of really how any forecast is utilized with the VantagePoint software. This can be futures markets, currency pairs, or individual stocks, and so what we have here is daily price action. Each one of those candles represents a full trading day, and right up against that price data, you’ll see that there is a black line and a blue line. And so it’s important to understand as well that all of these indicators work off of that end-of-day data and are forecasting out for the next trading day.
When we have that daily price action right up against the chart, you’ll notice that black line and also that blue line and what the black line is is actually a simple moving average, and that’s a very common technical indicator. But what simple moving averages do is really just look back over the previous 10 closes in this case, add all those values together, and then divide by 10, and it acts as a really good tool to smooth out the price action, and it lets us know where average prices have been over a given period of time. But obviously, as traders, we need to understand where are prices going next and moving forward into the future?
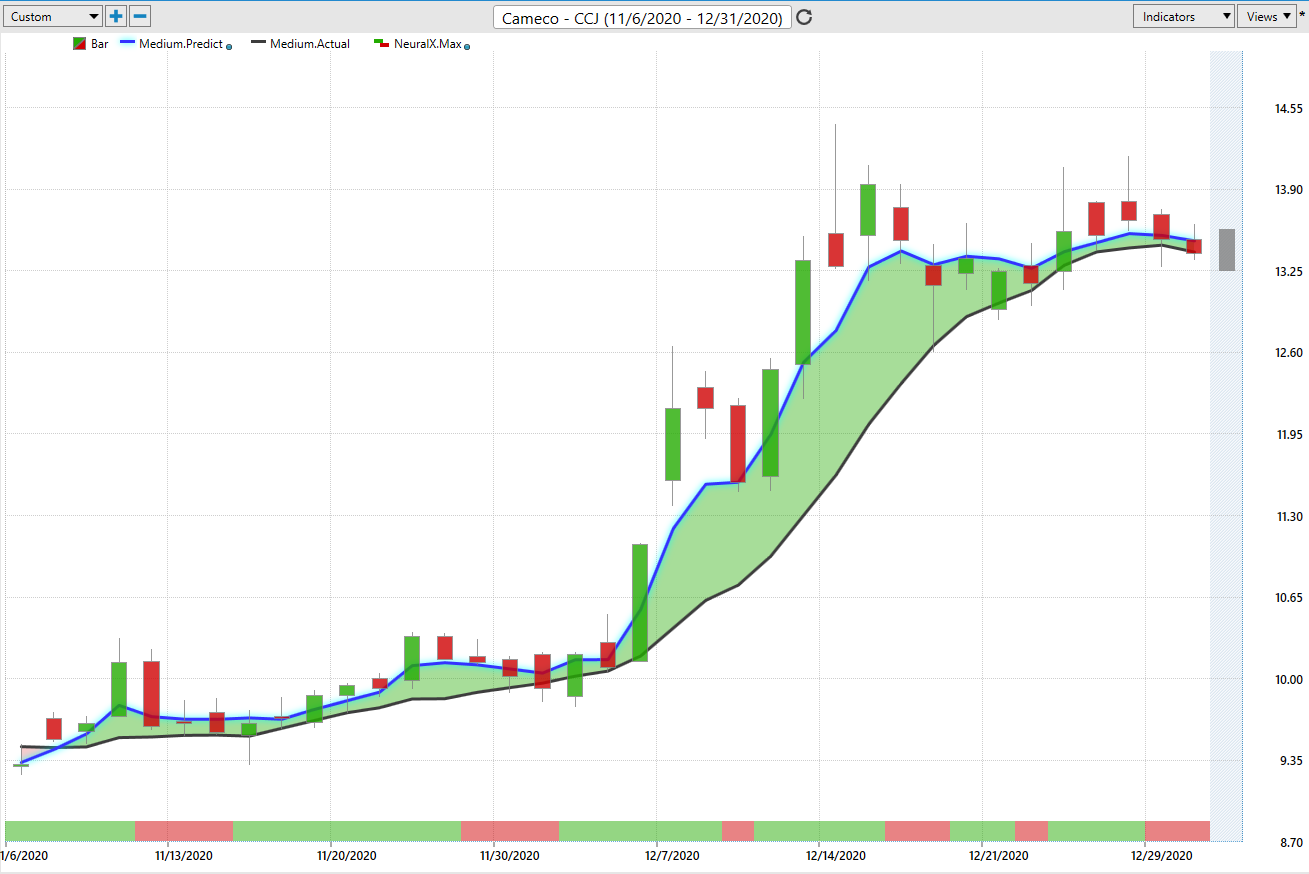
And so what we’re able to do is actually compare that black value or that simple moving average to this blue line on the chart, and to generate that value, that calculation, every single evening, VantagePoint is performing what’s called Intermarket analysis, and it’s utilizing the technology of artificial neural networks to do that. Now, what that means is when looking for the future prices of Cameco, VantagePoint is understanding other markets that are known to drive and influence this, in this case, the target market. Now, that can be things like the broader stock indices, like the S&P 500. That can be things like ETFs that model sectors or groups of stocks in the marketplace. That can also be just individual stocks that are in the same sector or other sectors where you wouldn’t see an obvious relationship, but that’s what the software is able to detect.
You’ve also got things like global currencies and global interest rates, and it takes all of those markets, which are usually up to about 30, 35 intermarkets, and actually understands those relationships, so where there’s positive relationships, where there’s inverse correlations, where there’s leading or lagging relationships, and it actually generates future price predictions. You can think of that as true candles that haven’t yet occurred yet. It’s generating a prediction, and it actually takes those values and builds it into the value of these predictive indicators. In this case, the predicted moving average.
What happens is it turns a lagging indicator that is just really summarizing where market prices have been and gets dragged around by the most recent price action, and it turns this into a actual predictive tool. So whenever that blue line crosses above the black line, it’s letting you know average prices are expected to move higher, and therefore, the overall trend, you can think of it as, in this case, to the upside. Now, to really round out the entirety of these forecasts, you’ll also notice that there is a indicator at the bottom of the chart here, and this bar, again, after each and every trading day is going to have a green or red configuration.
And what that indicator is predicting with a very high level of accuracy, up to 87, 88% in some cases … Essentially, over four out of five times, it’s correct. It’s forecasting short-term strength or weakness over the next 48 hours. And so neural networks and artificial intelligence, you’ve got to train them to do something. And in this case, this indicator is really attuned to look for that short-term, 48-hour strength or weakness in the marketplace, and we can pair that with the predicted moving averages that we have here right up against the price data. So once that blue line crosses above the black line, the overall trend is up, but when that neural index goes bearish, you can expect weakness over the subsequent 48-hour periods.
Now, lastly, we also have neural networks working on the next day, intraday predicted high and low, so these are trained to just look out for the next trading day, these essentially the high and the low of the day, you see you have a shadow candle there. And what will happen is the actual price will fill in, and we’ll see how accurate those predictions are. But what we can do is take a look at how accurate all of these predictions have been going back to now, really the beginning of November, so you’re looking at about 40 plus trading days or so. And you see you get this guide that if you understand, okay, well, I want to be long in this market … Where should I be looking to accept price levels to get an entry into the market? Well, you can buy down at the predicted low or really in the bottom half of the range and be targeting obviously the upside, that predicted high. Or just stay involved as long as that blue line remains above the black line, you’re in an uptrend.
And you see, even as volatility really comes into the market, the software does an excellent job of adapting those levels. You see here where you come a little bit outside the range, that predicted range, saying, okay, we’ll expect us to move potentially a little bit lower, but the overall trend’s still up. When things start to move lower here, you see that prediction gets much weaker, letting you look for these cheaper prices over the next trading day. And you see this often, where you come outside of the range a little bit, but look at the market closing coming all the way back to that level and then continuing on here again.
Actually on days like this are phenomenal where you actually get picked up at the open and then that uptrend continues, and as long as that blue line remains above the black line, the overall trend is to the upside. We see here in the case of Cameco here, we’ve got a rally of 41% in just the past 35 trading days, a very cheap stock here where, if you bought 500 shares, you’ve got about a $2,000 profit just over the past couple months. And what we’ve seen throughout the markets is stocks really turned up in November, really at the beginning of November, and that’s where the Intelliscan is helpful. We have these tools to identify these fresh crossovers, and you can see, okay, well, when a wide swath of the market is showing fresh bullish crossovers to the upside, you can see what sectors look strong, where those trends are starting to reverse, and stake out your position, but also have the tools to manage that position effectively. And as long as that blue line remains above the black line, you know that trend is still up.
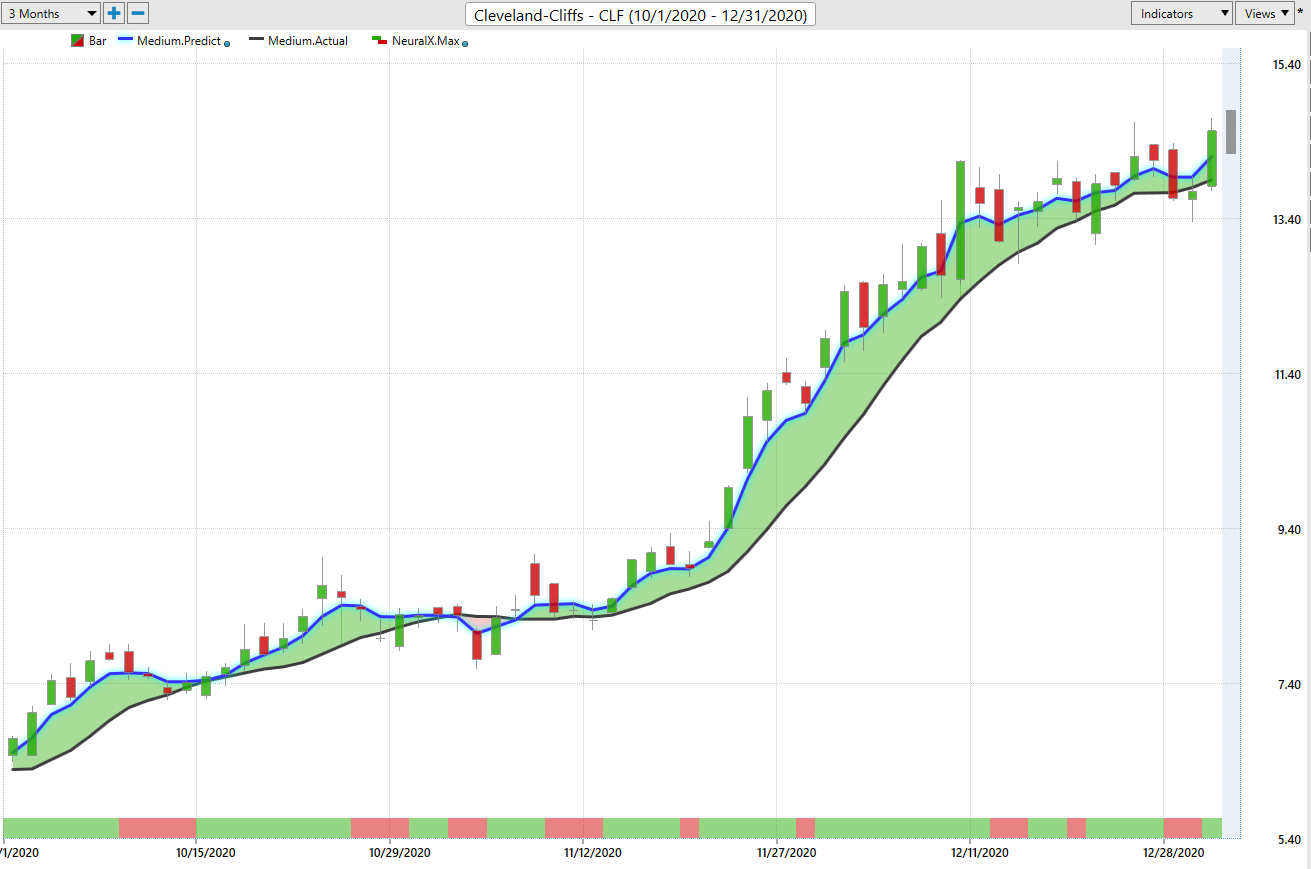
Cleveland Cliffs(CLF)
Now, these are very similar markets we have over these next two opportunities here in Cleveland-Cliffs and Denison Mines. You see often here, or additionally here, at the beginning of November, crossover moving to the upside. You get these, again, these price dips when that neural index goes bearish. That blue line is still above the black line. It’s letting you know the overall trend is still to the upside, and you want to remain long. Now, we can again look at those predicted highs and lows, and the thing is is we’re not just looking at one or two days of predictions of higher lows here. This is going back now, again, 40 plus candles on the chart, and you can see how consistently accurate these levels are. So where you understand, okay, well, here’s the market that I want to be trading, whether it’s, in this case, Cleveland-Cliffs, whether it’s Apple shares, whether it’s soybean futures, it really works the same way.
You have a really adaptive tool that uses the artificial intelligence to look at those intermarket relationships, understand what’s happened in the target market, as well as those intermarkets, and then adapt and generate new forecasts for what’s currently going on in the marketplace. Again, multiple entries there in Cleveland-Cliffs, probably about over half a dozen entries. Overall, though, these markets moving up about 74% in 35 days. Again, situation where 500 shares, you’ve got about $3,000 profit, and that is not a huge position. It’s a very small position. That’s more than 75%, almost doubling as far as price. And we see that still in an uptrend here.
Here, Denison Mines, a little bit later, this coming through towards the tail end of November. But really, the same thing. It’s utilizing the forecast, understanding where there’s strength in the marketplace, and saying, okay, well, you only want to be long here. Buy down at those predicted lows. You see the neural index will help you as far as those retracements and pullbacks in the market. But as soon as that neural index gets bullish again, you see that trend resuming that sideways action stopping and things starting to move higher once again. Now, this is a very cheap stock that doesn’t have a whole lot of volume really running through it. But that’s the point is you’ve got this accurate guide that understands, okay, well, this is the market. This thing’s trading down at 35 cents, and that’s why it’s very important to have a very accurate price forecast because when you understand where you can be accepting prices, you don’t have to run a huge stop-loss. You don’t have to take an exceptional amount of risk, but can still tremendously benefit as shares start to move in the appropriate direction.
Dennison Mines(DNN)
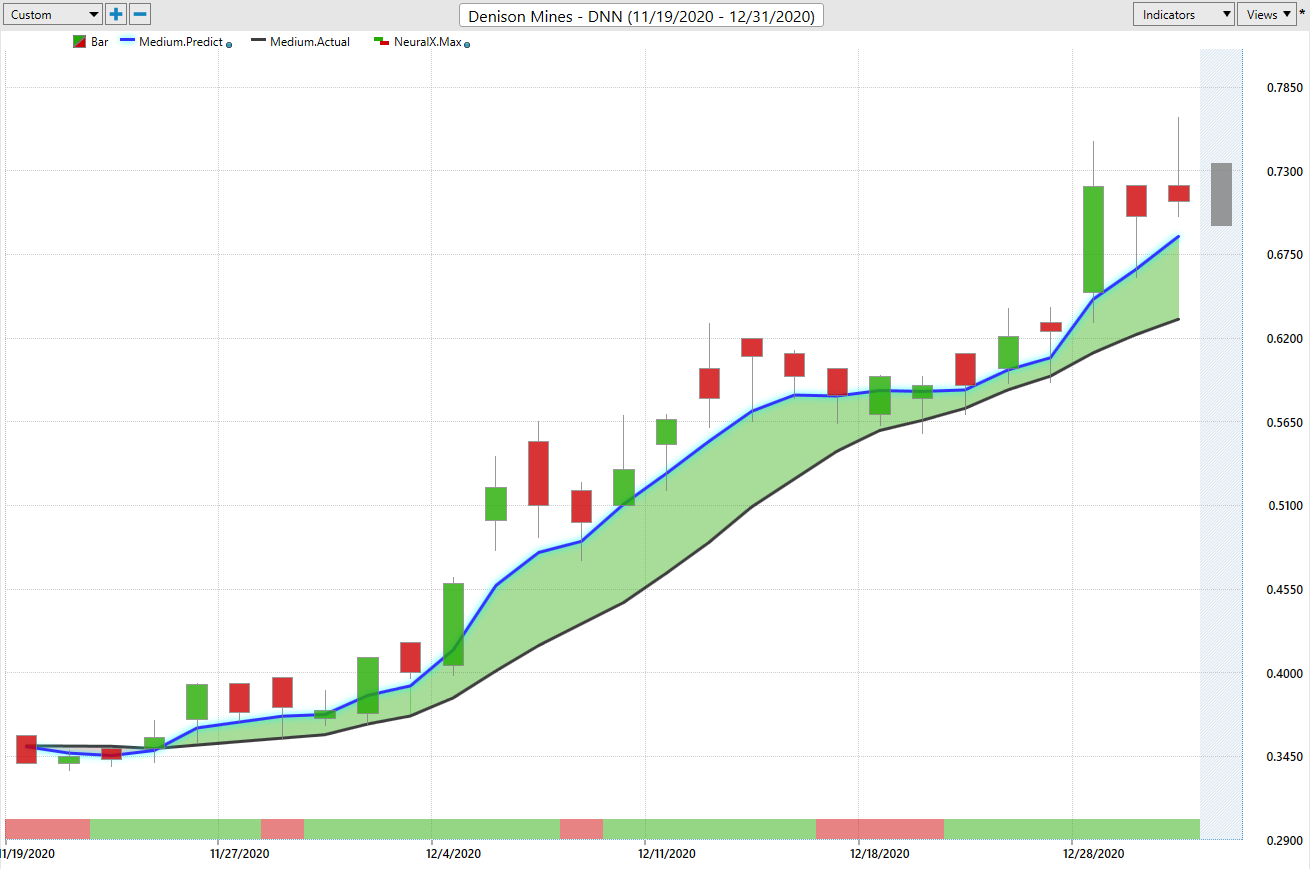
Here in Denison Mines, here, we’ve got a really nice move on a very cheap stock. Again, 91% rally in just the past 23 trading days. But you see there are about five or six entries, actually, probably more than that when you take a look at this one, two, three, four … Pretty close there. Five, six, seven, eight, nine, 10, 11, so 11 out of 20 plus days there, you’re getting excellent entries there at the lower part of the range to participate in that 91% rally. And again, a situation there where obviously you can buy several thousand shares of a stock like this and profit accordingly in that situation.
Goldman-Sachs(GS)
Now, what’s been interesting about the markets is that, again, we had this period in November, you see Goldman Sachs here. We looked at this actually in December when we first brought this through in the Hot Stocks Outlook, and subsequently, we can take a look at those continued forecasts, but we’ve seen some markets really at this point here in December start to turn lower. And that’s what you want to understand is, is the market that I’m trading still in a bullish up move? Well, as long as that blue line remains above the black line, you can keep trading that market, keep buying at predicted lows, and you see here again where this volatility kicks into the market.
You’re going to have some days like that from time to time, but look how accurately the software then adapts and says, okay, well, let’s take that into account. Let’s look at those intermarket relationships and now forecast out with the help of those short-term predictive tools from the neural index and also those predicted high and low values to get you back on track and understanding what is going on here, what should you be doing? Since December there, you see it getting plenty more opportunities. You had about a 29, really 30% rally here in the past 38 trading days. Obviously, a more expensive stock here with 500 shares having you up about $30,000 there. Obviously going five futures or option contracts will give you a similar position there.
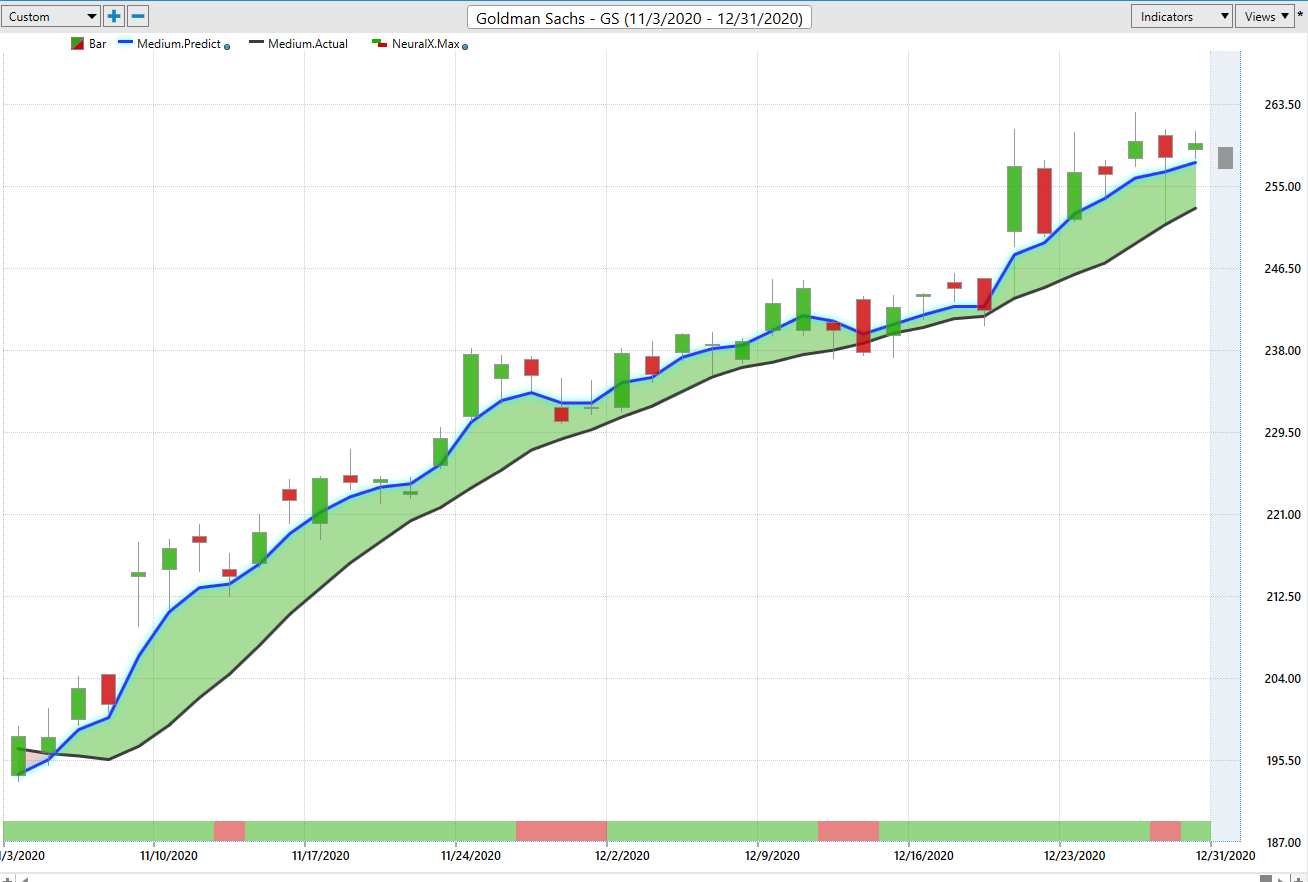
But the point being, since December where those stocks started to turn lower, well, that’s not happening here. You’ve got opportunities that say, look, you want to continue to be a buyer down at those predicted lows and benefit as that market moves higher, along with the broader S&P 500. Here are those shares of Verizon, and again, it’s that period right about 12, eight, December 10th or so you start to see some of these markets turn lower. And what you want to understand is where should I go ahead and take those profits, get out of the way, or potentially look to hedge the portfolio and go short?
In a situation like this, you say, okay, well, maybe you’re long Goldman Sachs, maybe you’re long, some of these basic material companies, but it really makes sense to short something like Verizon, or maybe buy some put options for that protection. And you see about four entries as far as getting the predicted high there, but a overall decline here since that midpoint in December came through.
Verizon (VZ)
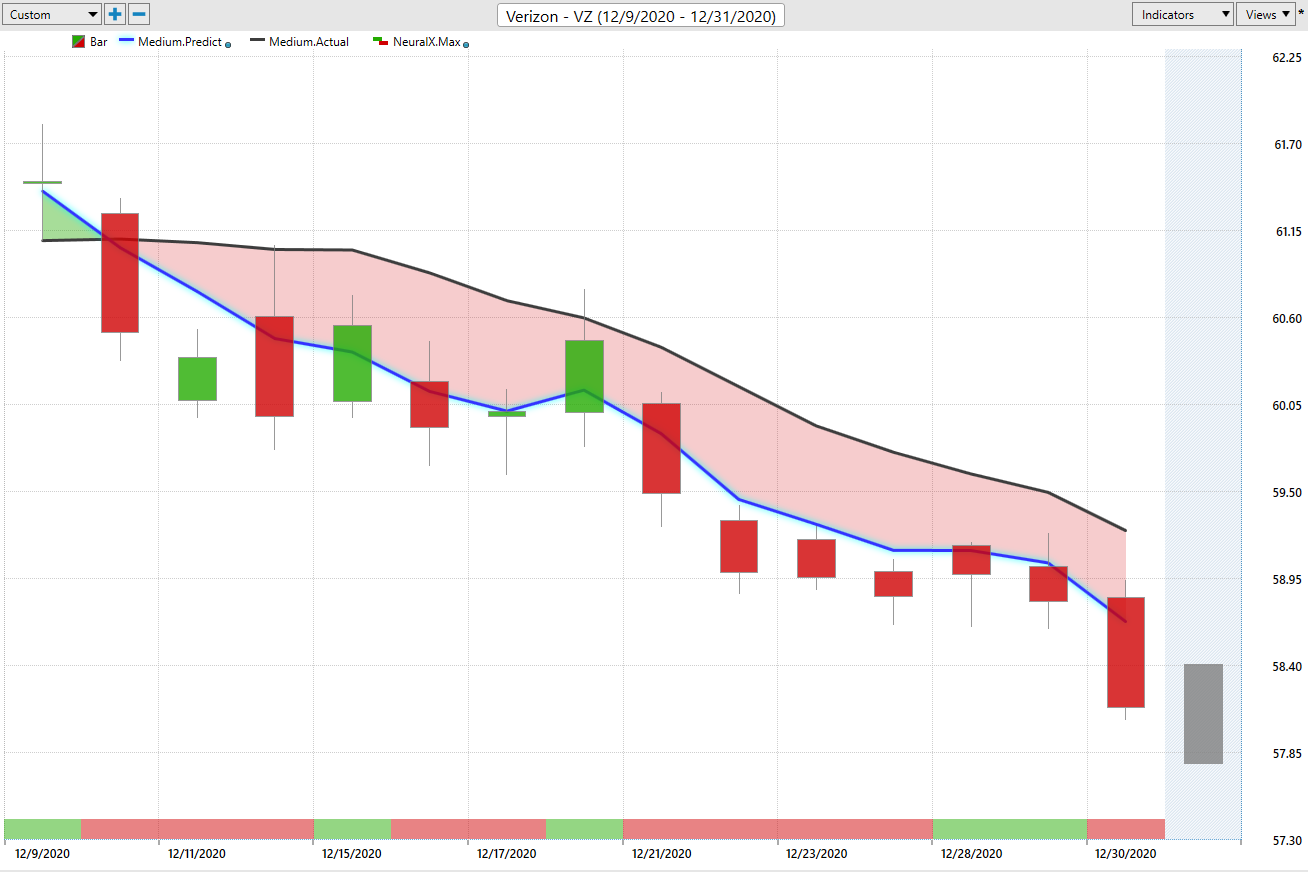
We can see here, Verizon’s not a huge mover here. You’re only off about 4%, but you’ve seen that similar theme throughout the market of this turning point that happened in a lot of these bigger stocks, things like MetLife, American Express. These things turned lower and weren’t really a good place to be over the past few weeks in the market.
I’ll go ahead and leave it there, this being our first Hot Stocks Outlook for the new year being January 1st, 2021. Thank you all for watching. Best of luck out there in the markets, and bye for now.