


Hot Stocks Outlook for the Week of January 17, 2020
The Hot Stocks Outlook uses VantagePoint’s market forecasts that are up to 87.4% accurate, demonstrating how traders can improve their timing and direction. In this week’s video, VantagePoint Software reviews forecasts for Apple (AAPL), Autodesk (ADSK), Shopify (SHOP), AMD (AMD), and Salesforce.com (CRM).
Register for a Free Live Training!
This Week’s Hot Stocks Outlook
Hello, again traders and welcome back to the Hot Stocks Outlook for January 17th, 2019. I hope you all are having an excellent week out there in the financial markets and this week a heavy tech episode here in the Hot Stocks Outlook. So we’re going to start here with shares of Apple, we’ve got Shopify, Autodesk, AMD and lastly Salesforce here. Things like Autodesk, we brought an actual couple of months ago. Some of these trends performing extremely well in the marketplace.
Apple (AAPL)
So starting here with Apple, what we have here are daily bars and candles. So every single one of these candles represents a full and complete trading day. And you’ll recognize really a few indicators. We’ve got what’s called our predicted moving averages right up against the price data there. At the very bottom, we have what’s called the predicted neural index and lastly a predicted high and low range. Those are really the core of vantage points predictive forecast.
And how these predicted moving averages work, as you see right up against that priced data, there is a black line and also a blue line. Now, the black line that you see there, that is actually a regular or simple moving average. So a very common technical indicator takes the past closed prices, adds them all together, divides by a particular number and just moves that average along. And not really predictive at all, just gives you a good measure of where market prices have been over a given period of time. And obviously, as traders, we would need to understand, okay, well where are prices going moving forward? How can we get again ahead of the opportunity?
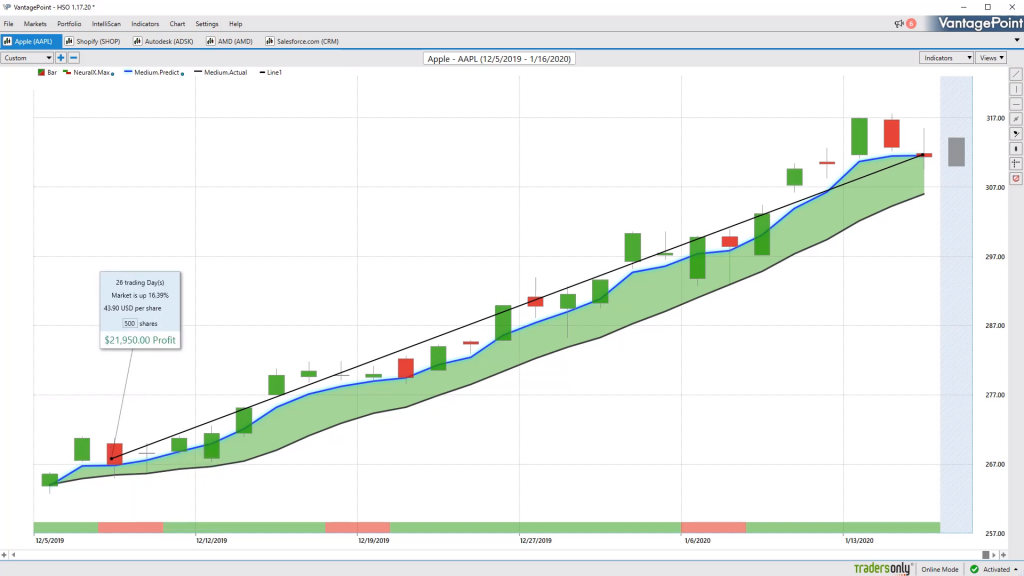
So what this software is able to do is, in the case of shares of Apple, it’s actually utilizing what’s called neural networks, which are a type of artificial intelligence to perform what’s called Intermarket analysis. And what that means is, instead of just looking at shares of Apple, like this black line or a regular moving average would do or most regular technical indicators would do, it’s looking at things like the S&P 500 the NASDAQ, major stock indices. It’s looking at major ETFs, it’s looking at individual stocks, currencies. And what it’s able to do is, understand these relationships between markets and how other markets are influencing and driving the future price of Apple moving forward. Now, what it does with the collection of all that data is actually generate future prices. You can imagine that as like a couple of candles in the future that haven’t occurred yet, and it builds that into these indicators, turning what was a regular lagging moving average, into a forward-looking predictive tool.
And so whenever that blue line, in this case, crosses above the black line, it’s anticipating that average prices are going to start moving higher than where the market has been, and therefore it would justify taking a long position in the market. Now, in addition to that predicted moving average, this predicted neural index at the very bottom of your screen, also utilizing that inner market data but really geared to only look ahead 48 hours at a time. So very short term strength or weakness in the marketplace. And lastly, you actually have more of these neural networks, again, geared to look specifically for intraday predicted high and predicted low values. So what you get is, you see a shadow candle here and actually we have all the predictions of all of these trading days, going back over the course of this trend and we can see how this works in entirety here. So if we say, okay, well we want to go ahead and get long Apple, you this red line and the black Line are actually the predicted high and predicted low for each one of these trading days. And you can see if you’re committed to the bullish side of the market, you’re getting excellent Intraday entries in a uptrending market and on these days where you move a little bit outside the range, then immediately move higher, actually getting even getting filled at the open, assuming you have limit orders waiting at those points.
But you see really nice opportunity in the shares of Apple. This is really a huge benefit is not only on the individual market that you want to trade, but seeing in aggregate how trends all across particular sectors and areas of the market start to move higher altogether. We actually have a scanning feature that really makes that very apparent as all of these crossovers and new opportunities begin generally at the same time. You see shares of Apple up over 16% just in the past 26 trading days. If you had five options contracts, about 500 shares, you’re looking at a $2,200 move just in the past 26 trading days. So not a huge amount of time, but seeing these markets really move dramatically higher.
Shopify (SHOP)
Now, Shopify, we’ve brought in really a couple of times over the past few months here. And you see going all the way back to mid-November, getting that crossover to the upside. As long as that blue line remains above the black line, the trend is still bullish. And you’ll see that there will be periods along the way where you see that neural index will go to a red configuration. But what we want to understand there is, that’s only looking ahead 48 hours ahead. And you see that you get some subsequent weakness, some sideways action, some movement below the average, which makes perfect sense that you should trade above and below an average. But when you can anticipate that weakness, not only are you ahead of the game but understand when is a good time to add to your position at better prices.
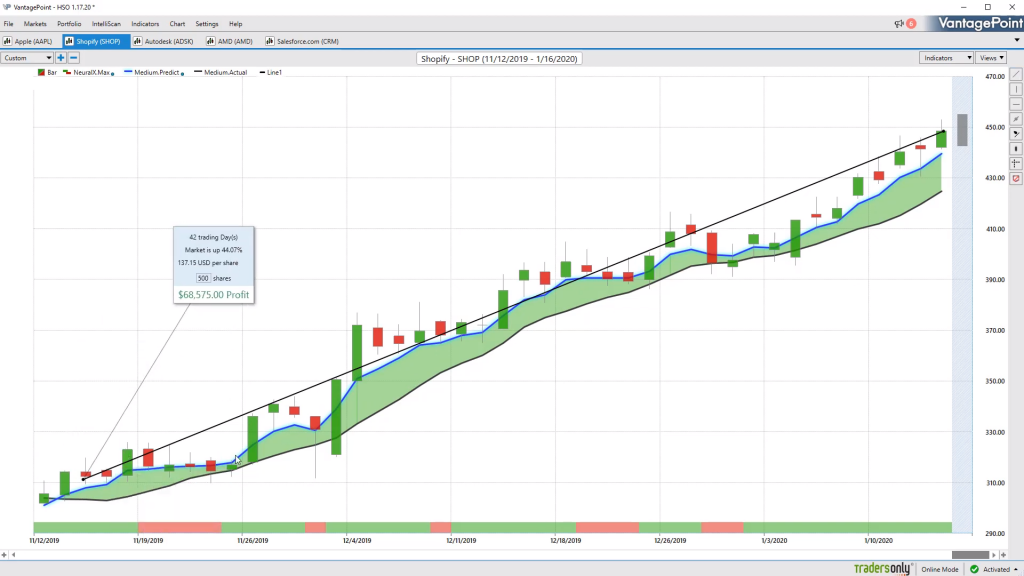
So again, we take a look at this overall, the course of the trend, and it’s not just about getting into the market here, but how you manage that opportunity along the way. And you see how these predicted levels are coming in each and every day and really act as a good intraday level to say, look, if you’re a day trader, short-term trader, if you’re a trend trader looking to add your position, you’re getting excellent levels along the way where you don’t have to run a huge amount of risk to really increase that position. So you see just over the past month, you’re getting a lot of orders in here at about 400, well, we’re already above 440, on more recently here where you immediately move up, start hitting the predicted high. So able to go ahead and take profits along the way, but increase that overall position size. And you see a lot of these entries along the way at really critical intraday levels, and over the course of this move and now seeing markets dramatically start to move higher once again.
These are great places where you’re making a lot of money, not just from the past couple of months, recognize this trend, but understanding, look, the trend is still up. Keep participating. Maybe even use some of those profits to buy in at these predicted low levels. This market’s up 44% in just the past 42 trading days. So again, a 500 share position, you’re almost $70,000 just in the past 42 trading days.
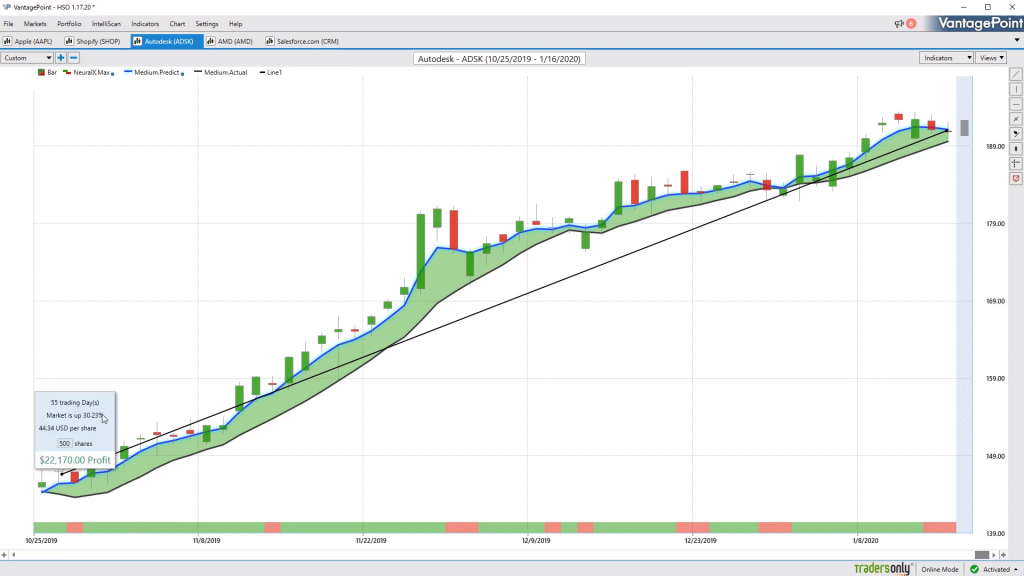
Autodesk (ADSK)
Shares of Autodesk, same thing. We brought this through I think back in December, but really nice opportunity to the upside. We get these crossovers just a ton of strength from the neural index. Huge separation between that predicted moving average and the actual moving average. And over the past couple months, really the same thing, is using that guidance from these predicted levels to say, okay, well where do I want to add to this particular position? As long as that blue line is still above the black line, you’re good to go here. And you see this market just continues to move higher and a lot of these, again, shorter-term predicted high levels being reached, really within a couple of trading days here. Overall Autodesk shares up over the long haul here, really a significant amount here, up over 30%, again over $20,000 just on a 500 share position. But you see with these entries as well, is if you’re getting in at the right time, you’re getting these entries starting all the way down at 145 and able to again, use those profits to add to your position along the way. Also, take profit at these predicted highs or some profit targets a little bit higher than that predicted moving average.
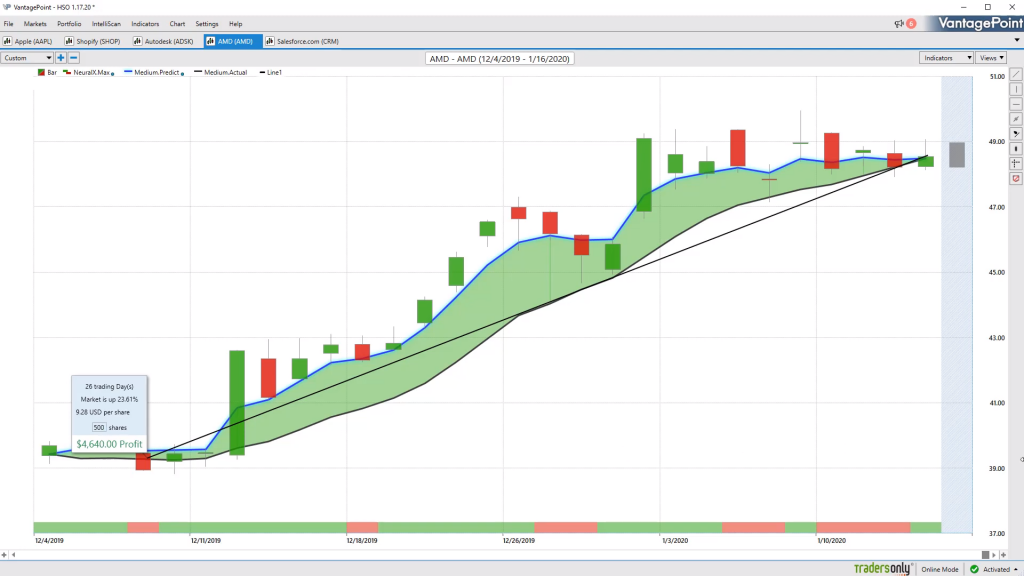
AMD (AMD)
Shares of AMD. Really popular stock here. You see we have this crossover at the beginning of December get a little bit of sideways actionary. See, the neural index goes bearish. You get this subsequent 48 hours of weakness where you’re trading below that predicted moving average, but that blue line still remains above the black line and it’s telling you, look, the overall trend is still to the upside. You see even more recently saying, look, try to get some cheaper prices here. We’re likely to go sideways. What happens? We run sideways, blue lines still holding above the black line there though. And again, more recently, good opportunity to get in at these lower levels, maybe take some profit up at the higher levels, understanding that there’s some persistent weakness there just over the 48 hours. But again, a really nice opportunity to go ahead and get long, many of these tech markets here, and you see shares of over 23% just in the past 26 or so trading days. Again, 500 shares of a really cheaper stock, only about $40 per share, you’re up over $4,600.
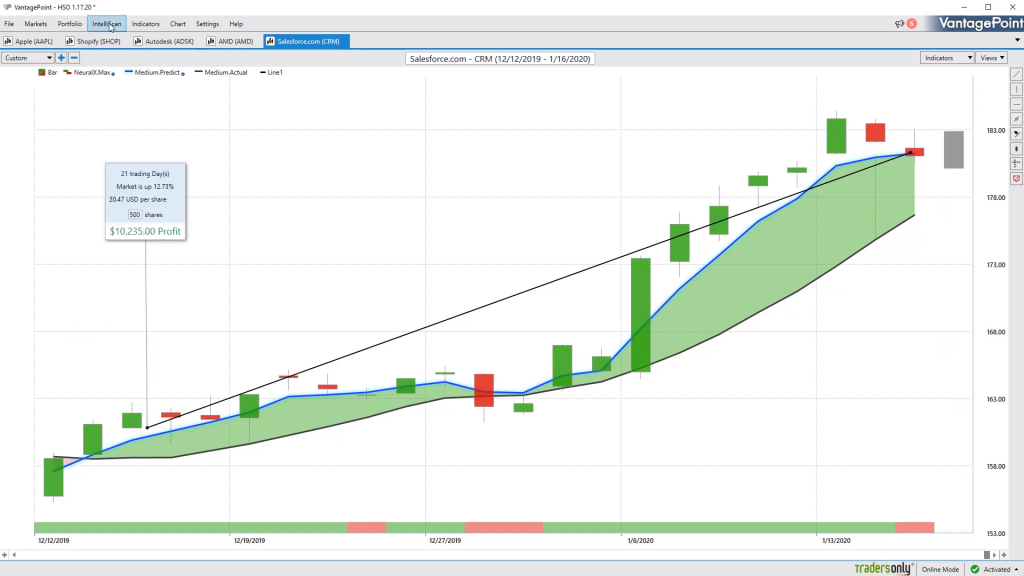
Salesforce.com (CRM)
Lastly here, shares of Salesforce. Again more recently getting this crossover to the upside. A lot of strength from the neural index and you see what happens here where you get some weakness from the neural index. Well, what happens? Well, you start to run a little bit below the predicted moving average, but the trend is still very much the upside. That blue line never crosses below the black line. You see all this strength from both the predicted moving average and the neural index starting to move higher and really see that strength coming to the market and things accelerate to the upside.
Where this can be helpful is understanding, okay, well what is my trading approach? Am I a shorter-term trader? Am I a swing trader? Or a trend trader? And then matching these predictive indicators to your style here. So you see we have Salesforce up over 12%. again, 500 share position, you’re up over $10,000. And where this has been official for traders is where they can utilize the Intellus Scan feature, so it can identify opportunities that meet the specific trading criteria that they have. So we can go ahead here, open up a new Intella Scan. I can also go ahead and open up our market tree so we can see all this selection of the market. So whether you trade futures or Forex, ETFs, we’ve got stocks here, in this example, just go ahead and add all of these individual stocks. And what we can do is actually set a lot of search criteria that again specifically match what it is that we’re looking to find in the marketplace.
So if we go ahead and add some of these filters here, you can set a lot of these different conditions. So if you want greater than, less than, how many days a particular predictive indicator has come through, in this case, we’ll just set it to less than eight or so. So we have markets that are in an established uptrend. We also have some other predictive indicators. So some shorter and longer-term predictive tools to make sure that you’re really getting enough on that side. Are enough conditions really in the same direction? You see neural index as well here. Want that short term tool to the upside. And you see we get a lot of these different tools or a lot of these different markets coming through and we can identify, okay well, where do we want to look for particular opportunities? Possibly in the tech sector where we’ve seen a lot of strength, and this can direct us to additional opportunities in the marketplace where we understand that there’s a lot of strength from these predictive indicators, and then go in with our specific timeframe and understand, where exactly and how do we want to trade that particular market?
So really great opportunities, again, all throughout the marketplace, a lot of strength and that’s creating a bunch of tremendous trading opportunities, specifically in tech here, but really widespread across the different areas of the market.
Once again, this has been our Hot Stocks Outlook for January 17th, 2020. Thank you all for watching. Best of luck and bye for now.


