


Register for a Free Live Training
The Hot Stocks Outlook uses VantagePoint’s market forecasts that are up to 87.4% accurate, demonstrating how traders can improve their timing and direction. In this week’s video, VantagePoint Software reviews forecasts for SPDR SPY($SPY), Goldman-Sachs($GS), Apple ($AAPL), TESLA ($TSLA), DropBox ($DBX), CubeSmart ($CUBE)
SPDR SPY ETF ($SPY)
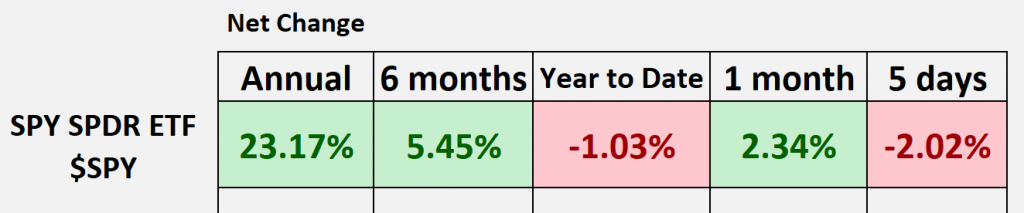
Hello again Traders and welcome back to the Hot Stocks Outlook for January 5th, 2024, our first Hot Stocks Outlook of the year. So, I hope you are all doing well out there in the financial markets. Getting really geared up for a new trading year. And as we typically do, let’s just take a look at that spy, the broader markets over these given blocks of time. Uh, and so what we can see here is the most obvious thing here is we’ve started the year rough and Vantage Point actually did a very excellent job of forecasting this move low, specifically in the tech stocks and NASDAQ side of things, so we’ll go ahead and take a look at that. Uh, but as we look back, we go back 30 days on the calendar, we’re still up a couple of a percent but not really applicable going in a new year and a new month. Uh, and here the past 5 days, we’re still off about 2% as the end of the year we started to turn lower here but let’s go ahead and get into the charts because this is what’s really important for Traders to get ahead of these moves and understand what’s going on out there in the broader market, and I think one of the best places to highlight this is in shares of Apple.
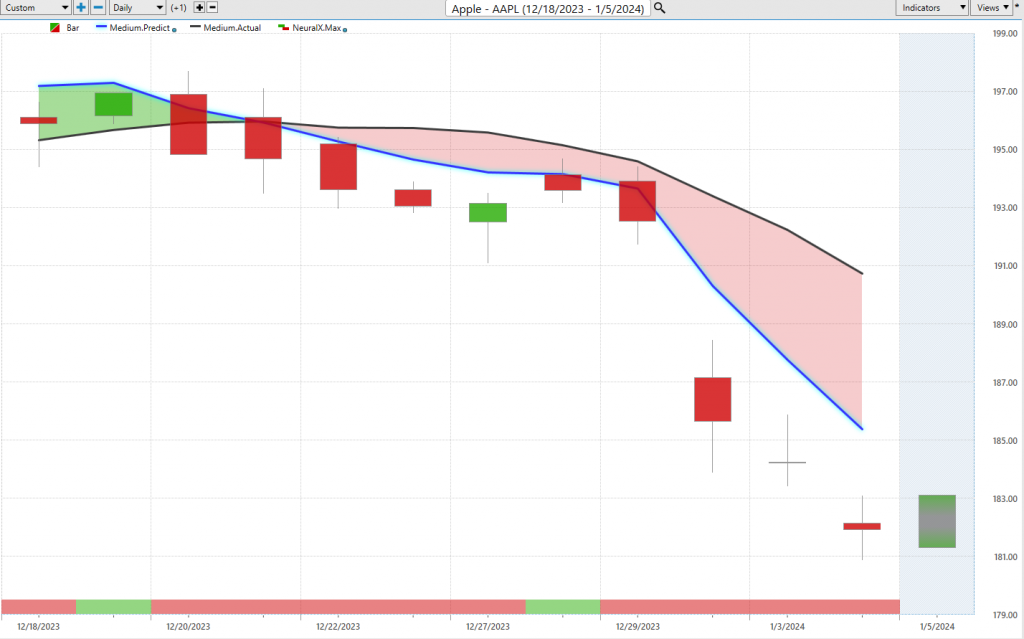
So a really good example of what we have here on the Apple chart is daily price action, so each one of the candles that you’re seeing represents a full and complete trading day, and it’s right up against all of that price data that what you’re going to notice is well a few indicators but what we’re going to focus on right now is this black line and blue line value. Now the black line that you’re seeing there, that is actually a simple moving average so it’s a very common technical indicator in this case it’s a 10 period simple moving average and what that will do is just look back at the last 10 closes add them together and divide by 10. Now what that does is it smooths out the existing price action and lets Traders know where the market has been, but again the problem is all that market data is lagging, it’s really just a summary of what’s already occurred in the market and Traders need to be ahead of that next move in the marketplace, and so what we’re able to do is what we do is compare that black line value or that lagging moving average to this proprietary predicted moving average, and for that number essentially a prediction of price moving forward for that to be plotted and calculated on the chart for the Trader, well this is where the technology of artificial neural networks come into play and what they’re doing is what’s called intermarket analysis and what that means is this technology is able to really derive price Clues out of dozens of markets that are known to drive and influence the future price of Apple. Now that can be things like you know ETF groups that can be things like other individual stocks maybe those tech stocks like Nvidia and Microsoft but it’ll also look at very important markets like the dollar Index and that’s what we’ve seen at the beginning of the year is a big spike in the dollar that’s pushed Metals Downs it’s pushed the stock market lower and has a big effect if you’re trading Apple stock as an apple Trader but this goes all the way down to individual uh stocks goes down all the way to commodity markets like gold silver uh wheat whatever markets are applicable to the target market in question and so it takes all of that analysis and then generates highly accurate price predictions and it’s those techn logically driven price predictions that are used to create these indicators. So what Vantage Point’s indicators are doing are forward-looking predictive indicators and whenever we see that blue line in this case cross below the black line well it’s suggesting average prices are going to start moving lower when you have a big leader and you know the NASDAQ start to go lower like this well we know that there may be some weakness in the market specifically though Apple you do not want to be long here, uh, now at the very bottom of the chart though you’ll see this bar that goes from green to red and back to green this is another indicator utilizing that approach of intermarket analysis but it’s tuned to solve a different problem and this problem is really just two days short-term strength or weakness in the market and this has an extremely high level of accuracy associated with it across really all markets whether it’s Apple individual stocks ETF groups and so that helps us with the short-term forecast of strength or weakness in the market and lastly we’re even provided a predicted high and a predicted low so now we’re down to intraday price levels provided for the Trader before the next trading day as you see we have this Shadow candle what will occur is the actual Market data will fill that in the predictions will stay where they are and what we can do is look back and see how accurate all of these predictions were on their trading days and we see that if we understand Apple’s in a downtrend hey we want to be shorting and targeting actually these predicted lows as a short-term Trader and clearly the trend is lower so as we come into the new year get a big gap down a lot of momentum now a really nice position for Traders to have on if in fact they want to go short or potentially hedge any Longs that are currently in the portfolio and this is something that we can cover as we look at like Goldman Sachs and Cubesmart some of these opportunities that are still technically an uptrend but we’ve seen a lot of weakness throughout the marketplace and this is what Traders need to understand for their portfolio we had about nine days in Apple shares off about 7% here and most of that just coming this week and and that’s what’s really been the the clue from Vantage Point is there’s a lot of weakness going into the week here and you need to be aware of that.
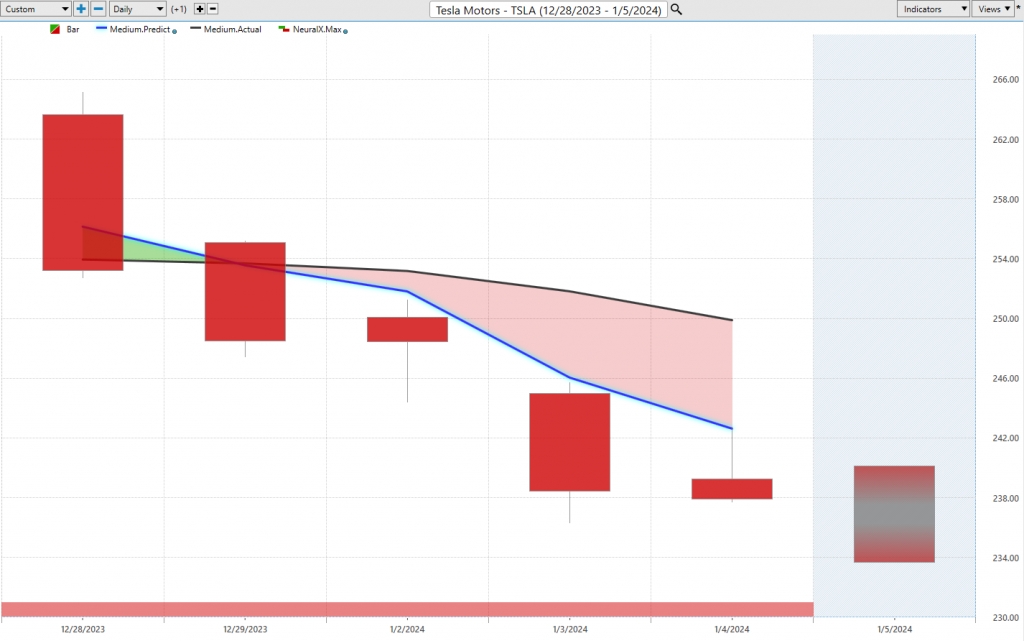
Here are shares of Tesla and we can see that it was a little more Cho in the market but we clearly got this crossover to the downside and let’s take a look at that neural index so that 48h hour indicator of short-term strength or weakness in the market what has it shown for the last 5 days in shares of Tesla well it’s been bearish additionally to that shorter term 48 hour forecast being bearish well we have the predicted moving average Crossing lower and also of course the predicted high and low ranges will go lower as well.
And you see how these levels just keep descending, keep descending, and we have seen weakness in shares of Tesla after we got that crossover. There’s actually this, you know, a lot of resistance up here at 250, and you know that’s about a $10 move, just really in the one trading day, one day to the next here, so a pretty nice move in Tesla still very early though, right? So just helping you understand that look, if you want to take positions on Tesla shorts, certainly are weighing out here or maybe some put options. You’re down about 6% just in the past four trading days, and so this is what Traders need to understand that there is something seriously going on here in the NASDAQ and certainly those big stocks that drive the index around well they’re going to be most affected. So if you’re doing any trading there, we can benefit off the Vantage Point forecast, make some money on the bear side, potentially even hedge maybe some long positions in the portfolio.
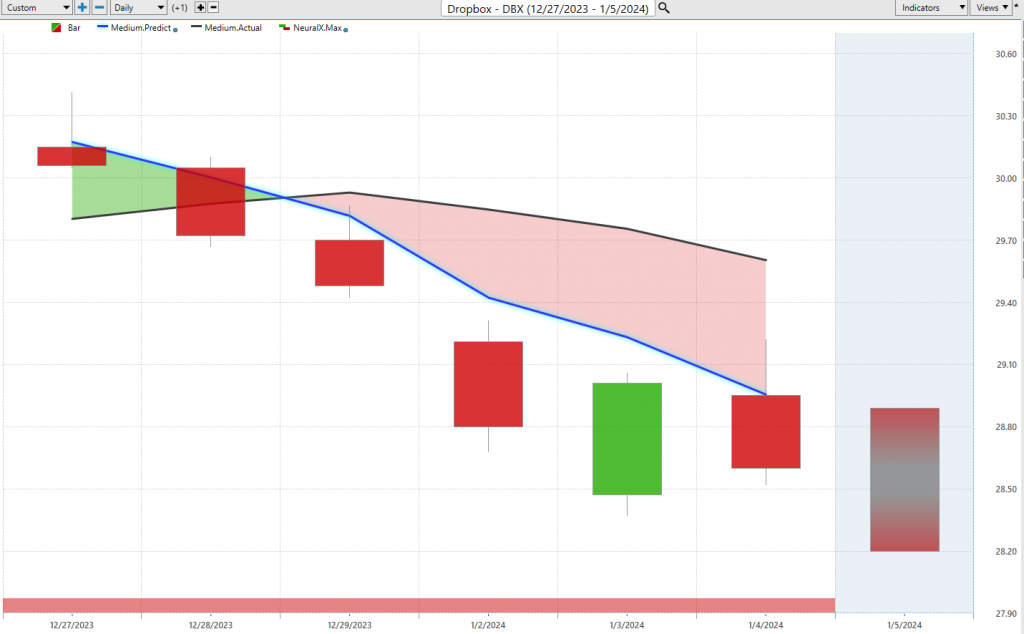
Here shares of Dropbox again, just another example of there’s some issues around the tech space, and we saw this on the NASDAQ futures and the QQQ, the ETF. There’s a lot of different ways that Traders can utilize the Vantage Point forecast because it provides these forecasts all across the market, individual stocks, commodities, Futures, just like you see with those intermarkets that go into the forecast. All of those markets are getting their own forecast produced as well. And so here we see with Dropbox, we get that crossover to the downside, and again, what is that highly accurate neural index informing you about this stock in particular right, specifically Dropbox, what’s going on where there’s a lot of weakness that you should expect in the short term once that crossover to the downside happens, well now we’re in a downtrend with some short-term weakness to be expected. So here again we see about a 3-4% decline just in the past few trading days. We can, of course, look at those predicted highs and lows to guide the trader for you, so you even see yesterday these moves up towards those predicted highs over the past couple of days, not a place you want to be long, right? Because we’ve got some issues here in some of these stocks.
So really nice opportunities there on the bearish side to start the year, something that VantagePoint has forecasted quite well via the indices and very important stocks, that something’s going on here.
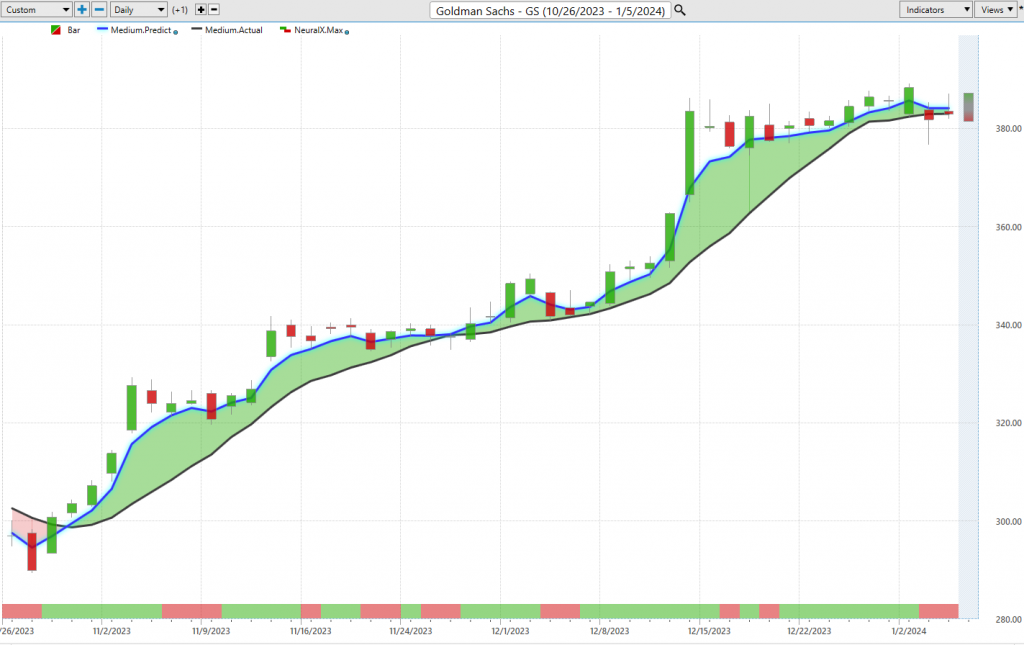
Now I believe a couple of weeks ago we looked at shares of Goldman Sachs, and so here’s a good example of a market that is still in an uptrend. And we can see that, well, how has this Market performed while the broader markets have kind of gotten hammered pretty badly here? Well, it’s gone sideways, and that’s to be expected as these predictive indicators are still remaining bullish. Well, what’s happened in the past week? The Market’s been sideways; it hasn’t moved lower. And so you see those levels holding up in the forecast, remaining bullish. But this is why I get to potentially hedging while we still have a bullish forecast here. You see that neural index is getting bearish, and there are some other areas in the market where there is some pronounced weakness that I think Traders need to be aware of and incorporate that into your portfolio and your analysis.
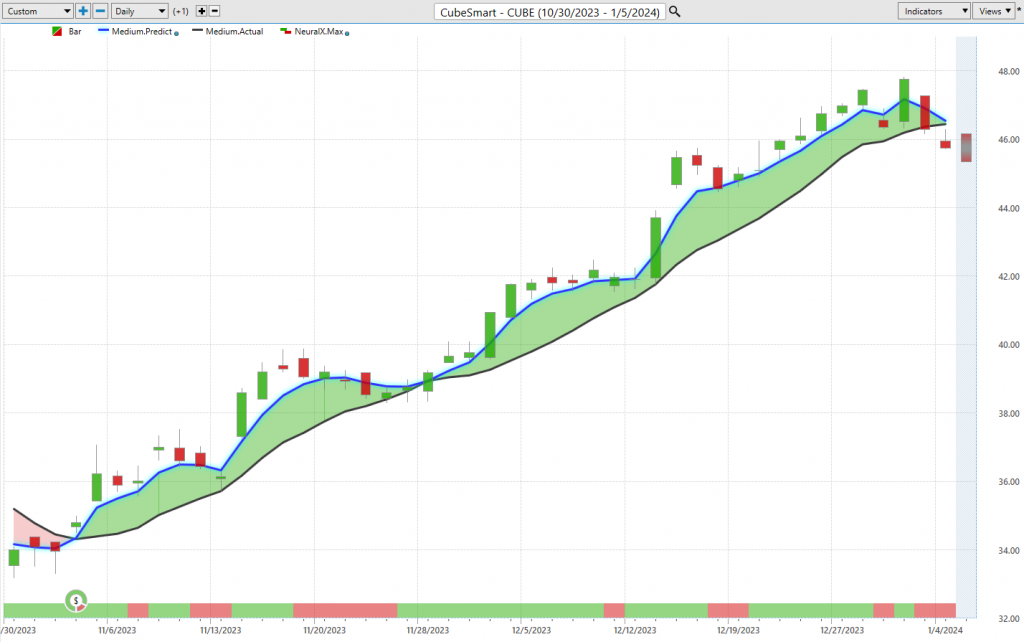
Lastly, here shares of Cubesmart, again, another example here of just these markets that you’re starting to see this weakness play in, but these were markets that were really great opportunities starting in November. Now we can utilize the VantagePoint forecast to say okay, well, as long as that blue line remains above the black line, the trend is still up, and what you can do again is head in other areas of the market. So while you may have a long position on Cub smart, you may be willing to take profit on here shortly. There can be other positions that are just getting started and in profit while some of those other markets start to run sideways, and you can get that additional information to update your portfolio here.
Again in Cubesmart, really nice opportunity here, but you do see this weakness coming in, right? So as we’ve seen in some of these markets, great opportunities to be buying at the predicted lows. We saw the broader markets were very bullish all through this period, but obviously here we know something’s up in the broader markets. Maybe cool it off on the bullish side and open up those Hedges. But again, it’s just an interesting week, right? Here’s a Goldman Sachs, you again see these predicted highs and lows doing an excellent job on the way up here, and now we understand that something’s going on in the broader markets. Maybe cool it off on the bullish side and open up those hedges. But again, it’s just an interesting week, right? We start the week, we see these really important markets start to aggressively go lower, and right now they’re in a downtrend. So that’s what needs to be understood is, you know, this has all turned lower, these really important areas of the market. What’s going to be important for Traders is to have the right tools, whether it’s next week, next month, a couple of months from now, where stocks start turning higher like they did in November. If you don’t have the right tools to recognize at the right time, you’ll probably be behind it, and therefore having a rougher time managing those opportunities as they start to move and open up opportunities throughout the marketplace.
So just want to go ahead and start there. Once again, this has been our hot stocks outlook for January 5th, 2024. Hope you all are having a great week, best of luck out there, certainly there’s some volatility to be aware of. Thanks again and bye for now.


