


Hot Stocks Outlook for the Week of
July 10th, 2020
The Hot Stocks Outlook uses VantagePoint’s market forecasts that are up to 87.4% accurate, demonstrating how traders can improve their timing and direction. In this week’s video, VantagePoint Software reviews forecasts for Taiwan Semiconductor (TSM) Electronic Arts (EA), Opko Health (OPK), Thor Industries (THO) and American Express (AXP)
Register for a Free Live Training
This Week’s Hot Stocks Outlook
Hello again, traders and welcome back to the Hot Stocks Outlook for July 10th, 2020. Hope y’all are having a excellent week out there in the financial markets. And as always a lot to cover in this week’s Outlook. So we’re going to go ahead and go through a lot of different sectors of the marketplace here.
We’re going to start here with Taiwan semiconductors, very important stock as far as the tech stocks go. We’ve got some biotech here in OPKO Health, Electronic Arts, there’s some software and video games. Thor Industries makes campers and travel trailers and things like that. And lastly, a financial stock here with American Express.
Taiwan Semiconductors (TSM)
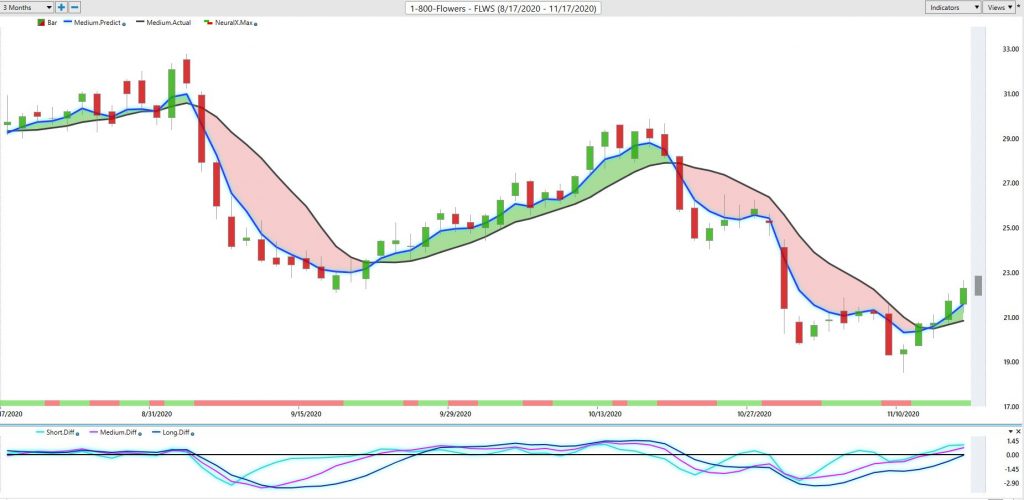
So starting out here with TSM. Now, what we have here against the chart here is daily price action. So every one of these candles represents a full and complete trading day. You see the open, the close, the high and low. And right up against those candles, you see that there is a black line and a blue line behind really this green area as well.
And what we have here right up against that price there’s a couple of very important indicators provided within the VantagePoint software. Now the first indicator here, this black line, that is a regular, simple moving average. Or what we refer to in the software as the actual simple moving average. And that’s a very common technical indicator in that it looks back over previous price action, takes the last 10 closed prices, adds them all together and divides by 10.
And with an indicator like that, it’s a very good measure of where market prices have been. But we need to know, okay, where are things going, moving forward? How are things looking over the next couple of days or weeks ahead? And so what we want to do is actually compare that black line or that lagging moving average we can refer to it as, to this blue value, which is actually the VantagePoint proprietary predicted moving average.
Now, for this value to be calculated each and every trading night, what VantagePoint is able to do is it’s utilizing the technology of artificial neural networks and performing what’s called intermarket analysis. So it’s very obvious at this point that other markets drive and influence a set of other markets.
When we’re looking at Taiwan semiconductor, that shares some very important relationships with other tech stocks. It has a strong correlation with the S&P and NASDAQ indices. It has a very strong relationship with ETF groups. It even shares correlations in relationships with global currencies, interest rates, futures, and commodity markets.
And so, what we’re able to do here is look at how those other markets drive and influence each and every target market that you’re generating a forecast for. And it takes all of that information and actually generates future price predictions. So you can think of that as things to the right of the chart that haven’t yet occurred yet, and actually incorporates those predicted values into the value of these technical indicators. Turning what was a lagging indicator that only reacts to past prices, into a forward looking predictive tool that is really weighted by those very important data and relationships that are drawn out of those intermarket relationships.
So, whenever that blue line in this case crosses above the black line, it’s suggesting average prices are expected to start moving higher so that the prediction of the moving average is actually higher than where things have been here. Now, there’s other indicators here on the chart though, that are also utilizing this technology of neural networks, but they’re tuned to different timeframes to really help with what style of trading are you doing. What are you trying to accomplish with your trading approach, your technique?
Now, at the very bottom of the chart, you’ll see that there’s this bar that goes from green to red, back to green. And what this is, is another indicator derived via that neural network predictive process. But what it’s doing is it’s very short term, it’s only looking ahead 48 hours. Whereas the predicted moving average is more of a average prices over a longer period of time.
Essentially the overall trend, is it to the upside or downside? So this indicator at the bottom of the screen will update each and every trading day and let you know, okay, well over the next 48 hours, are you likely to see some bullish price action, some higher highs or some lower lows? And that can help you with limit orders, knowing when to buy on the dip, or when you should really hold onto your existing position.
And then to really round out the entirety of this, you actually have a predicted high and a predicted low. So when we talk about that timeframe of an indicator, now we’re down to intraday levels that you’re going to have at 6:00 PM Eastern the night before going into the next trading day. Letting you know, okay, well where can you set limit orders? Where should your profit targets be? Depending again, on that timeframe of trading, also very good for adding to an existing position.
So if you get involved in a trend, it starts to move in your direction, you may want to add more to that opportunity, assuming the trend is still intact. So what we can do is actually look and say, “Okay, well, what were those daily predictions going back over the price data?”
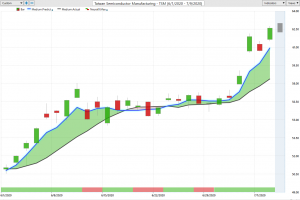
And you can see that, especially on days like this, if you have a limit order waiting down at the predicted low, you get filled at the open. Again, here you have a down day closing very close to the predicted low. Again, another day goes by, you’re closing inside of that range. So, three excellent entries at the beginning and start of a new uptrend.
And you see as volatility really starts to expand VantagePoint does a good job here of really retuning itself. Obviously when you’re having multiple percentage gap up days, that volatility in range is going to expand. But what’s very great about the software is it has a really good job of getting retuned to the existing data and getting things back on track.
And so what’s interesting here with TSM, we’ll go ahead and obviously follow this market over the next several weeks, but we want to be getting those entries before the market makes a big push. And that’s really the benefit of utilizing these predicted moving averages, so that you can get in before the market starts making an acceleration and moving higher. And it becomes obvious to all those lagging and predicting indicators that the market’s moving. Here this allows us to get in before the big move in markets.
OPKO Health (OPK)
So this works on very large stocks like TSM, but also on smaller stocks. It’s taking the same sort of approach of finding those intermarket relationships between the target market and specifically what drives OPKO Health here. And so what we can actually do, I usually don’t show this here, but we can come into markets here and type in OPKO. And what we can do here is actually look at this properties tab that actually shows what data is going into the predictive forecast.
So you can see, again, this target market of OPKO Healthcare, and it’s going to have its unique set of what we’d refer to as intermarket. So these other markets that are known to have very important relationships to that market, you can see things like biotech ETFs, things that are fairly obvious. Indices like the Russell. Oil and energy stocks, NASDAQ biotech, the gold market, interest rates, other pharmaceutical companies.
And so, this is what’s going into that forecast to create that really prediction of how are these other markets known to influence, some of those can be leading relationships, some of those lagging. And what this allows the software to do is really be quite adaptive. So when something happens in this target market, but also when things happen in those intermarkets, these indicators are tuned to really take note of that and accommodate for this valuable information that can be seen in these other markets.
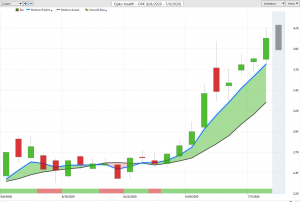
So again, we can take a look at OPKO here and we see we get a very strong crossover here at the really midpoint of June here, suggesting look, the overall trend is now up. And you see that you have a long period of time where things really aren’t going anywhere, but you want that forecast that says, “Look, the overall trend is up.” If anything, you want to be long here. You see over the duration of these neural network forecast of the predicted neural index, most of that data remaining on the bullish side. And letting you know in the short term, you’ve got strength. The overall trend is up. And then we can look at the minutia of those predicted highs and lows.
And you see here on a day like this, where you’ve got the market trades higher, it trades down to this predicted low here. Well look what before this trading day here, you’re getting that slanting lower of the predicted high and low range. And letting you know that, look, some price data is very likely to take place down here towards this predicted low.
And you again, see how these things adapt and then shoot up to the predicted high. Running a little sideways here again. One last push to the predicted lows there. And then this market going into a very strong uptrend. But of course, you want to have a tool that’s letting you accumulate those positions before the market starts making aggressive push.
And you can see more recently as the volatility is expanding, excellent intraday levels to potentially add to that position or take a day trade. Recognize that you’ve got a strong uptrend here. You want to be buying at the lower part of the range in a longer term uptrend there.
Again, really nice opportunity here in shares of OPKO. We can see that over the duration of this move. This has been a scorcher here. A 56% rally to the upside here just over the past 19 trading days. So again, a very cheap stock here, but you want that guidance so that you can get involved in an opportunity and not have to risk a huge amount to hold onto that position, but still have a tremendous profit potential here.
Electronic Arts (EA)
Moving on to again, some of these larger tech stocks. You’ve got Electronic Arts, very similar situation here. Around June we had some of these stocks really start to improve and go into uptrends. And again, you can see that this crossover moves to the upside, neural index warns you of potential weakness here over these 48 hour forecasts where you see the trend really slows down, but it’s still to the upside.
So you understand that look in the next 48 hours, you may have some weaker price action. But all that’s really letting you know is buy down at those predicted loads. Right. Get better entries into this overall market. And you see again, how that indicator works, letting you know, look you want to be getting into the market down here on this longer term range that we have going on. Where’s that better intraday price to go ahead and take a position?
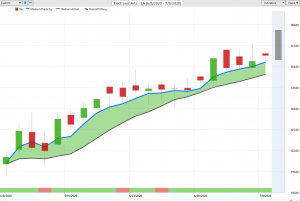
Now, some earlier entries back here where we get that first sort of rattling around in decline. But again, you see this, where the software says, “Look, expect some lower price action here. Be prepared for that. Don’t have stops sitting inside of this range here, where the market is very likely to go ahead and trade.”
And some of these additional opportunities to go ahead and add to that position and you see same thing on the upside where the software does a very good job on an intraday timeframe of picking out, okay, how high is this market likely to continue for at least the daily timeframe period here? So overall again, a really nice move here. Market’s up about 12 and a half percent, just over the past 21 trading days here in Electronic Arts.
Now, here’s what I want to get to and this is as critical as markets that are moving up. We got to know when to go ahead and take our profits and move on from opportunities that have now moved to the downside. Here we have Thor Industries and this was really a great market. This was a market that you had a lot of people over the COVID period were saying, “Okay, well. We need to buy campers if we’re not going to be flying around and going on vacation.” That moved a lot of interest into motor vehicles and coaches and things like that.
Thor Industries (THO)
And you see huge, huge uptrend going on here in shares of Thor Industries. And that lasted for a long period of time. But very clearly the software’s saying, “Look, that trend is over. Go ahead and take your profits. Get out of the way. Look onto something a little bit better here.” And we can again come in with the help of these predicted moving averages here and say, “Okay, well, if we’re coming into that downtrend, where do we want to be shorting the market?”
And it’s the exact same thing, whether it’s to the upside or the downside, you need a good gauge and a good measure that says, “Look, the trend is now down. Now go in over those shorter term timeframes and look to exploit that opportunity.” So we can go ahead and get a good picture here. It hasn’t been a huge move, but we’ve had for the most part strength in the markets. Right.
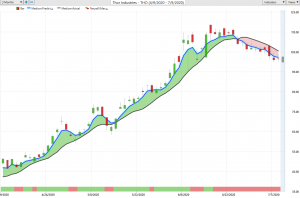
The markets have actually been performing fairly well, have been very resilient here, but we need to know that really on that shift, it was a Thursday a couple weeks ago, the markets made a big down move. Some markets remain in their uptrends and have moved up even more so, finding new highs. Other markets have not. And you don’t want to be sitting around losing 7% over the last two weeks of trading here in Thor Industries.
The other area where that’s been very pronounced is financials. And again, this is that huge Thursday where you had a huge move on the indices, like the Russell and the S&P. And you can see here that in a market like this and the financials generally, it’s not just Amex. It’s the big banking stocks. It’s Bank of America to Wells Fargo. These things have not recovered.
American Express (AXP)
So we want to go ahead and divert capital to areas where the market is in these strong uptrends and really avoid areas like Thor Industries or Winnebago or American Express or Bank of America and these things. So again, we can have this guidance that says, “Okay, well, where do we want to be shorting?” See, this is an interesting day. You get a little bit higher here, but look how you end up closing all the way inside of that daily range, bouncing off the predicted low.
And again, these areas where, what do you want to do? Well, you’d want to come in and be a short interest here if you’re going ahead and trading the market here for American Express. And you see multiple, multiple entries here where within 48 hours that trade is in the positive and continuing to move in that bearish direction.
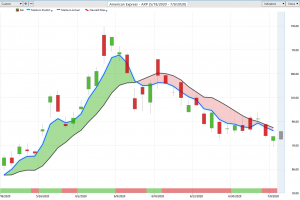
And again, you can also see the benefit of that neural index, letting you know that the overall trend’s been down over this entire period, but expect some strength over the next 48 hours here. Expect some strength over the next 48 hours here, but don’t be getting long. Right. Looking for those opportunities to short or cover those short positions.
And again, it hasn’t been a huge move lower in many of these financial stocks and many of these areas where there’s been weakness. But obviously, I mean, 10% over the past 17 trading days, a big enough move to not be involved. And even to make some money on the short side of this market, as you potentially create that hedged portfolio areas where you’re long in the market and other areas where you’re short. Then almost regardless of what we see happening in the S&P, some big news comes in, things start moving. You’ve got something that’s really working for you.
So, I know we’re going a little longer here in this week’s Hot Stocks Outlook, but just very important to highlight how really see these big transitions across sectors. And that’s why when we look at manage point and how many of the tools are set up here, you see that all these things are really split up by sector here. Right. So that we can analyze these markets actually incorporate them into a nightly scanning process and really identify, okay, where is that strength in the market? Where should we look for opportunities? And where should we go ahead and potentially look for weakness and areas to actually short the market or hedge some existing portfolio positions. So, once again, this has been our Hot Stocks Outlook for July 10th, 2020. Thank you all for watching. Best of luck and bye for now.