


Hot Stocks Outlook for the Week of
July 31st, 2020
The Hot Stocks Outlook uses VantagePoint’s market forecasts that are up to 87.4% accurate, demonstrating how traders can improve their timing and direction. In this week’s video, VantagePoint Software reviews forecasts for Auto Nation (AN) , Graham Holdings Company(GHC) Overstock.com (OSTK), Opko(OPK) and Taiwan Semiconductor (TSM).
Register for a Free Live Training
This Week’s Hot Stocks Outlook
Hello,again traders and welcome back to the Hot Stocks Outlook for July 31st, 2020. Hope you’re all having an excellent week out there in the financial markets and as always, plenty of great opportunities to cover in this week’s outlook.
We’re going to start here with shares of AutoNation. We’ve got Graham Holding Company, Overstock.com, Opco, and TSM. And I wanted to use these examples to really show all the different components that we have here within Vantage Point, whether that be the predicted moving average, this neural index at the bottom,and also this predicted high and low that you’re provided each and every trading day in addition to really reviewing a couple companies we’ve brought through over the past few weeks here.
Auto Nation (AN)
Starting with AutoNation though, and really is a basic example of how these tools work, is what we have here is daily candles. Each one of these candles represents a full and complete trading day and you’ll see right up against that price data there is a black line there and also a blue line. Now, what that black line is, is a simple moving average or what we refer to as the actual simple moving average and that’s a very common technical indicator. It looks at the past 10 close prices, adds them all together, divides by 10,and moving averages are a good measure of really where market price has been over a given period of time. And it smooths out that data so you can get a sense of the overall price movements in the market.
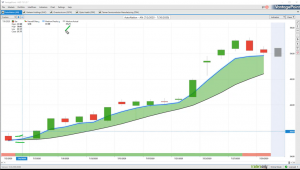
But really the weakness of simple moving averages or even exponential or really any moving average, is that it’s looking at all the data from the past, so it really gets dragged around by those most recent close prices and isn’t really predictive at all. It’s really just reacting to what’s already occurred in the market. And obviously as traders, we want to know where are prices going moving forward?
What we have here with this blue value is actually Vantage Point’s proprietary predicted moving average. And for that value to get calculated each and every trading day, Vantage Point is performing what’s called Intermarket analysis and specifically utilizing the technology of artificial neural networks to do that. What that means is rather than just looking at AutoNation, Vantage Point’s able to look at important market relationships taking place in specific markets that are known to drive and influence in this case, the target market here. That can be things like the S&P 500. That can be things like global currencies. That can be ETF groups or individual stock markets. That can be global interest rates, futures and commodity markets. Now, a lot of these things, they can share positive correlations, inverse correlations, there can be leads and lags in that market data that’s very significant and that’s what Vantage Point does, is it pulls that out and actually uses that data to actually generate predictions.
Things to the right of the chart that haven’t yet occurred and it builds those values into the value of this moving average. Rather than having this tool that gets dragged around by what’s already occurred in the market, this is forward looking and predictive. And whenever we see this blue line cross above the black line, it’s suggesting average prices are going to start moving higher. You can think of this as your overall measure of trend in the marketplace. Now, in addition to that predicted moving average at the very bottom, you see this indicator, it goes from a green to a red every day it gets updated for you. And that also is derived via that neural network process. But it’s tuned to look at only 48 hours ahead. It’s a very short term strength or weakness in the marketplace.
And to round out the entirety of this, if you look at the very right hand portion of the chart, you actually have a predicted shadow candle here of a predicted high and a predicted low. And again, that’s what these neural networks are doing are actually now picking out not 48 hours, not a predicted moving average, but actually intraday levels for the next trading day. What that gives you is a overall forecast where you can understand that, okay, well, if I’m looking at shares of AutoNation, this is now going into an uptrend. You have strength over the next 48 hours and you can look towards the guidance of those predicted highs and lows. And so what I can do here is bring up all of those actual predictions against the actual market data. What will occur here is we’ll get an actual candle filling in what ends up occurring on this next trading day, but we can see how accurate all these trading days have been.
And so when you understand and say, “Okay, well I found a market where let’s say, I want to be long or short.” You have that directional bias. Then you have that guidance to say, “Okay, well, where should I look to take entries into this marketplace?” And what’s really great about the software is it does a really good job, especially when volatility picks up, as looking at those Intermarket relationships, readjusting its forecast and adapting very well so that you can trade over the next couple of trading days and make good trading decisions here.
We see in shares of AutoNation overall, a really nice move here. You got plenty of entries in the early part of this trend, seeing a little weakness here from the neural index most recently, but you got a 44% move to the upside in just the past 18 trading days. Very clearly that over the short term and as far as a trend, this is a very strong move to the upside. Look to take short term trades or a trend trade or add to an existing position. And that’s where I find it really effective is when you get ahead in the trade, being able to say, “Okay, I can now use those profits and potentially build a larger position with very limited risk.” Potentially even locking stops in at breakeven when you look to do those things.
Graham Holdings Company (GHC)
Next opportunity here is Graham Holdings and very similar situation, but I just wanted to highlight how we have this a crossover between the predicted moving average and the actual moving average. And you’ll see periods like this, where you see the neural index it goes down to a red, it goes back to green and red. And remember, this is only looking ahead 48 hours. It’s very short term. Short term strength or weakness over a small period of time and so if you’re trading window and sort of your trading timeframe is accounting for that, it makes it very easy to say, “Okay, well, the overall trend is up. I have a directional bias or our predicted moving average is still saying that market’s in an uptrend, but at expect that weakness.” You understand what’s going on and say, “Okay, well I should expect prices to trade down towards these predicted lows.”
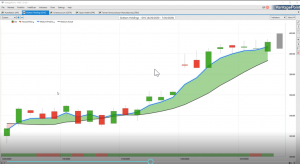
And what I also want to point out is days like this, where you see how the market trades up this day and then the very next day it comes down and hits that predicted moving average, same thing here. You see all the buying comes in on one trading day, but that overall range over that 48 hour period is quite good at letting you know, okay, well, what are the prices you should expect here as you try to participate in that uptrend? You see, again, the volatility picks up things get back online and you get these very accurate predictions moving forward to do some trade management from.
A really nice pop in the market here in shares of Graham Holdings here. Overall, we got to move here of about 22% in just the past 20 trading days. And again, a 100 shares has you about $6,000 here. 500 shares has you at $37,000. A very expensive stock in this case. But all that really matters is this percentage move on the position size that you’re taking.
Overstock.com (OSTK)
Here in shares of Overstock. Here’s something that’s really moving, not just 20% here, but we actually brought this back all the way back in, what was it? March or April, actually, when the markets turned up at the end of March, this has just been performing really well. We went a little sideways, but here we have again, getting that cross over to the upside and saying, “Okay, well, Overstock’s back in an uptrend. You’ll see again, these periods where the neural index gets bearish and how I like to look at this is sometimes you’ll see that neural index get bearish and expect prices to move below this predicted moving average. It’s a good measure of the overall average prices, but you can trade above and below those levels and you see each time this happens, you get a little bit of a pullback, little bit of a pullback, but the overall trend very much intact.
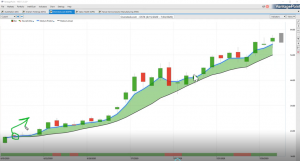
And why this is so important is because you really want to understand once you’ve gotten into a position, well, what should you do moving up forward? Should you hold onto that position? Is the trend still intact? Should you take profits and get out of the way? Well, this market up 168% in just the past 30 trading days, a pretty cheap stock here where 500 shares has you up about $19,000. But what you don’t want to do is buy the market here and sell the market a few days later. Understand that okay, well, there might be some weakness over the next couple trading days, but that trend is still intact. Look to buy on the dips down at those predicted lows that come through to help guide you moving forward here.
Huge opportunity, almost a 200% rally here in shares of Overstock and a very strong uptrend, both from trend here and short term as well.
Opko (OPK)
Here’s Opco. And this is something that we brought through really just last week, but I really wanted to highlight here that you’ve got the overall trend. You had that guidance moving forward, but even when volatility picks up. When the market breaks out or starts shaking around the upside or the downside, whether it’s making a pullback and a quick retracement, you want that guidance to say, “Okay, well, how should I look to trade this?” And we can bring in those predicted highs and lows and you’d see things like this. It was predicted low slanting down, let you know, hey, there’s weakness here. there’s weakness coming through. But overall that trend is still very much intact and very strong to the upside here. Very, very cheap stock here, but wanting that guidance that says, “Okay, well, if you’re going to be a buyer, buy down at these levels and experience some continuation of that move here.”
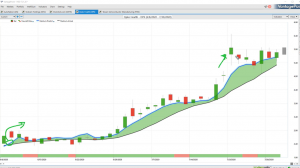
Again, with that important aspect of should you be holding on to a position? Or getting out of the way? Really linking what the indicators are telling you with your trading strategy. And when you understand the time periods that these indicators work in, you can build a very good strategy that is going to benefit off of the accuracy of these tools here. Again, market up over 126%, 500 shares which would be literally nothing, only about a $1,000 actual position size, has you up over $1,600. Obviously a few thousand shares going to make you a lot more money.
Taiwan Semiconductor (TSM)
And lastly here, TSM. This is another one of these markets that we brought this through, I believe on July 10th. A market again, where we say, “Okay, well sure. We’ve seen the market move higher and that’s been great, but what if you’re still trading this? What should you be doing?” Well, the trend is still up. Blue line is still well above the black line. And we can see, okay, well, how did those predicted highs and lows do at forecasting how you’d want to manage this opportunity? And again, you see periods like this, where you really see that volatility pickup. That’s going to happen when you start seeing the market make sort of gaps and things like that in the trade, but you want to be down here buying at these levels as the market continues that uptrend. And as long as that blue line remains above the black line, you want to keep participating in that trending opportunity.
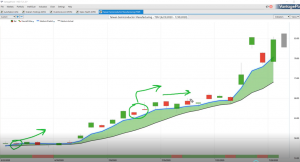
Once again, here, obviously more recently with that trend remaining higher, after we brought it through on the 10th, it says, “Look, the trend is still in place. You can trail your stops with the market, but don’t get out of the way, because you’re going to miss the best part of the move here.” And shares up about 46% overall. Again, 500 shares there has you up about $13,000.
Regardless of the areas of the market you’re trading, we’ve got a lot of different types of companies, biotech, semiconductors, you’ve got AutoNation, Graham Holdings, a lot of these different types of companies, but it really doesn’t matter. What you need is that accurate tool that regardless of the market you’re trading is going to give you the guidance to manage the opportunity, make adjustments when you should, but also hold on to trades longer so that you really stay involved with the trade as that volatility really starts to pick up and markets start to move.
Once again, this has been our Hot Stocks Outlook for July 31st, 2020. Thank you all for watching. Best of luck out there and bye for now.


