


Register for a Free Live Training
Hot Stocks Outlook uses VantagePoint’s market forecasts that are up to 87.4% accurate, demonstrating how traders can improve their timing and direction. In this week’s video, VantagePoint Software reviews forecasts for Crispr Therapeutics ($CRSP), The Brinks Company ($BCO), Robinhood Markets ($HOOD), Oracle ($ORCL), Lantronix ($LTRX)
VantagePoint A.I. Hot Stocks Outlook for July 4, 2025
Hello again, traders, and welcome back to the Hot Stocks Outlook for July 4th, 2025. I hope you all have had a nice week out there in the financial markets. A little bit of a short week this week. Uh, but as always, we’re going to take a look at the most recent VantagePoint AI predictive forecast.
So, if you haven’t already, be sure to go ahead and click on the link down in the description below, and you can get signed up for a live demonstration and learn all the specifics about how these predictive indicators and tools are helping traders make much better trading decisions out in the marketplace.
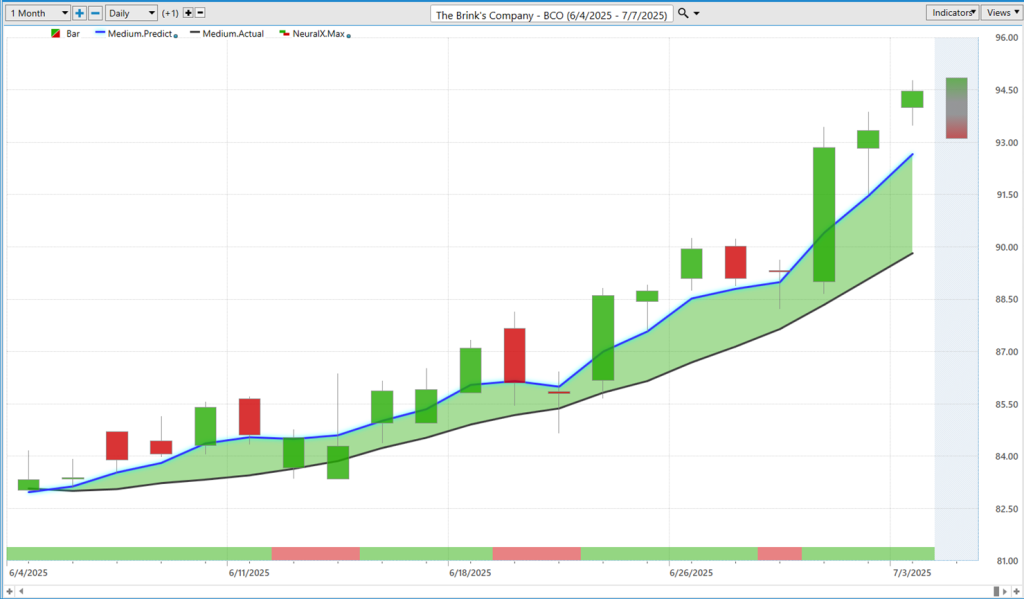
Uh, now we’ll go ahead and start out with shares of The Brinks Company ($BCO), and it’s a really good example of how all of these tools work together to really round out the predictive forecast. And so, uh, as we always do week to week, we’re looking at daily bars and candles, right? So, each one of these candles you see on the chart—that’s going to represent a full and complete trading day.
And the first thing that’s going to jump out at you is that there is a black line and a blue line value right up against all of that price data. Uh, and so the black line value that you’re seeing there is actually a simple moving average, or what we would call the actual moving average. Uh, and so this is a very common technical analysis indicator, and it’s really used as our baseline in this instance because what it does is it looks back at the previous ten close prices. It would add all those close prices together and then divide by that value.
And what that does is really smooth out the existing price action, right? Again, acting as a baseline of where prices currently are. But traders need to be ahead of that next move in the market and understand where prices are likely to head next. And so what we’re able to do is compare that lagging moving average to the VantagePoint proprietary predicted moving average.
And so for this value—or what you can think of as a price—to get calculated and plotted on the chart every evening, well, this is where the technology of artificial neural networks comes into play and really improves upon the traditional technical analysis.
And so, for this instance of The Brinks Company, there could be dozens of other markets that are going into this calculation. And what they’re going to do is scan, uh, different stocks. It may be different ETF groups. It can even be commodity and futures markets like the value of the dollar index. It can be global interest rates, uh, and when applicable, even down to global commodities like wheat, corn, sugar, gold, platinum prices.
And so it really takes this robust approach and uses that information to really draw out price clues that are used to generate these predictions on where price is headed next, offering traders an early signal as far as, you know, ahead of market making a move. Uh, and so whenever we see this blue line value—in this case—cross above the black line value, well, it’s suggesting that these average prices are going to start moving higher and traders may want to look to take a long position.
Now, as long as that blue line stays above the black line, well, we would assume that the trend is up and traders may want to keep exploiting that directional bias in the market.
Now, that’s not the only problem traders need to solve as far as the overall trend direction. Sometimes it’s very valuable to understand short-term strength or weakness in the market and really identify high-momentum scenarios. And so, if we look at the very bottom of the chart, you’ll see this bar here that goes from green to red back to green.
Well, this is utilizing that technology as well, but it’s used to solve a different problem. It’s not looking at future average prices. What it’s doing is taking a very binary look at: are prices likely to be higher or lower 48 hours into the future?
And so it does this with an extremely high level and rate of accuracy—upwards of 80-plus percent—um, really scooting towards more the 85% accuracy mark. And so again, every single evening you’re getting a forecast that anticipates: will this be higher or lower 48 hours into the future?
Uh, and of course, we also look at each week our predicted high and low. So now we’re down to utilizing those neural networks to identify intraday high and low points of the market to help traders with entries, profit targets, in accordance with, you know, their trading time frame and approach here.
Uh, and so we see since we got that forecast, we’ve really seen, again, a lot of markets performing extremely well. Uh, here, shares up about 13% in the past 20 trading days. But let’s remember that every single trading day, you’re getting those predictions of the overall range.
And so this is what’s really exciting about identifying a market—uh, really honing in on where you want to trade—and then utilizing these levels to get, you know, the best positions possible, right?
And, um, so this is really helpful as far as when you’re in an uptrend, potentially adding to a position with those profits and really exploiting that move. And so you see here about five times where we come down towards those predicted lows. Uh, but especially as this neural index gets bullish, that’s where we really see the momentum, uh, really kick up in the market.
So, really exciting opportunity here in The Brinks Company. Uh, again, about a 13% rally here just over the past 20 trading days.
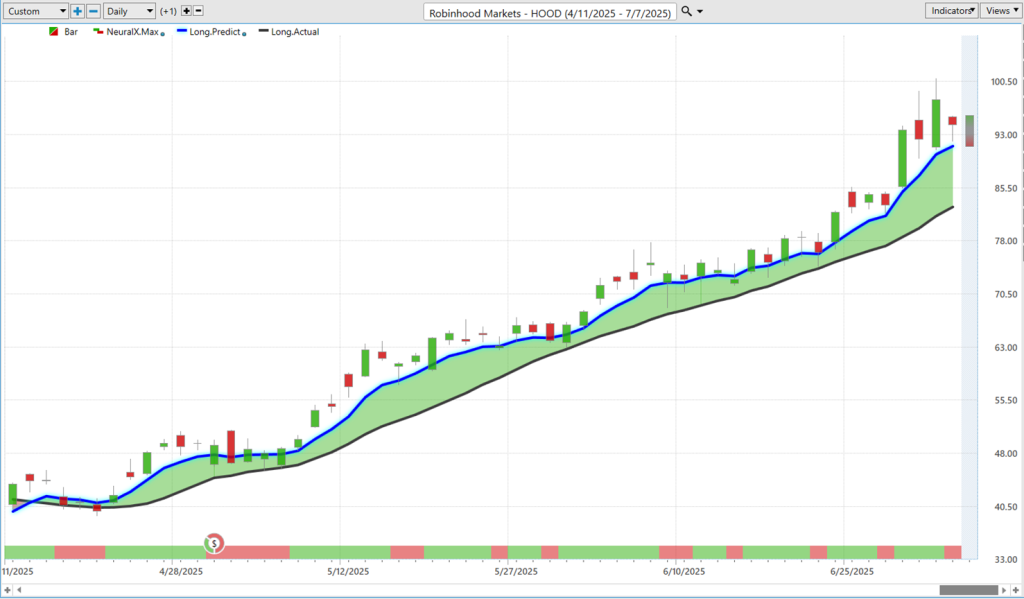
And so let’s go back to some of these markets we’ve looked at in previous weeks. So, a couple of weeks ago, uh, we took a look at Robinhood Markets ($HOOD). We’ve seen a really nice continuation of that move here.
And so if we just go ahead and focus in with that same approach and say, “Okay, well, over the past couple of weeks here, the market’s been in a strong uptrend. We’ve had the neural index predominantly bullish here, uh, signaling strength over those subsequent 48-hour periods.”
And then, of course, we can take a look at those predicted highs and lows. Uh, and so you see here over the past, you know, 10 trading days from about here, uh, we got this move—uh, really before what would have been Friday, you know, during last Hot Stocks Outlook on Friday—um, getting this move down to the predicted low and then really doing well as we come into the next trading week.
Uh, and even midweek here, right? Scooting down to about 91 here, which would have been Tuesday, uh, and then trading higher through the week and even here on, uh, Thursday, just, uh, sort of closing right at that predicted level. So we’re getting a little bit of a slant lower for the projected predicted high and low—neural index bearish—so potentially some weakness at the early start of next week. Uh, but overall, the trend still very strongly bullish here.
And when we take a look at this overall move, this really goes all the way back to, uh, really April. And that’s where we really saw a lot of stocks start to kick up, uh, and a lot of this momentum coming into the marketplace. 129% rally here in just 57 trading days. Um, you know, even a small position here—you know, 500 shares—is about $26,000. Even 100 shares is going to be over a $5,000 move, uh, in the stock price.
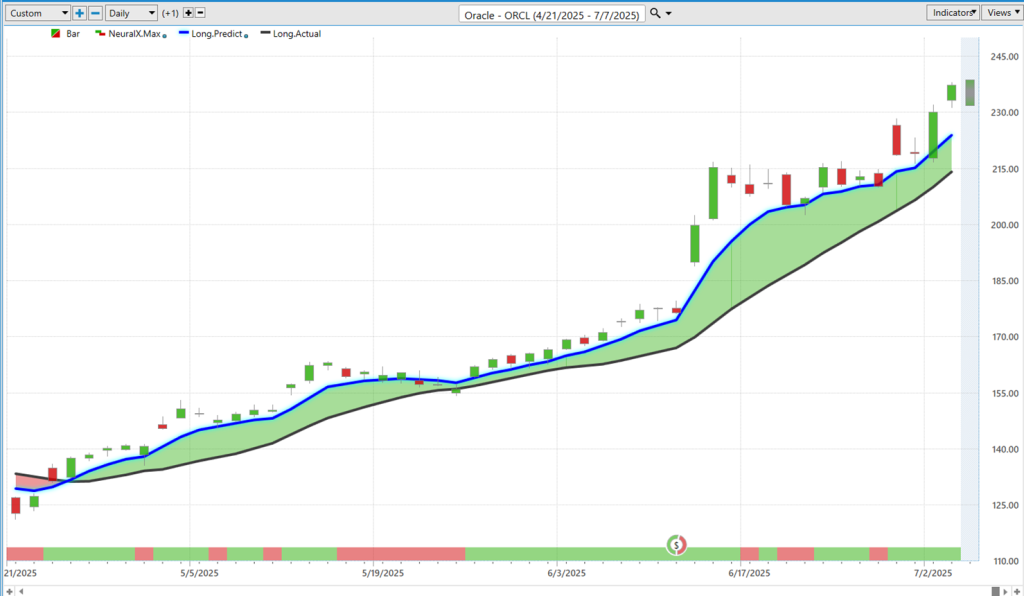
Oracle ($ORCL), another stock that’s performed extremely well here. And again, we can take a look at these predictive indicators, getting this blue line crossing above the black line. And there’s a lot of features within VantagePoint, most notably the Intelliscan, that can help identify when these fresh crossovers are occurring.
So, you’re able to set up really a process every night to identify these fresh turns in the market—really hone in on, uh, the opportunities, uh, where you want to focus your attention.
Uh, so, here we see that blue line crossing above the black line as we get the market really settling after this huge rally. See the neural index goes bearish—really warning of that subsequent weakness. But overall, right, the trend is still up. You’d want to be looking to buy at these predicted lows, uh, target new highs in the market.
And again, over the past couple of weeks here, uh, we can see how this has performed. So, you know, we get through earnings, get that strong move. And what the neural networks are really good at is adapting—so taking in this information, understanding the price move in the target market, but then looking at those intermarket relationships, whether they be the Q’s, other tech stocks, other AI-driven stocks—um—and then making that assessment of how are these things likely to move in the short term moving forward in accordance, again, with the time frame, uh, of each indicator here.
So, we see we get multiple levels moving down towards these predicted lows. And again, even this last week off this, uh, gap up here, everything gets readjusted. It said, “Hey, look down towards these predicted lows if you want to get involved in the uptrend.” And so this has been another really strong mover just this past week. You’ve got another about 9%, almost 10%, move from those predicted lows. From these early predicted lows, we’re up about 46% in the last 25 trading days.
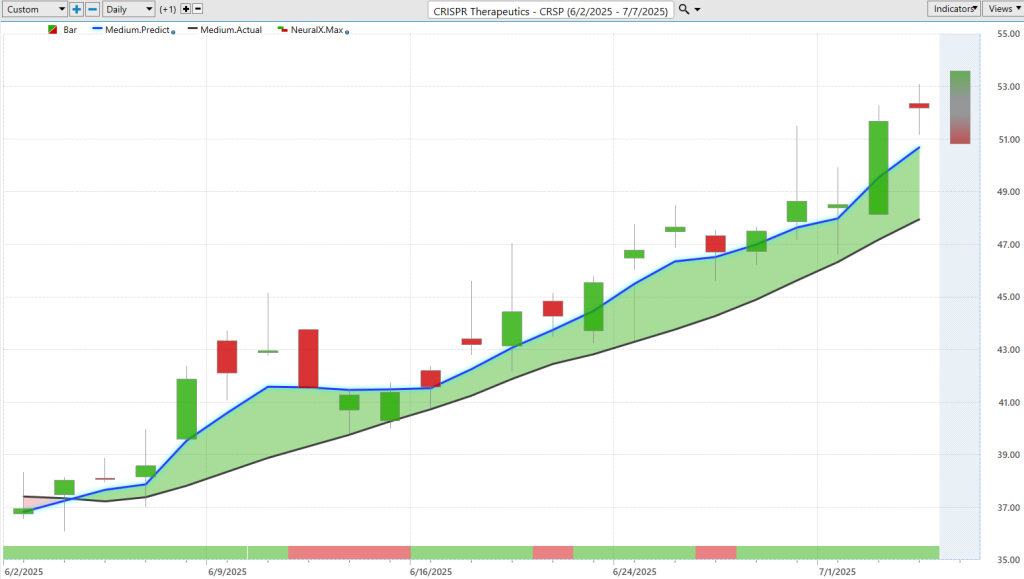
CRISPR Therapeutics ($CRSP)—this is another market we looked at last week, and again, another just good example of how you link all of these predictive indicators together. Really think about your time frame and approach to trading and how you can best exploit that opportunity.
So, uh, here we see we’re getting our blue line above the black line. You’ll get these little dips here, uh, where the neural index gets bearish—often warning of some subsequent weakness. Again, it’s always only looking ahead 48 hours. So, as that neural index gets bullish, we see that momentum really kick back into the marketplace.
And more recently—I think last week we took a look at this—so just over the past four trading days here, moving down towards this predicted low, getting a really nice entry over the past couple of weeks, uh, and then getting that movement higher here, trading from about 47 up to about 53 in some pretty short order. So just that move from the last week—it’s another 11% rally in the stock price.
Uh, and lastly here—you know, if you trade cheaper stocks, right—it really doesn’t matter as far as the stock price. Um, oftentimes trading lower-priced stocks, you want to be even more honed in on the value and price that you’re getting involved in.

Uh, and so here we see shares of Lantronix ($LTRX). This blue line is above the black line. We’re seeing a lot of momentum come in—predominantly that neural index pretty much bullish, uh, over, you know, it’s probably about 25 candles or so. Uh, and again, we can look at these predicted highs and lows.
So what’s really helpful again is to have these values ahead of time and really understand, “Okay, well, if I want to be a buyer in this market, where should I look to accumulate a position?” And you see pretty much from those predicted lows being hit, you’re getting the market moving higher within pretty short order of about 48 hours.
You see—moving to the predicted low, up for the predicted high, predicted low, predicted high—we settle in at these predicted lows and then start moving up towards the predicted highs once again before really this momentum kicks up, uh, and share prices increase here.
So again, really nice move here over the past, uh, really several weeks. Um, most notably, you know, all these stocks moving up since April. We’ve just seen a lot of persistent momentum. Um, some areas where you may just want to avoid—where the neural index forecasts are bearish—you can just say, “Hey, look, let’s focus in on these areas where we see a lot of momentum, a lot of distance between our predicted and actual moving average.”
And you see here about a 35% rally just in the past 21 trading days here. Uh, and again, not a huge position, um, will do pretty well as far as adding to your portfolio and equity position.
So, uh, with that, we’ll leave it there on this holiday episode of our Hot Stocks Outlook for July 4th, 2025.
Thank you all for watching. Best of luck out there—and bye for now.


