Hot Stocks Outlook for the Week of
July 5th, 2019
The Hot Stocks Outlook uses VantagePoint’s market forecasts that are up to 87.4% accurate, demonstrating how traders can improve their timing and direction. In this week’s video, VantagePoint Software reviews forecasts for Best Buy(BBY), D.R. Horton(DHI), Boston Scientific(BSX), Reliance Steel & Aluminum(RS), and Kohl’s(KSS).
This Week’s Hot Stocks Outlook
Hello traders and welcome back to the Hot Stocks Outlook for July 4th, 2019. I hope you’re having a happy Independence Day. This week is a little broken up with Thursday having the day off in the markets. There’s still plenty of great opportunities playing out throughout the market.
We’re going to start today looking at the Best Buy Corporation, with a lot going on with home builders. We also have Boston Scientific and will be taking another look at Steel & Aluminum, which we highlighted earlier over the past couple of months. There’s also Kohl’s, so retail is another area that we’ve been focused on.
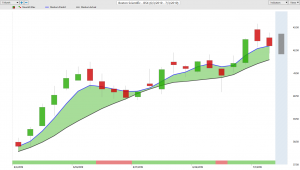
Best Buy(BBY)
Looking at Best Buy Corporation and their daily bars here, with each one of these candles representing a complete trading day. Against the price data there’s a black line and a blue line. There’s also an indicator at the bottom of your screen, to the right of the current price action.
Starting with this blue and black line against the price data, it’s very important we understand what these values are. The black line is a regular or simple moving average. It’s a very common technical indicator that does a good job of measuring where the market has been over time. All it does, however, is look at past prices from the one market in question, this being Best Buy Corporation.
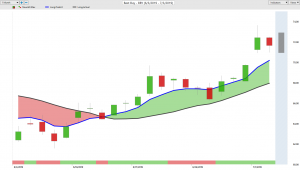
Let’s compare the black lagging value and the blue value, against the chart. For that value to be generated, the Vantage Point software is using its Neural Networks, a type of artificial intelligence, which is doing a very sophisticated type of analysis called intermarket analysis.
It doesn’t just look at past prices of Best Buy Corporation, but also up to 35 other markets, known to influence and share very important market relationships with Best Buy. That can be ETF groups, individual stocks – including important markets like the S&P 500, The Dollar Index. It also can include futures markets and interest rates, known to affect the future price of Best Buy. All that information is used to generate future prices, making them forward-looking and predictive.
When you have a situation where the blue value, or the predicted moving average, has crossed above the actual moving average, it suggests average prices are going to start moving higher. In addition to the predicted moving average, there’s another indicator at the very bottom of your screen. This green or red indicator is another indicator that’s derived via those Neural Network market relationships, but it’s very short term in that it only looks ahead 48 hours at a time.
It lets you know about short term strength, or weakness, in the market. It adjusts and adapts with current information, taking in more data and updates as it forecasts. To round out the forecast you’re also given a predicted high and predicted low, two values generated with the help of that technology. This creates forecasts a trader can understand.
If I’m going to trade Best Buy, when should I get long? Around June 10th, there’s a cross over to the upside, suggesting the trend is up. From this, you can use tools like the predicted high and low, which we see how accurate they are on this trading day.
You see how tricky the market can get on a day like this, where getting involved at a good point in the trend you’ll have to buy on a down day. You can see the market closes near the low, but the blue line is still above the black line. The trend is up. So, you see how this short-term strength corrects and starts moving to the upside, giving you more opportunity to add to your position. The Neural Index goes into a red configuration, signaling weakness over the subsequent 48-hour periods. That’s a good time to buy on the dip, understanding that there’s likely to be some weakness coming into the market. But the overall trend is still to the upside.
Overall, there’s a great opportunity here in shares of Best Buy. We’ve seen the market move up over 12% in just the past 15 trading days. What’s great about this is the multiple opportunities to add to your position.
You need to manage the opportunity effectively, perhaps taking a short-term day trade here, and add into your position on all these days. The market explodes to the upside there and creates a very profitable trading opportunity.
D.R. Horton(DHI)
Regardless of the markets, you’re trading the forecasts work the same way. We can it in shares of D.R. Horton, Lennar, and many other homebuilding stocks. And, it’s the opposite here, where June 19th, the crossover moves to the downside. The Neural Index is very weak over these subsequent 48-hour periods. Therefore, you want to use the predicted highs to measure where to set short positions. It can get tricky, to participate in the move, where you need to short on this trading day, as the market starts moving to the downside. It hit a predicted high here, gap up, immediately moving lower.
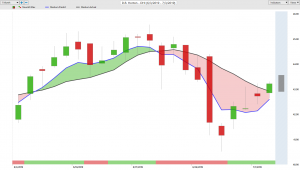
It’s helpful to have a trading day moving a little bit above the predicted high, though the Neural Index says to watch out for the price levels towards the predicted highs. You can cover some of that position and re-short at even better levels. Whether you’re a short term or longer trader, or a trend trader, you have the tools to make the adjustments, getting the most of an opportunity. You see this market from the beginning of the market to where it is currently, at about 4%. Over this period is a clear opportunity, and we can expect some strength in the marketplace, resetting the shorts at better levels. You can take that piece of the market out, locking in stops that break even, with a lot of different strategies. Overall the trend’s still to the downside, so we have to see how these things play out moving forward.
Boston Scientific(BSX)
Now, let’s look at Boston Scientific. There’s a crossover to the upside, all the way back in mid-May. A lot of the trends will persist sometimes. You need to understand when it’s a good time to buy on a dip. The blue line hasn’t crossed below the black line, but you see the Neural Index is warning you of weakness in the market. For the most part, you’ll have that advantage of predicted highs and lows, as well as, the Neural Index to inform you, letting you know what you should be doing to adjust your position, based on if it’s a trend trade or short term trade.
There’s a great entry at the beginning of this move, at about 16%. There are multiple pportunities along the way to add to this position, at a very good intraday level, allowing you to participate with many of these opportunities. There’s about 5 to over 10, almost 12 opportunities, where you can long, taking little pieces. There’s been a 16.5% move over the past month and a half.
It’s a great tool, helping you focus on a particular market, while making trade adjustments as things change, shift, and move forward.
Reliance Steel & Aluminum(RS)
We’ve talked a lot about steel and aluminum companies; which is another example of recognizing an area in the market where similar stocks are turning higher. Now, we’ll look at Reliance Steel & Aluminum, which had a with a crossover to the upside.
There’s a couple of periods where the Neural Index goes down to the red configuration, suggesting some short-term weakness. Remember, it only looks ahead 48-hours, readjusting its forecast accordingly. So, how are you going to trade this market over what’s been an entire month?
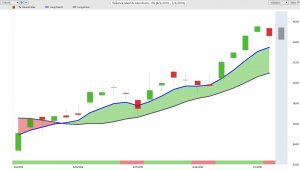
Well, you’re going to buy at these predicted lows and target the predicted highs. In this market we get a bit of snapback, like it’s coming back to this predicted level, gapping up and creating a lot of volatility. You can see how the indicators get back on track, letting you know where you want to add to this position. Only buying the market, as the predicted moving average is well above the actual moving average through the entirety of this. This tells you the market is going to continue moving higher.
It’s a nice opportunity to the upside in many metal and mining stocks; steel and aluminum stocks have done well over the past month. There’s an over 10% move to the upside over the past 19 trading days.
Kohl’s(KSS)
Now, here’s shares of Kohl’s, which we looked at a few weeks ago. We had highlighted, updated it, and the opportunities to continue shorting the market. What I’d like to highlight is how you get the updated forecast, letting you know things have shifted.
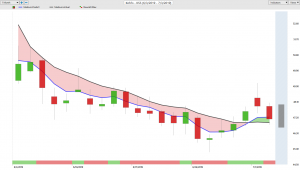
Not only is there a great opportunity to get short the market, start shorting from those predicted highs. You see more recently, a crossover to the upside, suggesting on this candle here, is a great opportunity to cover your position down at $47 per share. Make sure you keep those profits you’ve accumulated over the past couple of months as you’ve been shorting this market.
We’ve gotten a decline of about 31%. On the downside here, there are all these opportunities to short the market at predicted highs. That’s what one should be doing; shorting the market at predicted highs when the market’s in a downtrend. There’s a lot of shifting, suggesting this trend is over.
Make sure you cover those positions at that predicted low. Get out of the way as the trend is now to the upside, making certain you capture that 31%. Not only as a trend trader but being able to add to the position at very important times.
So, intraday, getting a good entry, where you can have a core position involved in this 31% decline. Add a little on this day and this one. Target the predicted lows. Take the little pieces out of the market over, over, and over again. Have multiple trades where you’re able to do trade management, adding into your positions at the appropriate times. Under the bigger picture of the overall trend, having the intraday levels where it makes sense to add to the position.
There’s a huge decline here; a 31% move. The shares of Gap are doing similar things, having declined but starting to turn higher.
This has been our Hot Stocks Outlook for July 4th, 2019. Thank you all for watching. Best of luck and bye for now.