


Hot Stocks Outlook for the Week of June 14th, 2019
The Hot Stocks Outlook uses VantagePoint’s market forecasts that are up to 87.4% accurate to demonstrate how traders can improve their timing and direction. In this week’s video, VantagePoint Software reviews forecasts for Sleep Number Corporation($SNBR), Hershey ($HSY), Boston Scientific($BSX), Beacon Roofing($BECN), and Zillow($Z).
This Week’s Hot Stocks Outlook
Good afternoon traders, and welcome back to the hot stocks outlook for June 14, 2019. Hope you all are having an excellent week out there in the financial markets and, as always, plenty to cover. As we’ve seen, the market’s moved around quite a bit over the past couple weeks. We’re going to go ahead, take a look here, we’ve got Sleep Number Corporation, Boston Scientific, Beacon Roofing, Hershey, and also Zillow here. So starting out here with Sleep Number, very important to understand how all these indicators against the chart work.
Now, these candlesticks that you see here represent a full and complete trading days. This all works off of end of day data, and against that price action you see that there is a black line and also a blue line on the screen. Now, the black line that you see there, that is a regular simple moving average, or what we refer to as the actual simple moving average. And it’s a very common technical indicator, right? You would just take the past ten close prices, add them all together, divide by ten, and you would get this line that just plots for each and every day as it cuts off the, you know, 11 days ago and adds the newest, most recent price data.
And that’s a great indicator to act as a good barometer of where the market prices have been, but obviously, we want to know where prices are headed going forward. So what we’re able to do is compare that value to this blue line that you see on the chart, and this is actually what’s called the predicted moving average. Now, how this value is generated is through a process of neural networks, it’s a type of artificial intelligence, and it’s performing a type of analysis called intermarket analysis. So instead of just looking at the past prices of Sleep Number, vantage point here is looking at different ETF markets. Different individual stocks. Things like the S&P 500. The dollar index. Currencies. Interest rates. And actually using that information to understand how those important market relationships affect and influence and share important relationships with the stock in question, in this case, Sleep Number.
And what it does is actually generate predictive data. So data in the future, which hasn’t yet occurred, and that’s used to actually create these values. So instead of using past prices, we’re actually using predictive data generated via the artificial intelligence, to make a much better indicator, to actually create a predictive indicator, and once that blue line, that predictive moving average, crosses above the actual, it’s really saying, “Look, average prices are expected to move higher,” and you can expect these regular moving average to start moving up towards that prediction.
Now, in addition to that predicted moving average there’s a couple of other indicators here that are also generated via that artificial intelligence. First off, we have the neural index. And so this green or red line at the bottom, you see it’ll update every single day, and what it is is it’s a 48 hour indicator and it’s predicting short term strength or weakness in the market, so not only do you have trend direction, but you’ve got short term over the next 48 hours, is there strength or weakness as well. And lastly, you get a predicted high and a predicted low. So, good intra-day values to base those trading decisions off of. Go ahead and put limit orders, your profit targets, things like that, so you can get a better position each and every day as you have these forecasts.
Sleep Number Corporation($SNBR)
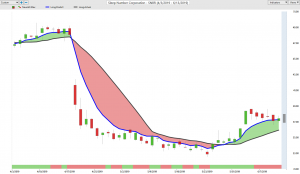
Now, if we take a look at Sleep Number here, we can say, “Okay, well if the direction is up, you want to of course be a buyer in the market.” And we see just a lot of strength at the beginning of this move from the neural index. But you want to be looking to buy towards these predicted lows, or ideally right at them, as we see getting an excellent entry over the course of this really four trading days here, right before this market really starts to move higher. Now, we start to get a little bit of a pullback, and you see these values, say, okay, well, expect some weakness in the market over these next 48 hours, but great opportunity to go ahead, take some profit, expect the market to trade a little bit lower, and readjust those positions, but overall just a fantastic trading opportunity here as we see overall this market, pretty, you know, up over 9%, I’m pretty sure we hit the predicted high here today.
Boston Scientific ($BSX)
So, up about 10, almost 11 percent, in just the past nine trading days here. Next here we have Boston Scientific. So again, another one of these opportunities where you get this confirmation from the predicted moving average that says, okay, well, blue line, well above that black line. Your neural index is up at a one saying, expect this strength to come through the market, but every day you’re going to get the benefit of those predicted high and predicted low values to help guide those trading decisions. So you understand that, okay, well, if I want to be a buyer in this market, well, where do I want to get in? Actually, after that crossover, if you have a limit order waiting, you’re going to get filled right at the open there. Another limit order filled there, filled there. Not sure if we’re filled there.
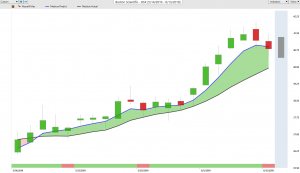
But, you see how on many of these trading days, the market wants to move down to those predicted lows, maybe push a little bit past it, but then you’re closing above the predicted lows. And so if you can deal with the volatility over the short term, maybe take some profit along the way here, but make sure that you’re getting involved at these levels, you’re going to do a lot better as far as managing that position. And also, not chasing the market over a few days when you can get in at a predicted low level just a few days later at an even better price.
But, you see how on many of these trading days, the market wants to move down to those predicted lows, maybe push a little bit past it, but then you’re closing above the predicted lows. And so if you can deal with the volatility over the short term, maybe take some profit along the way here, but make sure that you’re getting involved at these levels, you’re going to do a lot better as far as managing that position. And also, not chasing the market over a few days when you can get in at a predicted low level just a few days later at an even better price.
So again, some really great opportunities spread all throughout the markets, but again, there’s still that volatility out there. So another 10% rally in just the past 18 trading days, here in Beacon Roofing, you know, certainly not a place where you want to be taking positions here. At least not to the upside. Here we get those crossover to the downside, again you see it’s a lot of weakness. You see this neural index coming up to a one, and, you know, you’ll sometimes get those, you know, bounces in the price action. But overall you see, still, a lot of separation between that predicted moving average and the actual, again, you see neural index comes up here, you’re getting a little bit of a rally. You know, market moving above the previous close, here. But still, the movement to the downside. The overall trend saying, look, the direction here is down, if you’re going to be taking positions, short at the predicted highs, target some predicted lows, and a really nice opportunity in to hedge your overall portfolio. So not only get long the market, but also have these areas where you can go ahead and get short, and then really regardless, if there’s any shocks to the market, you’re going to be making a lot of money in one area.
Beacon Roofing($BECN)
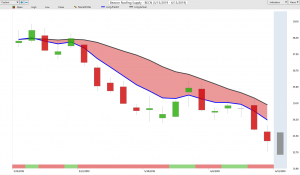
Here’s 14% decline just in the past 19 trading days in Beacon Roofing.
A market that we’ve talked about quite a bit, we actually covered this around here about May 10, or May 10 or 11, and we really looked at a lot of the consumer staple stocks that were doing really well, even through this market weakness.
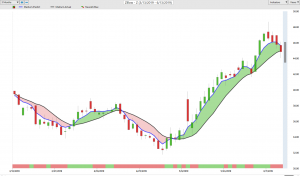
Here’s shares of Zillow. And so, exact same approach. You get this separation between the blue line and the black line, neural index up at a one. Telling you look, you want to go ahead and get long here. And if you’re going to get long intra-day, look towards those predicted low levels. So again, you see these opportunities where, you know, market’s sort of vacuuming up towards those predicted highs each and every day, well, great entry right there, great entry right here, great entry right here. To add to that position on these pullbacks. But getting a really great intra-day level price in an overall uptrend, so that you can really make the most of that opportunity, limit your risk, but also increase that overall upside here.
So again, some of these markets doing pretty well today. Up 35% just in the past 24 trading days, in shares of Zillow there. So, some really fantastic trading opportunities throughout the market, we’ve seen a lot of volatility both to the upside and to the downside. But obviously able to go ahead and point out these areas where there’s persistent strength, and that’s where you can focus your attention, get involved in the market, and you know, just again, last month here, you know, in shares of Hershey, you know, up another eight, nine, you know, ten percent. Over just the past, you know, 15 trading days, 20 trading days or so since we, you know, last highlighted this market here and some of these other things.
So have a great rest of the week, guys. Once again, this has been our hot stocks outlook for June 14, 2019, thank you all for watching, best of luck, and bye for now.
The Hershey Company($HSY)
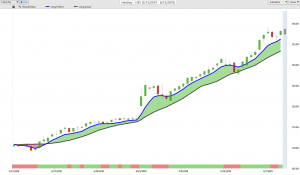
Well, here with Hershey, this started all the way back really in March, and there’s plenty of opportunities along the way, but what I just want to highlight here is, you know, if you’re trading this market and even after, you know, covering that forecast in May there, well, how is this trading moving forward?
Blue line has still remained above the black line, and then there’s been those multiple entries along the way to add your position, you know, take some profits along the way, predicted highs if you’re a shorter term trader, market moving up an additional 10% since then. So this is where this is really helpful, to make sure that you’re not getting out of your position too soon. You can always add to your certain trades with profits, but, you know, don’t get out of this 22% rally, as, you know, 10 or 11 more percent of that has just come in through the last month here. So about $25 per share, shares of Hershey up considerably in a very, very strong trend here you see over the past, really, what’s now almost three months.
Here’s shares of Zillow. And so, exact same approach. You get this separation between the blue line and the black line, neural index up at a one. Telling you look, you want to go ahead and get long here. And if you’re going to get long intra-day, look towards those predicted low levels. So again, you see these opportunities where, you know, market’s sort of vacuuming up towards those predicted highs each and every day, well, great entry right there, great entry right here, great entry right here. To add to that position on these pullbacks. But getting a really great intra-day level price in an overall uptrend, so that you can really make the most of that opportunity, limit your risk, but also increase that overall upside here.
Zillow ($Z)
Here’s shares of Zillow. And so, exact same approach. You get this separation between the blue line and the black line, neural index up at a one. Telling you look, you want to go ahead and get long here. And if you’re going to get long intra-day, look towards those predicted low levels. So again, you see these opportunities where, you know, market’s sort of vacuuming up towards those predicted highs each and every day, well, great entry right there, great entry right here, great entry right here. To add to that position on these pullbacks. But getting a really great intra-day level price in an overall uptrend, so that you can really make the most of that opportunity, limit your risk, but also increase that overall upside here.
So again, some of these markets doing pretty well today. Up 35% just in the past 24 trading days, in shares of Zillow there. So, some really fantastic trading opportunities throughout the market, we’ve seen a lot of volatility both to the upside and to the downside. But obviously able to go ahead and point out these areas where there’s persistent strength, and that’s where you can focus your attention, get involved in the market, and you know, just again, last month here, you know, in shares of Hershey, you know, up another eight, nine, you know, ten percent. Over just the past, you know, 15 trading days, 20 trading days or so since we, you know, last highlighted this market here and some of these other things.
So have a great rest of the week, guys. Once again, this has been our hot stocks outlook for June 14, 2019, thank you all for watching, best of luck, and bye for now.


