


The Hot Stocks Outlook uses VantagePoint’s market forecasts that are up to 87.4% accurate, demonstrating how traders can improve their timing and direction. In this week’s video, VantagePoint Software reviews forecasts for Ford (F), Zoom ($ZM), Tyson Foods (TSN), Pilgrims Pride ($PPC), Adobe ($ADBE), and Docusign ($DOCU).
Register for a Free Live Training
Hello again, traders, and welcome back to the Hot Stocks Outlook for June 18th, 2021. Hope you all are having a great week out there in the financial markets. And as always, plenty of markets to cover here in today’s Hot Stocks Outlook. So we will start with shares of Zoom Video. We’ve also got Adobe, DocuSign, Ford Motor, Pilgrim’s Pride, and Tyson Foods. So a lot to cover here.
But let’s go ahead and start here with Zoom Video, because this is a good example of a lot of the markets and a lot of the correlations that are currently playing out. So when we look here at Zoom Video, what we have is daily price action. This is what all of these are, is end of day data going all the way back, we can see, towards the mid-point in May, which is, again, where a lot of stocks turned up. And we’ve covered that over the past few weeks. So go back and watch those previous Hot Stocks Outlooks. And you’ll see, over this past three, four weeks, what we’ve identified as far as this pivot, or turn, around the 14th and 17th from these forecasts. But what we have right up against that price data, see that there’s a black line and also there’s a blue line there, right?
So the black line that you’re seeing against the price data, that is what we refer to as a simple moving average, or we call it the actual simple moving average. And that’s a very common technical indicator that just looks back over the previous 10 close prices. It’s going to add all those days together and then divide by 10. So it’s a good measure to smooth out the overall price data and let you know where market prices have already been over a given period of time.
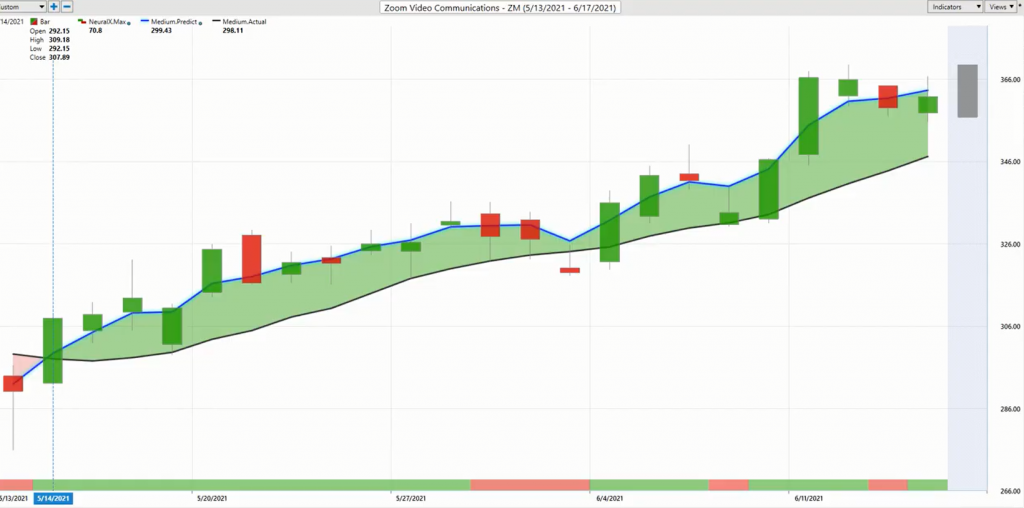
But obviously, a trader needs to know where price is moving going forward. We need to know in the middle of May, are prices going up, are they going down? What do we need to do here? So what we’re able to do is compare that black value, or that lagging moving average, that lets us know where things have already been. And we’re able to compare that to this blue line that you see against the chart. So for that value of this, what we call the VantagePoint predicted moving average, for that value to get plotted against this chart in relation to our lagging moving average, VantagePoint is performing what’s called intermarket analysis and it’s utilizing the technology of artificial neural networks to do that.
So what does that mean, intermarket analysis? Well, what it means is this technology is picking up clues from other related markets that are known to historically drive and influence the target market, in this case, Zoom Video. That’s going to be things like individual stocks. That’s going to be things like the broader indices, like the S&P 500. That’ll be things like the Dollar Index. We just had a big move in Dollar Index. That had an effect on individual stocks, and certainly commodities and certainly gold. We’ve got things like interest rates that are going to play in. Different ETF groups that wrap up a huge group of stocks.
And so it’s able to look at these market relationships and understand, okay, well, how are those global market relationships affecting future price, and how is that driving specifically Zoom Video? And things like Dollar Index, S&P 500, these big macro markets, they really play into just about every forecast. But you also see these subtle relationships between individual stocks that also give you an advantage in those relationships.
But the reason that I bring up big macro markets like Dollar and S&P is we’ve just had that big dollar move and I want to show you how the software helps you get ahead of these things. So Zoom Video here, what we have is this crossover between the blue and the black line. What that tells you is average prices. So that value that get calculated via that intermarket approach, it actually is using that intermarket data to generate future price predictions that haven’t yet occurred. And it uses those price predictions and builds it into the value of this moving average, turning what was a lagging indicator that is just going to get dragged around by price into a forward-looking predictive tool. So again, whenever that blue line crosses above the black line, suggesting average prices are going to start moving higher.
Now, at the bottom of the chart, you’ll see you have another indicator here. And this, again, gets updated after each and every trading day. And it can flip from green back to red. And this is also utilizing that technology of artificial neural networks, but it’s only tuned to look ahead 48 hours at a time. So it has this extremely high level of accuracy of 80 plus percent, but it’s only looking ahead 48 hours short-term strength or weakness. And we can use that as a throttle to help us know, hey, should we expect the market to move higher? Should we expect some cheaper prices over the next couple of days? And act accordingly with our overall strategy.
Now, to really round out the entirety of VantagePoint forecast, you’re also provided, you see this shadow candle at the right-hand side of the chart. And this is actually providing you with a intraday prediction of the high and low of the trading day. So when you understand, look, the overall crossovers come to the upside. I know I want to be long. I’ve got this guidance for short-term strength or weakness from the neural index. And you also get a daily prediction of the actual predicted high and low of where the daily range is likely to be. And like every week, we come in here and we can look back at those predictions and see exactly how accurate they are against the actual price data that occurred in the market.
And so you see, you get this, really, roadmap that says, okay, well, if you want to be a buyer, not only do we recognize that this forecast is saying, okay, well, we’re getting this move higher, but we recognize all the other stocks that are pivoting and benefiting from that big S&P 500 correlation. And that’s driven a lot of stocks up and created an entire month here, where if you have the roadmap from VantagePoint and know that you want to be a buyer, it makes it very clear on where you want to come in and accept prices.
And so, regardless of what your strategy is, maybe you’re a shorter-term day trader, maybe you’re a longer-term swing trader, options trader, it makes it very clear that there’s the potential start of a new opportunity all the way back here. And you’re going to have that guidance with those predicted highs and lows to help manage the opportunity.
And my whole approach and the reason that I really like to point out this pivot point from the mid-point in May is that it creates a scenario when you start the buying at the right time, you can trail your stops up with the market, accumulate more of a position with those accumulated profits you’ve been making. And if the market tanks and something goes crazy, then you maybe break even, give back a little money, but you really stand the potential to make really a nice amount of money as that market continues trend. And of course, you trail your stops and lock in the risk there, because you’re getting that good timing to start that move.
Now, let’s look at another opportunity. I know we spent a lot of time on that chart, but it’s really meant to help you understand what we’ve been talking about over the past several weeks and how VantagePoint can help you here. Here’s the chart for Adobe. You see, it looks awfully similar, right? So we have all these stocks over this week, the 14th through 20th, that week after the weekend of the big sell-off, we have all these stocks saying it’s time to get bullish the market. You want to go long.
So here’s shares of Adobe.
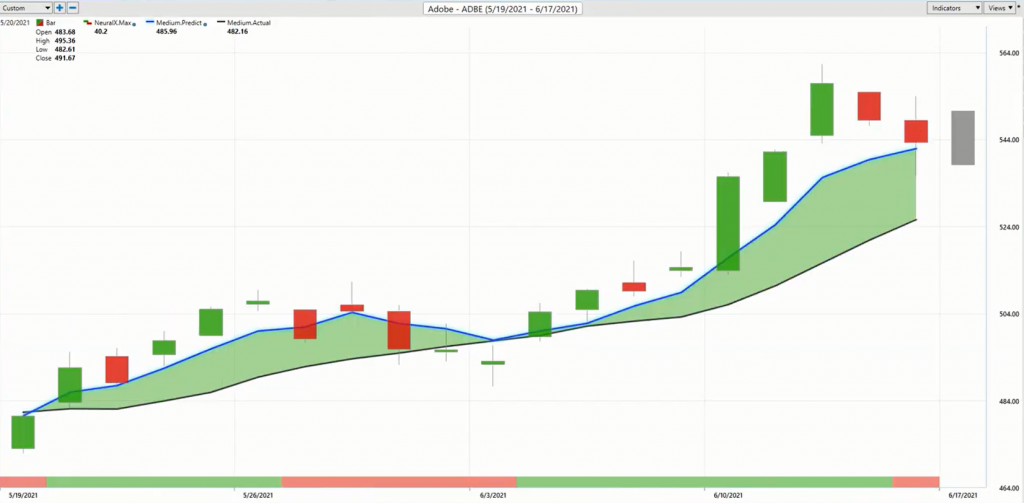
And you see that as long as that blue line is above a black line, you may get periods where the neural index goes bearish. You see here you get this retracement in the market. You’re getting that overall weakness. But the blue line still remains above the black line. Once the short-term forecast gets bullish again, trend resumes and things are really starting to pick up. So again, we can take this approach and say, okay, Adobe, sure it’s going to benefit from the same market relationships that are happening with Zoom and a lot of those other stocks that we’ve highlighted over this period, but it’s going to have its own nuances. And that’s where the daily predicted highs and lows are looking at those relationships that are happening between markets. So what’s going on between Adobe, the ETF groups, these other individual stocks, Dollar, all that, and giving you that roadmap that says, okay, well, we got some volatility here, expect some weakness over the next 48 hours. But blue line still very much above the black line, saying you want to stay long. The overall trend is still to the upside.
Here’s DocuSign. And I’m just kind of drive this home here of all these opportunities that came through that, again, have created a scenario over the past month where it’s been very clear where is VantagePoint telling us to be a buyer. A lot of these markets were coming off of some lows after that sell-off, and it’s just very clear that where are these markets that are going to benefit over this time period. And we just got a whole list of them over the past month here.
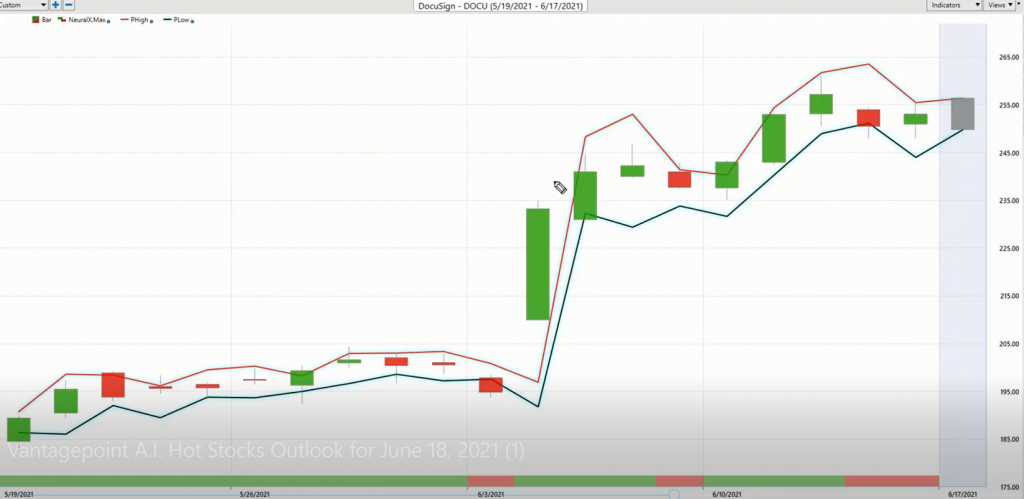
But here’s DocuSign. Very similar situation, where things run sideways for a while here, but where do you want to be accumulating those positions? Well, early on in the trend down here, you see volatility picks up, but the price levels and these predicted highs and lows really do a great job, especially when you have a high volatility day, or news hitting the market, those levels are getting back on track and helping you make the most of that trading opportunity.
You see here, nice entry there. You get picked up at the open in that case, because you’ll gap down. Predicted highs being here. Predicted low here. So you can take these little chunks out of the market, but clearly knowing you’re only going long. You’ve seen the situation change from mid-May, and you’ve seen how these correlations are taking up certain stocks and certain stocks are benefiting over this past month.
Now, here’s Ford Motor. Now, very similar in the 14th where that strength started to come into the market. But you see the difference in the forecast here, right? So you get a couple of blips here where neural index goes bearish, but the overall trend still very much the upside. But look at the forecast. Neural index goes bearish here. So at the very least, it’s telling you expect weaker prices, expect weaker prices, expect weaker prices, at least in the short term.
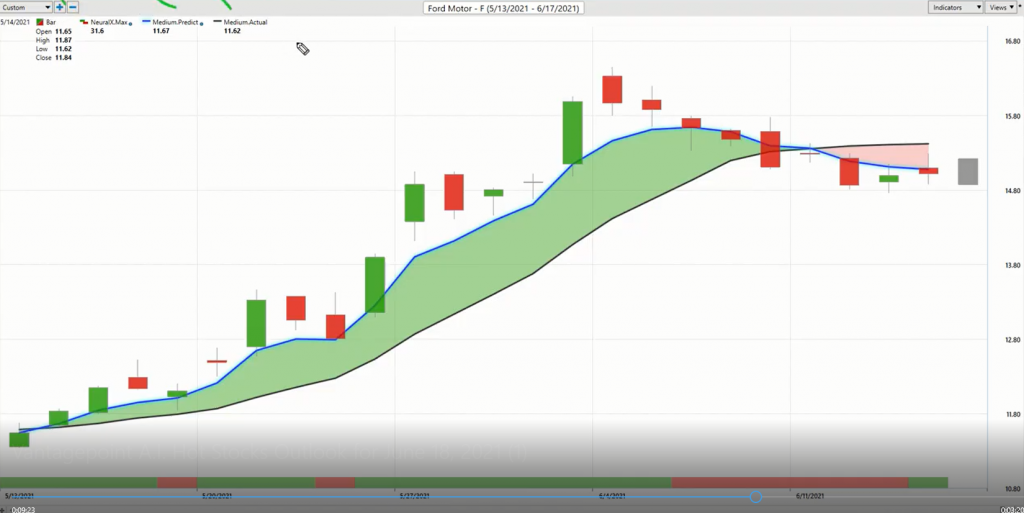
So if you’re long here, hey, expect those cheaper prices. Maybe look to buy at lower price and get a better entry. But then very clearly you see here that this is not like Zoom Video or Adobe or DocuSign. Something shifted here. And the crossover here, you see crossover to the downside. A lot of weakness. No need to participate here anymore. You can stay with your longs and other markets where those trends have continued. But clearly here in Ford, what was an opportunity that started to move higher with all those other stocks in May has shifted here. So it’s sort of like this middle ground of these have moved up, this has moved up but shifted lower. The forecasts are guiding you to make the best trading decisions here.
And then we have these other markets that we looked at last week and said, “If I’m trying to get weakness, if I’m trying to get a hedge on my portfolio, get some shorts into the portfolio, or if I’m looking to just capitalize off of market weakness, if I expect market weakness, what stock would you want to play that in?” Well, we found these relationships going on in the, really, chicken producers here. You got Pilgrim’s Pride and Tyson Foods.
And again, to these correlations, how similar stocks do similar things. And it creates a very simple roadmap of how you want to be positioned. And you can use those short-term tools to help with the management. But very clearly here, here’s an area where we know, look, we know that the market’s turned up in the middle of May. We don’t care when it comes to Pilgrim’s Pride and Tyson foods. Something’s going on here. And so you see that as the dollar picks up volatility and starts to move around, how are these stocks affected.
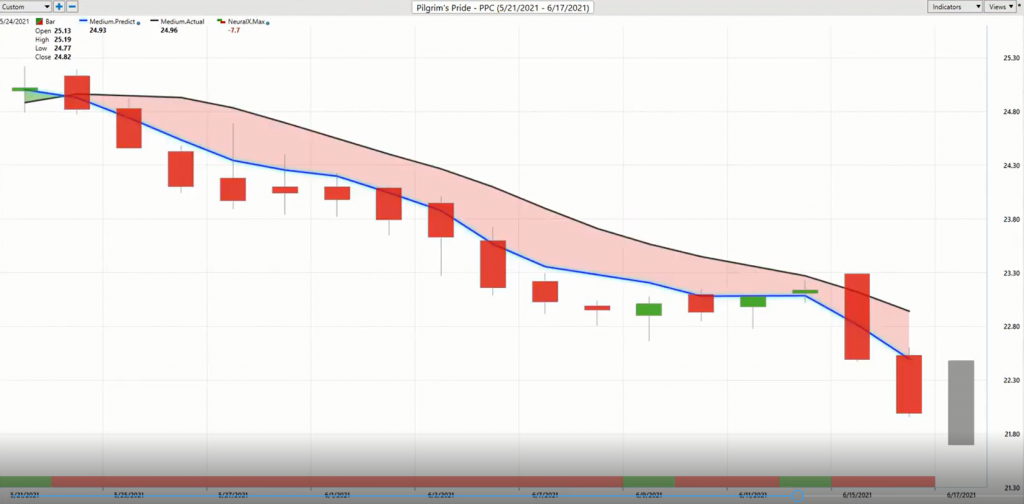
So they get really affected when that dollar starts to move, but this is VantagePoint getting ahead of these moves. This is VantagePoint looking at those global market relationships and knowing that, look, dollar’s starting to weigh. It’s going to affect this stock. But this is forecasting three, four weeks ago, is when you want to go ahead and get involved in this. And of course, really benefit as things start to accelerate. But your entries want to be back here. If you’re trying to get those short positions, you have those crossovers come through, it becomes very clear that this is a market that’s potentially weak. And if anything, you would want to, sure, I mean, there’s no way on earth you’re going to be long here. And so we see things accelerate from last week. And again, from that dollar strength.
So when you go in and trade things like Pilgrim’s Pride and Tyson Foods, and you’re trading all these different stocks, are you really taking into account how things like the Dollar Index, ETF groups, gold prices, oil prices are having an effect on all of those markets that you’re actively trading in every day? So you see shares off about 10%.
Let’s look at Tyson. Do we see a similar pattern playing out here in this area of the marketplace? Again, these crossovers to the downside. Dollar starts to move. And we really see those relationships pick up and crush some of these agricultural stocks. We’ve seen the same thing in a lot of commodities. And this, again, has to do with the dollar and that is affecting your stock trading.
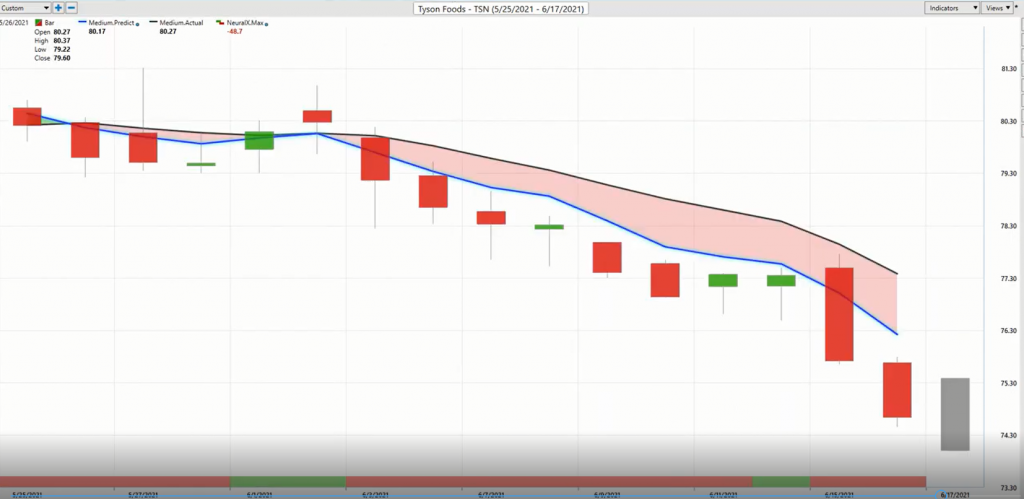
So if you’re not paying attention to currencies, if you’re not paying attention to interest rates, it’s likely leaving you at a disadvantage and having you miss a lot of what’s going on in the market, and making it very easy to identify where’s the strength in the market and where has it started. Is it likely to continue and how should I manage that? And where are these areas to just completely avoid, potentially short, and be making money on the long and the short within that portfolio?
So once again, this has been our Hot Stocks Outlook for June 18th, 2021. Thank you all for watching. Best of luck out there. Thanks again and bye for now.


