


Hot Stocks Outlook for the Week of
June 26, 2020
The Hot Stocks Outlook uses VantagePoint’s market forecasts that are up to 87.4% accurate, demonstrating how traders can improve their timing and direction. In this week’s video, VantagePoint Software reviews forecasts for GrubHub (GRUB) Horizon Pharma (HZNP), Mirati Therapeutics, Duke Energy and Essex Property Trust (ESS)
Register for a Free Live Training
This Week’s Hot Stocks Outlook
Hello once again traders and welcome back to the Hot Stocks Outlook for June 26, 2020.
Hope you’re all having a great week out there, of course, doing well in the financial markets and your trading. And I have a lot of things to cover today. So we’re going to go ahead and start here with Grubhub, a really good example of how these forecasts work day to day. We’ll revisit Horizon Pharma, which we looked at last week. Mirati Therapeutics, Duke Energy, and lastly, Essex Property Trust. So a couple of high yielding stocks here and some pharma stocks.
GrubHub
So starting here with Grubhub, What we have here is daily price action. And this works the same regardless if you’re trading Grubhub or Apple stock or Netflix. But what these daily candles represent is a full and complete trading day.
And you’ll recognize that there is a black line and also a blue line right up against that price data. Now, the black line that you see there, that is a simple moving average or what we refer to as the actual simple moving average. And what that really refers to is just the past 10 close prices added together and then divided by 10. It’s very common technical indicator, and it does give you a good measure of where market prices have been over a given period of time by smoothing out that data. But the problem is that that indicator, that value really just gets dragged around by the most recent price action. It’s always looking at what’s already occurred in the market, and it’s only looking at one market in isolation, that being Grubhub.
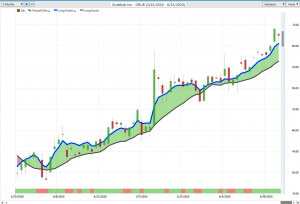
Now, what we want to compare that value to is this blue line that you see against the chart, and that is a proprietary indicator called the predicted moving average. So for that value to be generated and calculated each and every night, VantagePoint is performing what’s called intermarket analysis. And what that means is rather than just plotting prices that have already occurred in one market like Grubhub, VantagePoint is able to look at how other markets are known to influence and drive an effect this target market that you’re trading. So in this example, Grubhub. Now, there’s a wide range of markets that can have very important relationships to the individual stocks or futures market or Forex markets that you want to trade.
That can be things like the broader markets, like the S&P 500 or the NASDAQ. That can be individual stocks or ETF groups that model a large share of the market. That can be global currencies. That can be interest rates. That can be a commodity market. It’s like cattle and wheat and corn. So what’s happening here is all of these inner markets are known to drive and influence and affect the target market that you’re generating a forecast for. And the technology of artificial neural networks then takes that information, weighs those positive correlations, those negative correlations, those leading and lagging relationships, and then actually generates a prediction. So we can think of that as future prices that have not yet occurred yet.
And it takes that prediction and actually builds it into the value of these indicators, turning what was a lagging indicator that just gets dragged around by price into a forward looking predictive tool. Now, that approach of taking those inner markets and forecasting future price is not just found in the predicted moving average. So in this case, when we see that blue line crossing above the black line, it suggests average prices are going to start moving higher. It’s essentially a trend forecast, but we also have this indicator at the bottom where you see this bar, it goes from green to red, back to green. This is also utilizing that predictive technology, but a very short-term strength or weakness forecast. It’s only looking ahead two days at a time, right?
So depending on the forward looking two day forecast, you have a forecast of strength or weakness in the market just over the next 48 hours. And to really round out these forecasts, again, those neural networks are picking out actual predictions for the next day’s high and the next day’s low. So all of this comes together to give you the overall trend direction, short-term strength or weakness, and intraday levels to take positions from. And if we go ahead and we can actually bring up those predicted highs and lows against the actual market data, and we can see how this works. If you understand that, well, I want to only want to be a buyer in this market, well, where should you be looking to take a position? Well, down near that predicted low.
And you can see here that in this example, we have one, two, three, four, five, six, seven, eight, nine entries on the bullish side so far, but this market has moved up really since that first entry all the way back here on the second. You’ve got a move up about 19% in shares of Grubhub. Now, really there’s so many different strategies that one can use for these sort of forecasts. You can be very short-term day trading, buying down at that predicted low, targeting the predicted high. You can be a trend trader who uses those levels to potentially add to your position along the way during a trade, or if you want to trade options.
Horizon Pharma
Knowing when that market is going to start moving higher or lower in price, you can go ahead and set that strike price and then benefit off of the changing market predictions. And that’s really the key is understanding that you may get into a market, but you want to understand, well, what’s likely to occur going forward? Should I stay in this trade, or should I take some profit and get out of the way? We’ve looked over the past couple of weeks at Horizon Pharma, and we were really looking last week at the situation where we had this huge rally up in the market, really huge profit potential there, but we started moving lower here, and then you see those forecast moving to the downside. Now, when we compare it to Humana, Humana was still in a downtrend.
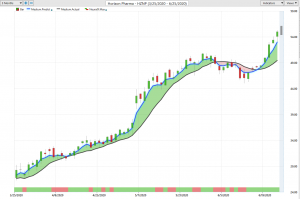
And it seemed like that might actually be a good area to go ahead and short, but we actually saw that Horizon Pharma here going back into an uptrend, suggesting that, well, look, over the past couple of weeks here, it said, look, let’s go ahead and buy. Really I believe it was last week’s forecast. We had a fresh crossover to the upside. We bring in those predicted lows. You see if we come up and look at these levels. We have a predicted low of 4804. The actual low here was 4797, meaning you get picked up at 4804, and you’re off to the races. We had a really nice rally over the last five trading days here and another nice move.
So you want to understand not only where to stay in a position, as long as the trend is continue, but where potentially there may be some trouble and you should get out of the way, but that things are back to the upside. And you see Horizon Pharma up another 13.7% just in the past five trading days. So if you understand that, look, pharmaceuticals look like they’re moving higher, that can also direct you on different trades you may want to look towards. And here we see a Mirati Therapeutics. We can see over the past couple of weeks, Horizon went into its up cycle about right here with that crossover move to the upside, but you see that here’s a stock that was trending up the entire time. And you understand that, look, this looks very strong.
Mirati Therapeutics
We have other stocks that are more recently turning higher over the past five days, but you can come in and say, “Okay, well, let’s use those predicted high and low forecasts to be buying down at these predicted levels.” So in this case, if you have an order waiting, you get filled there, get filled there, filled there, filled there, filled there, maybe filled there. I don’t know if we’re hitting that level, but you see really great intraday levels in a uptrend or an up move. And what is this? About six more entries to the upside and a really nice move here in Mirati Therapeutics here. So if we look at this opportunity over the duration here of about 15%…
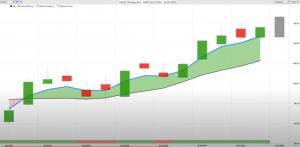
But again, over these last five days where we had Horizon moving higher as well, well, here you see this is the day you’d come in and look to take an order and understand that okay, well, I want to be a buyer down here at this predicted low, about 10560 or so. You get filled right at the open there. And again, last five days seeing about a 12% rally in a lot of these different pharmaceutical stocks. But there is some trouble out there in the market. We’ve seen some places where there’s definitely been weakness over the past two weeks. You see the equity markets just as the index just sort of roll sideways, getting a lot of up moves and down moves, not much direction. But you want to know, okay, well, where should I look to actually exploit the short side if I want to be short?
Duke Energy
Here we have Duke Energy here and really the entirety of the utilities often move in tandem. But you see here, you get this crossover to the downside and same thing. You want to come in on a daily basis and use these updated forecast. So again, you’re getting filled at the open here, filled here, filled here, filled here, filled here. Multiple entries along the way regardless of your trading style or potentially which day you want to get involved. Just make sure that you’re matching that trading style with the predictive forecast that we have available here to make an intelligent decision, right?
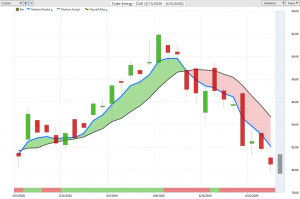
If the market trend is down and you’ve got a predicted high level and you want to be short in that market, should probably have some sort of order waiting up at that level to benefit should price action move up there. And when you have those limit orders waiting, the market just gets filled. You don’t have to watch these things all throughout the day and you’re not chasing around price. You understand where you want to accept price going into the day. And you see here, I moved down about nine and a half percent in a utility stocks. That was a pretty significant move for one of these slower moving, higher yielding sort of stocks here, but certainly not a place to belong. So you understand this entire sector as far as utilities, certainly don’t belong there.
Look towards the pharmaceuticals if you want to go take long positions, but understand that there’s some weakness out there.
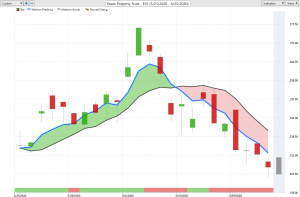
Essex Property Trust
Similarly, Essex Property Trust here, you see this crossover to the downside saying, “Look, property management, high yielding things, potentially go ahead and step aside from some of these areas.” And again, you have that guidance moving forward that’s telling you short up at these predicted highs. You’ll see days like this where you see this range where it looks like it’s somewhat inaccurate, but look what the market’s actually doing. It’s trading down at this predicted low next trading day, whereas it opens right at the predicted high, closes below, and then you see these forecast sort of updating and giving you some good intraday levels here.
If you’re especially a longer term trader who can really just deal with volatility over a couple day period, you understand that orders waiting up at these levels are often the way to go over those 48 hour periods where you may have all of the price action take place in one area of the market. And then that full range sort of explode over a couple day period. But overall here, again, area where you potentially want to be short here. We certainly have a fair bit of markets out there that have started to turn lower. Many of these have been in pretty strong downtrends already, and this is probably where you’re going to see more of that weakness in some of these markets that are already down 10%.
If the markets start moving lower generally, like the broader indexes, these are the places where you want to continue those trades and take advantage of that market weakness. So once again, just a lot of great opportunities out there, but you really want to know not only where to look, but how to manage those opportunities going forward. Things like Horizon here and understand that sometimes you may want to get out of the way. Does your trading style want you sitting around where you’re going to have these big dips in the market that almost any trading on the long side is going to be pretty difficult dealing with things like that, but also recognize when those things shift.
You can find a place in the market that looks strong both from that trending perspective, but also the neural index you see here, very strong through the duration of the past week here. And you’ve seen a really nice rally of 14 and a half percent there just in the past five trading days. So once again, this has been our hot stocks outlook for June 26, 2020. Thank you all for watching.. Best of luck out there and bye for now.


