


Hot Stocks Outlook for the Week of
June 28th, 2019
The Hot Stocks Outlook uses VantagePoint’s market forecasts that are up to 87.4% accurate, demonstrating how traders can improve their timing and direction. In this week’s video, VantagePoint Software reviews forecasts for SPDR S&P Metals and Mining ETF ($XME), Commercial Metals($CMC), Hecla Mining($HL), Caterpillar($CAT), and Public Storage($PSA).
This Week’s Hot Stocks Outlook
Good afternoon, traders. Welcome back to the Hot Stocks Outlook for June 28th, 2019. I hope you’re having an excellent week out there in the financial markets, and as always plenty to cover in this week’s outlook. We’re going to go ahead and revisit some stocks. We’ve got XME here. We’ve had some updated forecasts from that market as well as commercial metals and Hecla Mining, with a lot going on in this space. We’ll also take a look at Caterpillar and Public Storage. There’s a lot going on in the realty XLRE ETF, but we’ll take a look at Public Storage.
SPDR S&P Metals and Mining ETF ($XME)
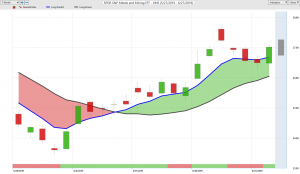
Starting with XME, we have daily price action, so the daily bar is going back throughout June, and against those daily bars you’ll see that there is a black line and also a blue line.
The black line that you see against the chart, is a simple moving average, or just a regular simple moving average. You take the past 10 closed prices, add them all together, and divide by 10. It’s a good barometer of where prices have been in the past.
As a trader, we need to understand where our price is expected to move going forward, in order to get involved with the market at the appropriate time. What we see against that price action, as well as this blue value which has predicted moving average, generated via the artificial intelligence technology found within Vantage Point. What Vantage Point is doing is a very sophisticated type of analysis called Intermarket Analysis, so when it’s forecasting for an ETF such as something like the metal and mining ETF, it’s going to look at a unique set of intermarkets, known to influence and drive this target market. That can be other aluminum and steel stocks, other ETF groups, and other currencies, like the dollar index, Euro; it can be futures markets, including – platinum, palladium, copper, and steel; forecasting how those market relationships are going to affect this target market that you’re trading.
What that technology does is generate future prices. Those future prices that haven’t yet happened are worked into these indicators, so that they then become predictive. Once this blue line crosses above the black line, it’s suggesting that average prices are expected to start moving higher and you’d, therefore, want to set a directional bias really to the upside in this case on XME. In addition to that predicted moving average, the neural networks are also at work, generating this indicator you see at the bottom. This is a very highly accurate indicator, but it’s only looking ahead 48 hours at a time.
Very short term strength or weakness in the market place, and round this out. Those neural networks are also picking out an intraday predicted high and low for you, so you can determine what prices you should be accepting intraday in the marketplace.
And when we take a look at how this all works together, we can understand if you’re going to be getting along the market, where you would be getting in, intraday. You’d looked towards those predicted low values. We’re not going to hit these values every single day, but there’s been plenty of opportunities where you’ve come in and intraday. It has been a fantastic opportunity to build a position, understanding that the trend is to the upside, and you’d only want to be getting long in a market such as this.
XME – last week we took a look at this, and all related stocks within the sector. So far we’ve got a nice opportunity to the upside. The market’s up about 9% in an ETF, and what that does when you recognize opportunities within an ETF; if you want to get a little bit more volatility in a bigger move, you can look towards individual stocks within that ETF.
Commercial Metals ($CMC)
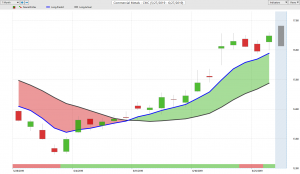
When we look at things like commercial metals here, we have a crossover to the upside. The Neural Index is strong at a one here. We have a little bit of pullback in the marketplace, which gives you a little warning from the Neural Index. There’s a ton of separation between that prediction of where prices are heading, with the lagging moving average telling you where prices have been; letting you know this market is in a strong uptrend. You want to use that guidance from the predicted low to accumulate a position. Short term traders can look towards the predicted high to take some profit. Overall there’s a great opportunity to build a position in a stock such as this. It’s just a nice trade, and as we see this market moving higher, about 21%, it’s almost twice as much as the ETF that it’s included in.
Hecla Mining ($HL)
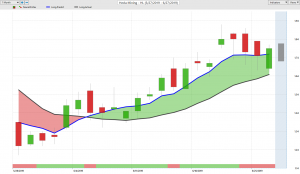
If you’d like to trade some cheaper stocks, it’s the same thing. You’ll start to see similar stocks doing similar things, letting you know there’s a real opportunity here, with an entire sector opening up some nice trades for you. Here again, we see this crossover to the upside. The Neural index up at a one here. There are a couple periods along the way, informing you to expect some weaker price action over the next 48 hour periods. That blue line is strongly above the black line, signaling you to be long here, and take profit on long positions. With the nice entry here at the beginning of the trade, the market is doing very well here. It’s a very cheaply priced stock, with another 23% rally in just the past 16 trading days, in shares of Hecla Mining. You can start accumulating that position.
We see at the predicted low here of a buck 44, the market is up near a $1.80. This is a great opportunity and there are multiple times along the way to add to that position. Understand that you only want to be long in a market like this. So act accordingly, understanding how these indicators work together, essentially generating the entirety of this forecast, which will change and evolve as the market moves forward. You can change and adjust that position as well.
Caterpillar ($CAT)
In shares of Caterpillar there’s a really nice crossover to the upside here. There’s a lot of strength from the Neural Index, suggesting you want to be long here. The blue line is well above the black line, meaning you wouldn’t want to short the market.
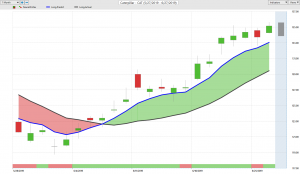
Again, using the guidance from the predicted levels, gives you and update of what’s going on every single day. So, a full market trading day happens. There’s information to be garnered not only from shares of Caterpillar, but also the 35 other related stock ETF futures and currency markets, sharing an important relationship. This generates future price data that’s used to build things like the predicted moving average, as well as, generate the Neural Index, and predicted highs and lows. This allows you to adjust and adapt your position over time. When the market environment has changed, you can either reverse course or take some profits, looking for a new opportunity. But, shares of Caterpillar are up 10% over the past 15 trading days, which speaks to the need to adapt your position.
Public Storage ($PSA)
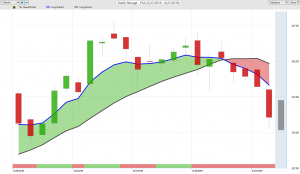
There are interesting things going on in the realty space. Just like the XM ETF, we have the XLRE ETF, which includes companies like Public Storage. There’s a great opportunity going into the month of May, and also much of June, with a strong uptrend.
Over that period it’s clear. What would you want to do? Well, you should utilize the predicted lows, generated by the software, to accumulate a position to the upside. As long as those forecasts are still intact, the predicted lows are excellent levels to go ahead and add to a position. But, what we’ve seen here is some weakness set in. What I really like about the VantagePoint software is the ability to identify areas like XME and commercial metals, getting a great entry, and taking some profit along the way.
We have long positions in the market should things break out. But recognize there are some areas of weakness here. You can create a really nice hedge portfolio if you understanding that this environment has really started to shift.
If you’re going to do anything here, you’ll want to set short positions. Buy some put options after the market prices get up to this level. This can allow you to get a good entry on your put options , along with a great entry to the down side. Shares are declining pretty good here, over the past five trading days. The market’s already off over 4%.
There are great opportunities out there. There haven’t been a huge amount of things shifting around from last week, aside from things like PSA. Some of those realty things look a little shaky. You want to find the good areas to get long, trail your stops, and create a hedge situation. In a week like this one, we may run into significant volatility. There may be some news announcements in trade and G20 Summits. You can take on some positions with really limited risks. This is the idea behind trading, limiting our risk, while opening up the upside.
Once again, this has been our Hot Stocks Outlook for June 28th, 2019.


