


The Hot Stocks Outlook uses VantagePoint’s market forecasts that are up to 87.4% accurate, demonstrating how traders can improve their timing and direction. In this week’s video, VantagePoint Software reviews forecasts for McCormick and Company(MKC), Consolidated Edison(ED), Groupon(GRPN), PlainsAllAmerican (PAA) and Goodyear Tire(GT).
Hello again, traders and welcome back to the Hot Stocks Outlook for March 26, 2021. Hope you’re all having an excellent week out in the financial markets and as always a lot to cover in today’s outlook. So we’ll start out we have shares of McCormick & Company. We also have Consolidated Edison, Groupon, Live Nation, Plains All American, which we looked at last week. And then we’ll end on Goodyear tire and rubber, which we’ve looked at over the past several weeks here.
McCormick and Company (MKC)
So starting out with shares of McCormick & Company, really good example of how all of these forecasts work. And so what we have here is daily price actions. Each one of these candles represents a full and complete trading day. All these indicators work off of end of day data, but what you’ll see against that daily price action you’ll see that there’s a black line and also a blue line right up against the price data there. Now the black line that you see that is a regular simple moving average. So a very common technical indicator. What it does is it looks back over the previous price action, adds all those close prices together and then divides by let’s just call this a 10-day simple moving average. And it’s a good measure to go ahead and smooth out the price data and it gives us an indication of where market prices have been over a given period of time. But obviously as traders we really need to understand is where our market price is moving going forward.
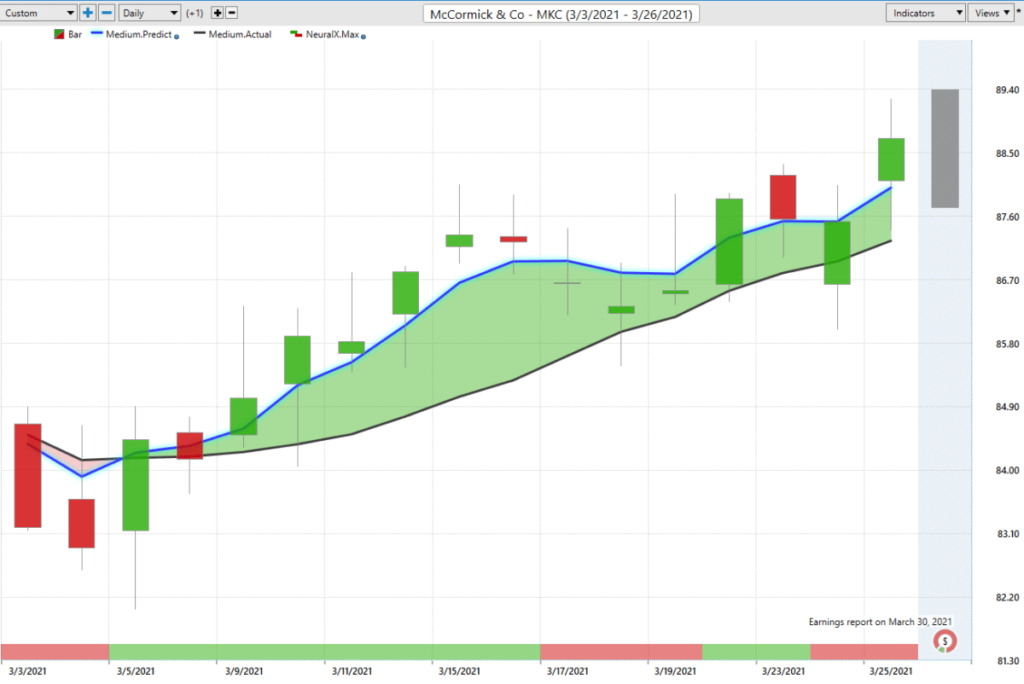
And so what we want to do is compare that black value on the chart to this blue line, which is actually Vantagepoint’s predicted moving average. So what does that mean though as far as a predicted moving average? Well, what it means is Vantagepoint is utilizing its technology to perform what’s called intermarket analysis. So that means that there’s known relationships as far as those neural networks are concerned that affect and drive the future price of McCormick & Company. So that’s going to be things like broad ETF groups. That’s going to be things like the S&P 500 or the Russell 2000 or the NASDAQ. That’s going to be things like global currencies or global interest rates, or futures and commodity markets.
So what it’s able to do is understand those relationships and what’s driving the future price of the target market that you might be trading and it’s actually generating future price predictions of where prices are likely to move, and utilizing those predictions and actually using them to construct these indicators that you see against the charts. So turning what was a lagging tool that’s really only summarizing past data and past closes of what’s already occurred in the market into a forward-looking predictive tool.
So whenever we have this blue line crossing above the black line it’s really suggesting average prices are expected to start moving higher and you therefore would likely look for long positions in the market. Now at the very bottom of the chart you’ll see that we have this bar and it changes from green to red and this as well gets updated, and you get a new signal every single trading day after the close. But this is also utilizing that neural network technology, but only looking ahead two trading days at a time. So it’s very short-term strength or weakness just over the next couple of trading days.
And if you look at the very right-hand side of the chart, you’ll see that there is a really what we call a predicted shadow candle here. And that’s actually a predicted high and a predicted low for the next trading day. So you actually get an overall trend prediction, short-term strength or weakness, and this predicted high and low. And what happens is you have these separate neural networks really doing all of this and looking at these different sorts of timeframes and making the most robust indicator possible.
So what we can do here is look back and say, “Okay, well, how accurate were all of those predicted highs and lows against the price data?” And we see very clearly, look, if you’re looking to get long because of that crossover that you see here not only here, but in a lot of those consumer staple stocks like General Mills, Kellogg, Procter & Gamble. A lot of those that’s where you’re seeing the strength in the marketplace, but you see that you get these levels where you can set limit orders really the day ahead. If you’re more active, you may want to use some shorter-term tools and maybe do some momentum trading and target things like the predicted high. But as far as longer-term levels where you should be looking to if you accept prices, this is going to do a really good job of letting you know, “Okay, well, where do you want to go ahead and get involved?” And then in that short-term intraday timeframe as well where do you potentially want to take profit on the upside on some of these moves?
So again, just wanted to highlight this being one of the more rare areas of the market that are doing well, right? So you can identify that, okay, well, these stocks specifically, this consumer non-cyclical sort of stocks that’s where you can look to do some shorter-term trading on the bullish side that’s where the forecast look quite strong. Same thing with utilities here.
Consolidated Edison (ED)
So here’s Consolidated Edison. Same thing with Duke Energy and a lot of these different utility providers getting a lot of these crossovers to the upside. Again, in the beginning of March here, neural index very bullish. And again, we can take a look at those predicted highs and lows and understand that, “Okay, well, if this is an area where you’re looking to get long, where are you looking to come in at?”
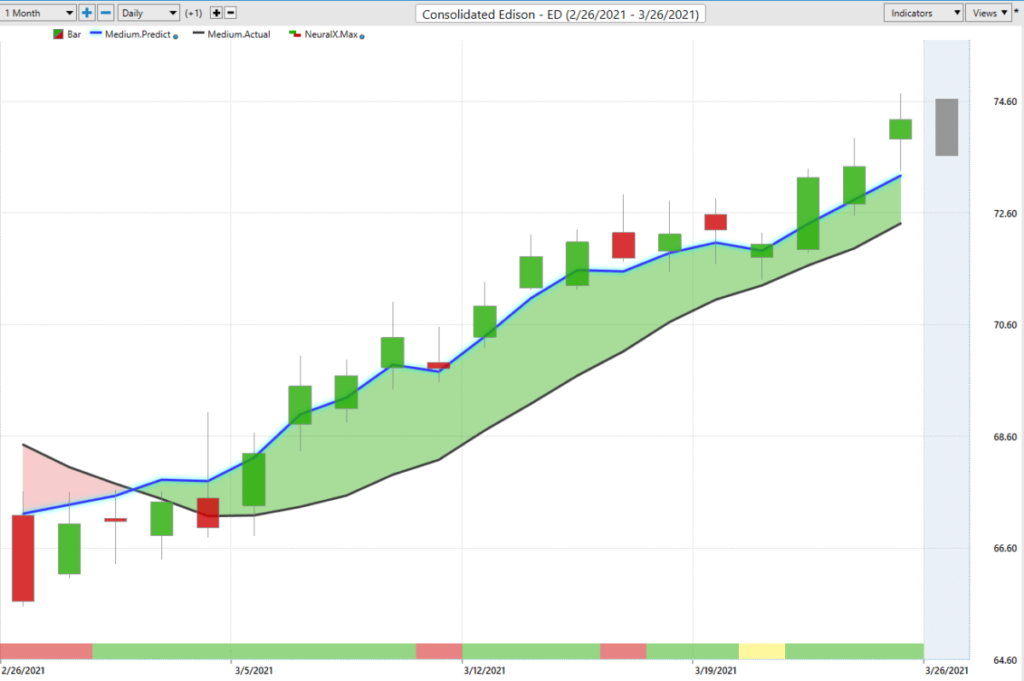
Again, if you’re maybe a shorter-term day trader or a swing trader, where should you be coming in and looking to accept prices. So here in Consolidated Edison, you have about seven entries so far on the way up, but not a huge move in some of these stocks. And again, that’s just because these are more conservative stocks, but that’s where you’re actually seeing strength if you want to be on the long side of the market. Now, if we go over to Groupon and a lot of these just more traditional growth stocks here, these are actually doing quite poorly and you really need to watch out if you’re on the bullish side of the market.` Because we’ve seen a lot of these very important relationships like crude oil. And we see here with Plains All American that turn lower. The overall indexes start to turn lower and that can spell some bad news for stocks.
Groupon (GRPN)
So here with Groupon, you see we have this crossover on the downside, blue line below the black line. You get your neural index, you see it gets bullish here and you’re still getting some sort of sideways price action for the next couple of days, but still that blue line well below the black line and the overall trend is down. You see out of these about nine candles it’s pretty red out of eight out of nine of them as far as that neural index is concerned. And then we can understand, “Okay, well, if we were to come and actually look to take positions here, well, where would we be looking?” Well, towards these predicted highs as far as taking short positions and you see that gets you a really nice entry before this thing really starts to accelerate where we’ve seen, again, more broad based weakness just in stocks and stock indexes generally here.
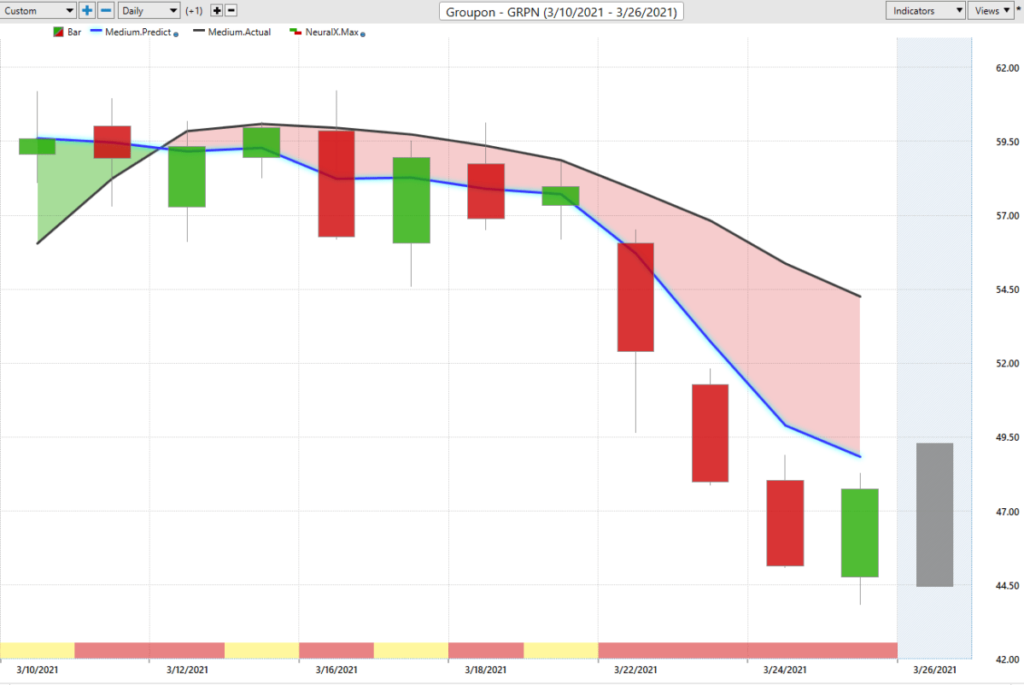
So a really good opportunity to have some areas where you’re short the market and here you see Groupon’s down over 25% and likely a very good place to be should we see that continued weakness inequities, and obviously a lot of distance still going on as far as that overall trend. Here’s Live Nation. Again, this has done very poorly along with the airlines last year when things started to discern lower. Sort of the same thing happening here when you get this crossover to the downside, neural index bearish. You’ll get these periods where neural index gets bullish and you see that from that point on things run sideways, but clearly the trend that blue line is still well below the black line. It’s saying, “Look, you only want to short the market, take profits on shorts.” There may be a couple of days of, of short-term strength in here that you may have to live through, but overall saying, “Look, here’s some nice entries to get involved in this market.” And obviously things really accelerating to the downside more recently.
So we can say of the overall move so far, really just from that entry about 8% you could have potentially gotten a little earlier as that crossover comes through back here. But again, there’s plenty of these areas in the market that have turned lower.
Plains All American (PAA)
And specifically we looked last week at Plains All American because we see weakness in crude oil, the commodity itself and that’s usually is going to spell some trouble for energy stocks. And again, you have to understand what’s happening there. Well, it’s those intermarket relationships, right? It’s understanding what’s going on in oil and gas ETFs. So understand what’s going on in oil, the futures in commodity markets.
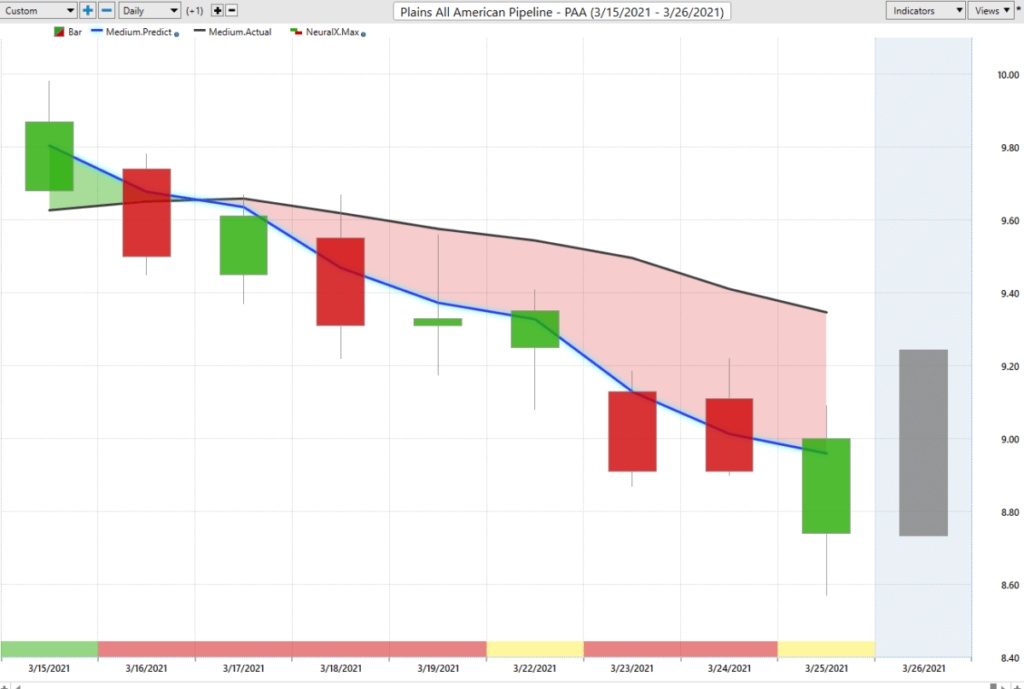
Last week, we looked at some of the gold mining stocks have started to turn up. Well, that’s because gold is starting to firm up as well as all of those mining companies have actually done fairly well. Not all of them, but most of them seem to be going into uptrends and have performed well over this period where things like Groupon and Live Nation are aggressively moving lower, but here’s Plains All American. We had this crossover. We actually looked right as this crossover came through and you see this next trading day really being the main day that you’re saying, “Okay, well, if you want to get short as a trend trader or get involved in this move as far as that energy weakness, well, where might you do that?”
You see at least in this stock closely linked to energy prices, you’re getting a lot of good entries and even days like this actually work out really well if you have a limit order at the predicted high. Well, you’re just going to get filled at the open and you see immediately closing in that range and then more weakness still forecasted here. So a really nice opportunity again to get some positions on the short side here potentially if we see more weakness, those markets are going to perform very well and pretty much at the point where you could lock in stops at breakeven trail things and see what we get out of this.
So shares off here a little bit over 7%, almost 8%. It’s just in the past five trading days here. So things can really accelerate and we’ve seen quite a bit of volatility in just stocks generally, whether moving up or down.
Goodyear Tire (GT)
Here’s Goodyear Tire. So really nice opportunity here. We highlighted this move really towards the beginning of this upcycle here. And you see that that lasted up until very recently. You see that crossover coming to the downside, neural index getting bearish. But very clearly here we say, “Okay, well, if you want to really keep your gains and make sure that you’re getting out of the market at the right time, this can be very helpful.”
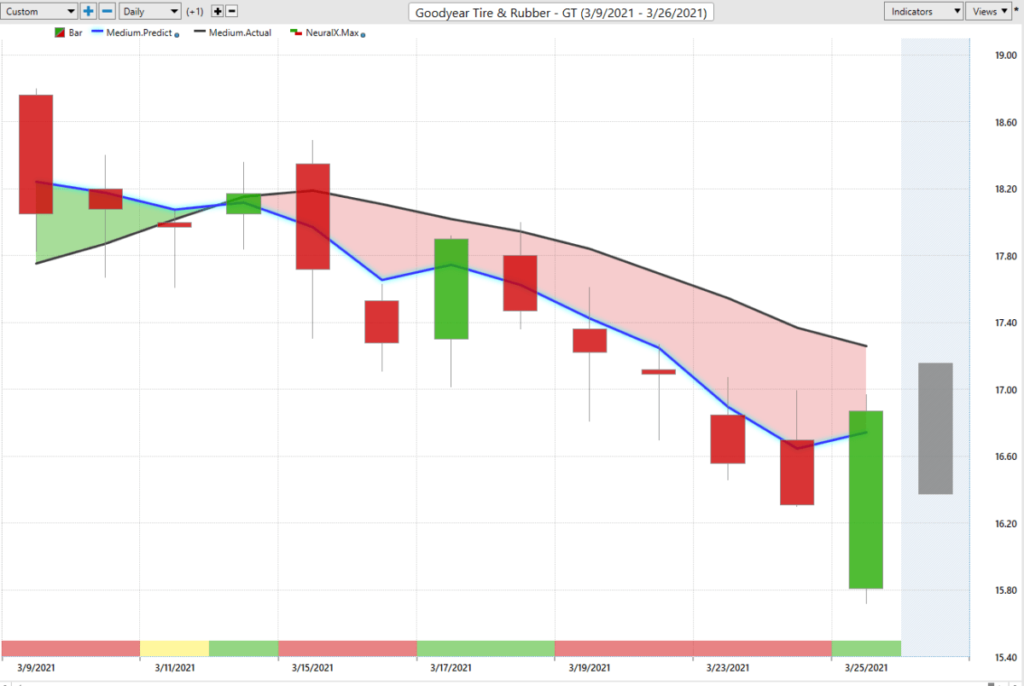
So we got a nice move, higher shares up about 55% in about 26 trading days. But very clearly you see this blue line crossing below the black line indicating that, “Okay, well, if you want to take profit on your longs, now it’s time to do it or get short.” It’s really highlighting this is the day to potentially do that. And more specifically we can look at, “Okay, well, what’s the predicted high forecasted for that day?” So as the market moves up towards that high of 1839 in this case, well, let’s see the predicted high 1839, the market actually hit 1849. But when the market’s at that level, it’s screaming at you that get out of your long positions. If anything goes short, that’s really where the main pivot is coming through and saying, “Change that directional behavior.” And if anything, look to take profit on logs, if not, just go ahead and short the market.
So you see that from that point, we’ve obviously gotten a nice decline and potentially further declines as we see this still very bearish as far as the overall trend and the neural index there. So shares off about 10.7% in just the past eight trading days after being up over 55% the previous 26. So just again, good opportunities here all throughout the market, but something definitely has shifted over the past couple of weeks. You saw the NASDAQ sell off a few weeks ago. It hasn’t recovered enough.
The other index is doing well and moving higher, but there’s still a lot of problems out there and a lot of warning signs coming from the Vantagepoint software as far as being on the long side of the market and not having some at least some hedges in some short positions in the portfolio to benefit as these things start to decline. So once again, that has been our Hot Stocks Outlook for March 26, 2021. Thank you all for watching, best of luck and bye for now.


