


Register for a Free Live Training
The Hot Stocks Outlook uses VantagePoint’s market forecasts that are up to 87.4% accurate, demonstrating how traders can improve their timing and direction. In this week’s video, VantagePoint Software reviews forecasts for SPDR SPY($SPY), Bunge ($BG), AMD ($AMD), Archer Daniels Midland ($ADM), Exxon Mobil ($XOM), Freeport-McMoran ($FCX), McCormick and Company ($MKC)
SPDR SPY ETF ($SPY)
Hello again, traders, and welcome back to the Hot Stocks Outlook for March 29th, 2024. I hope you all are having an excellent week out there in the financial markets. As always, we’re going to take a look at some of the most recent VantagePoint predictive forecasts. So, if you haven’t already, make sure you go ahead and click on that link in the description below, and you can get yourself a live demonstration so you can learn all the specifics of this technology and how it can help you make much better trading decisions in the marketplace.
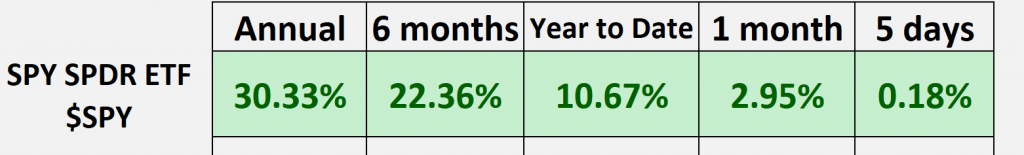
Now, each week, what we do is we like to take a look at the broader SPDR ETF SPY ($SPY) markets here through the Spy ETF. And so, when we look at some of these broader periods of time, well, we can see that year to date, we’re up almost about 11%, which is really phenomenal for the first quarter of the year. But, things are starting to shift around, and this is very important to be situated in the right assets to make sure that your portfolio does well. And so, there’s really good examples here of how the predictive forecast within VantagePoint can really direct that attention through the forecast but also through features like VantagePoints and IntelliScan that really pinpoint these things as they’re occurring.
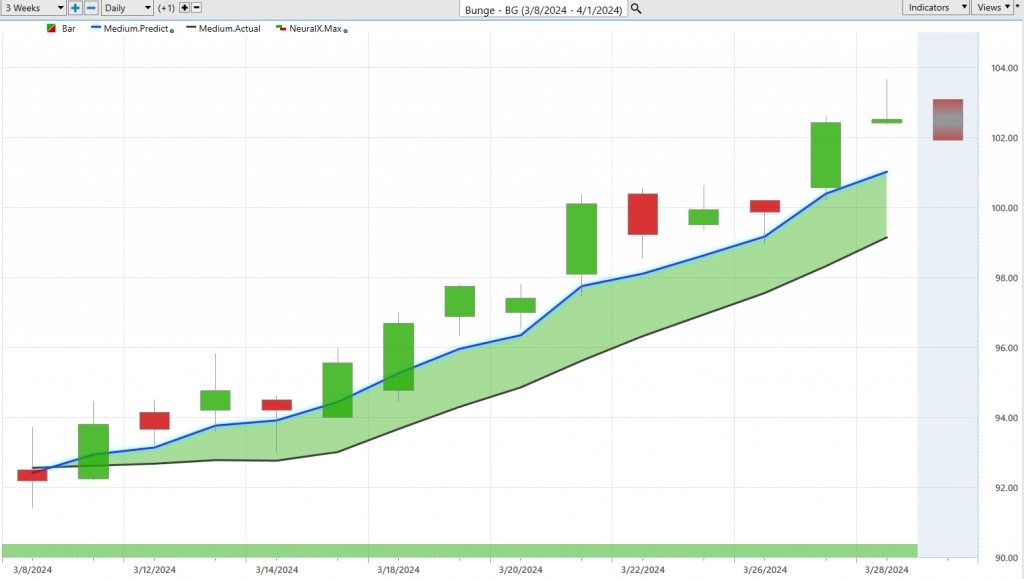
So, what we have here with Bunge ($BU) – a stock we’ve looked at really repeatedly over the past few weeks here – is daily price action. So, each one of these candles that we’re seeing is representing a full and complete trading day, and it’s right up against all that price data. There’s a black line and a blue line value there. Now, the black line value that you’re seeing there is a simple moving average, or what we call the actual simple moving average. This is a very common technical indicator, and in this case, it’s a 10-period simple moving average. So, it takes the last 10-period closes, adds them all together, and divides by 10. A lot of technical indicators work like this, but the real weakness is that all of their data just comes from the past, and that’s really only one weakness because the other weakness is they only look at one market in isolation. So, they’re not looking at how the broader indices, other ETF groups, and other related stocks are affecting the future price action of the market that you’re trading.
And so, what we want to do is compare that 10-period simple moving average, what we really think of it as a baseline, to this proprietary predicted moving average. And for this number, essentially a prediction of price to be plotted and calculated on the chart every evening, well, this is where that technology comes in. It’s performing what we would call intermarket analysis. And so, rather than just looking at the solitary information from one market – in this case, Bunge – and looking at that in a rearward way, you know, all this has already occurred, well, what we have is these neural networks that are able to look at intermarket relationships that are known to drive and affect the future price of Bunge. And so, this is where we look at ETF groups. This can be individual stocks, but this can be things all the way down to the Commodities and Futures markets, whether that be gold, agricultural stocks are certainly affected by some of these, you know, fertilizer companies, as well as things like the dollar index, currencies, global interest rates. So, it takes this global approach to generate these highly accurate predictive forecasts.
But we have these different indicators to solve these different problems. And so, whenever that blue line, our predicted moving average, crosses above the black line, what’s suggesting is average prices are going to start moving higher. And so, this is a market we’ve brought through over the past couple of weeks here because we got these fresh crossovers. And understand that this is an area of the market where really the attention should go. And so, in addition to that predicted moving average, at the very bottom of the chart here, you see this bar, really this green bar, that in some instances will go from green to red and back to green. In this case, it’s completely green. And what this indicator is tuned to do is solve a really short-term problem of short-term strength or weakness over the next 48 hours. So, we can think of that as 48 hours, you can think of it as a couple of candles, but again, very, very short-term. And then, it’s going to react in the short term, letting you know what’s likely to occur. Lastly, and what we really look at very closely each week, are these predicted ranges. So, we have a predicted high and predicted low range, so literally, intraday predictions of where price is expected to trade. And so, when we go and actually look at these predictions against the actual market data, what we’ve understood from, again, even previous sessions, is Bunge in an uptrend. Well, where might we want to look to accumulate a position?
You see, just this past week, this being actually last Friday here, market moves down towards the predicted low, and look how it closes pretty much right on that predicted low. Next day, moving to the predicted high, then we come into what would have been Tuesday here, and again, clipping on that predicted low and accelerating higher. So, this market loan, just in the past week, and actually, if you wanted to go ahead and take some profits there on Thursday, this is a very nice swing in the market, with an S&P that’s pretty much gone flat nowhere. Here, you see about a 4% advance in shares of Bunge, so really nice move there, and a good example of how this works: identifying an opportunity and then exploiting that with the help of these short-term predictive indicators.
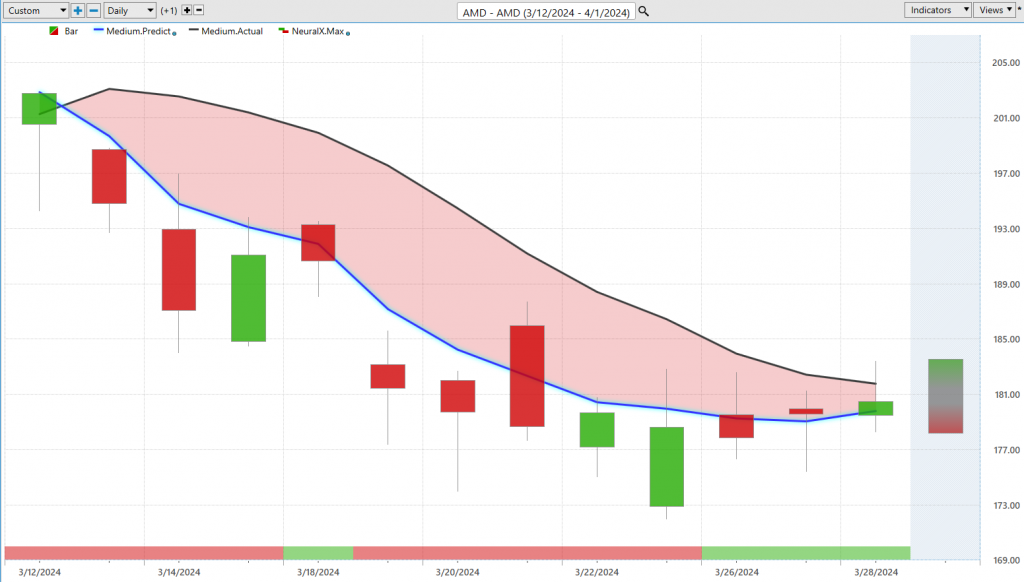
Now, we also looked at AMD, and while some of these tech stocks have done extremely well, well, it’s all about the timing here. And so, with AMD, we have this blue line crossing below the black line, you see the neural index maintaining really a bearish position most of the time. You have a blip here where it gets bullish, and then it turns green once again, but the overall trend is not bullish. So, while we do get a couple of days of strength, and we can, of course, look at those predicted highs and lows, we’re not in an uptrend. And so, for the past week, this really hasn’t been a great place to position the portfolio. But look how these short-term predictive indicators perform, letting you know where, even if you’re that short-term, whether you want to take profit (although explained why the bullish side might not be the best opportunity here) but also setting shorts. So, if you’ve made some money on the short side, you can reestablish those positions at even better prices and trail your stops, and go into next week with really a hedged portfolio, and potentially a lot of nice opportunities as we see some weakness coming into broadly stocks, but not coming into some of these, you know, agricultural, fertilizer, energy stocks.
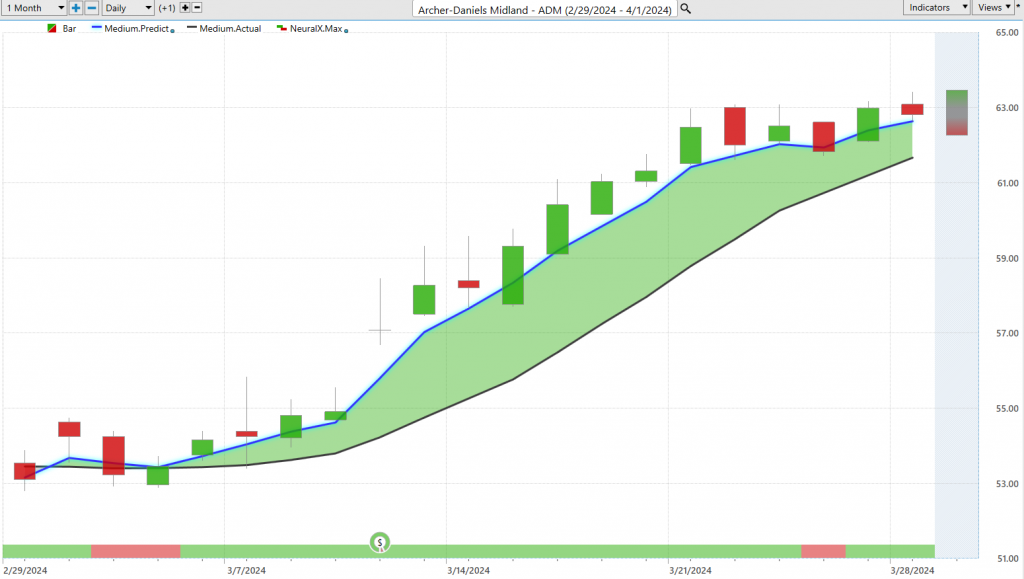
So, here’s Archer-Daniels-Midland, and this is another one that had really suffered previously from sort of news-driven events. But the recent forecast, you see its blue line above the black line, neural index bullish coming in here. And so, this is a great example here: neural index goes bearish, you get a little bit of a dip, but that blue line remains above the black line and suggesting that, look, you want to keep exploiting the bullish side of the market. And I love seeing things like this, is when we get those bullish crossovers, the market has this froth, right? So, if we look at these previous predicted lows, you see the market shoots down essentially to that level, and then you’re off to the races. And these predicted low, predicted low, predicted low, predicted low, not quite there, um, but again, many opportunities to buy at the lower part of this range and exploit this bullish trend. And so, here with Archer-Daniels-Midland, we have a really nice move here, and again, at this point in the trade, you’re up 17.7% over the past 20 trading days. You can trail your stops, and again, have these really nice additions into the overall portfolio.
And so, really identifying these shifts, well, it gets really easy with the use of VantagePoints and IntelliScan features. So, I can open this up really quickly, and you see what we have is really a collection of these predictive indicators that can be sorted, whether you want to sort by, you know, stock sector, particular markets, we can, again, sort those predictive moving average crossovers, neural index, and really fine-tune how to identify these important shifts in the marketplace.
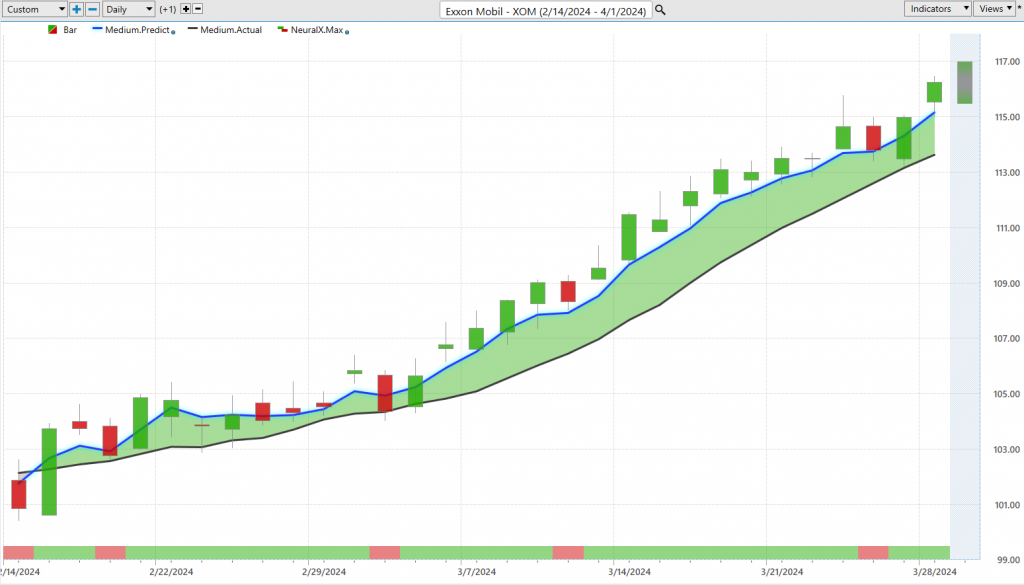
So, as we move forward, we can look at ExxonMobil, and again, energy has really been a place where you want your attention. And we saw, really, actually on Thursday here before we got our holiday here on Friday, a nice advance in energy. I mean, the oil market, you know, specifically here. So, when we think about producing a forecast for ExxonMobil, well, that’s going to be one of those intermarket relationships, is crude oil itself. And obviously, being able to derive some price clues from the commodity market is really going to help you when you have to get into trading the individual stock. So, here in ExxonMobil, we see, you know, maybe a really nice position to have going into the next month here, a 13 and a half percent rally in the past 30 trading days. You got about a 133% cushion with a really nice position going into the second quarter here. And again, we can look at predicted highs and lows, so you have this guidance moving forward that says, look, accumulate a position early, right down here at, you know, $103, and again, you see one of these sort of trading days where you get a little bit of froth, gap up, gap down to the predicted low, and you are off to the races once again. Even this past week, this pullback, you see coming in on a Tuesday, before the markets are ready to advance once again, it’s about a 2% move, just from, you know, Tuesday afternoon here. So, really nice opportunities there.
And if you trade commodities, you know, it’s the same thing: you’re able to identify this very bullish forecast in the oil market and the energy sector as well.
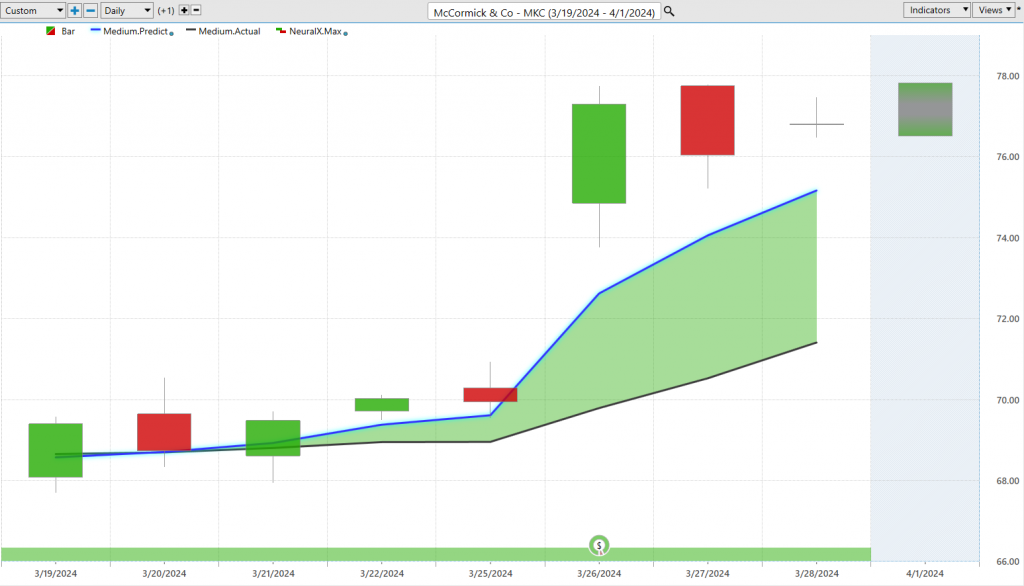
McCormick & Company, here’s McCormick, this being a little bit more short term and having the catalyst of earnings around this. But I wanted to highlight that, even despite all that noise around earnings, with the neural networks and predictive technology doesn’t know that earnings are on the calendar. So, as a trader, you want to factor that in, you know, be prepared for these sorts of catalysts where you may get a lot of volatility in the market. But let’s look at every single forecast outside of earnings. Well, you see that the blue line gets above the black line, neural index is bullish through this entire period, and again, those predicted highs and lows, well, look how effective this is, pretty much perfectly pinned that predicted low there, another trading day here, and again, a great entry to have as this market potentially goes into earnings, giving you really a healthy amount of cushion to take on that volatility. And then, even after the earnings, look how quickly the software adapts and says, look, okay, well, prepare for these predicted high and low ranges to, you know, move around a lot, right? You have a much bigger range here because of all this volatility coming in, but look at that predicted low. I mean, pretty much pins it perfectly, even after a huge advance, and again, a nice position to have in the portfolio as we move into another month and another quarter.
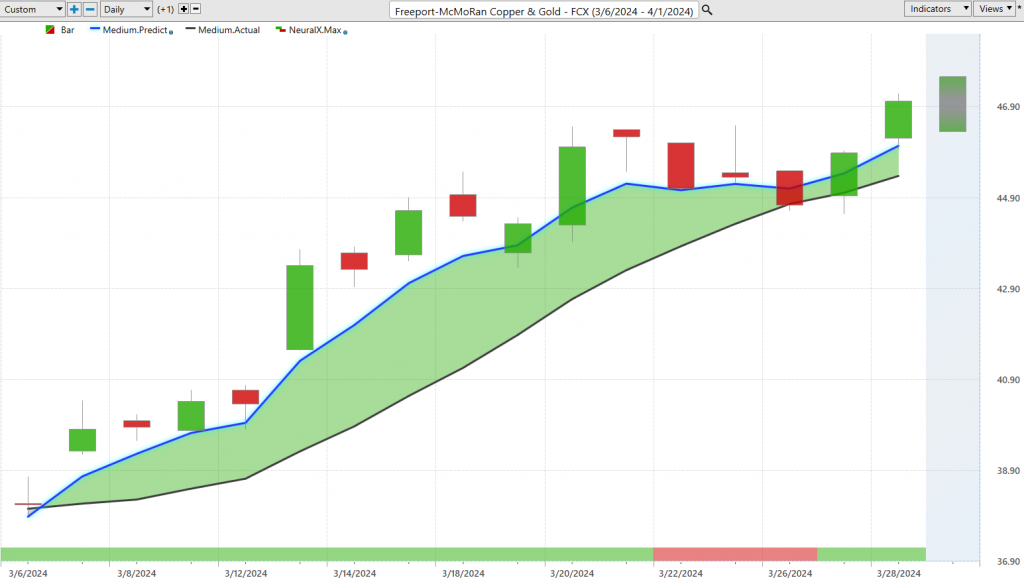
Lastly, here we have Freeport-McMoran Copper & Gold, Freeport, and we’ve seen, again, metal markets do extremely well. Gold has been advancing repeatedly. We looked at the GLD charts just a couple of weeks ago, offering a very similar opportunity to identify the trend shift, get a nice entry with the help of those predicted highs and lows, and I even mentioned, just trail your stops here. You got a really nice entry, gold’s moving, we do have a lot of this geopolitical, macro risk that, you know, even outside of stocks, gives you exposure to some really exciting places throughout the market.
So, here’s Freeport, again, this predicted low here, but more recently here, you see a gap down to the predicted low, a couple of days just this past week where we come into those predicted lows and advance, going through the end of the week. So, very clearly seeing a theme here as far as the type of opportunities, many of these things really commodity-driven. We even looked at DBC, the commodity ETF, a couple of weeks ago, but you’re seeing some really exciting moves, almost a 20% move in just the past 16 trading days here in Freeport.
So, we’ll go ahead and leave it there, but once again, this has been our Hot Stocks Outlook for March 29th, 2024. Thank you all for watching, best of luck out there, and bye for now.


