
Register for a Free Live Training
The Hot Stocks Outlook uses VantagePoint’s market forecasts that are up to 87.4% accurate, demonstrating how traders can improve their timing and direction. In this week’s video, VantagePoint Software reviews forecasts for SPDR SPY($SPY), QUEST ($DGX), Kellogg ($K), GAP ($GPS), Darden Restaurants ($DRI), Henry Schein ($HSIC) and Ford Motor ($F),
SPDR SPY ETF ($SPY)
Hello again, Traders, and welcome back to the Hot Stocks Outlook for November 10th, 2023. I hope you all are having an excellent week out there in the financial markets. As always, we’ve got plenty to cover here as we update the predictive forecast generated by VantagePoint. We’ll really highlight how these tools can help Traders day in and day out in the marketplace.
Now, if you haven’t already, make sure you go ahead and click on the link in the description below, and you can get that live demonstration. Really learn how these technologies and tools can help you out.
SPDR SPY ETF ($SPY)
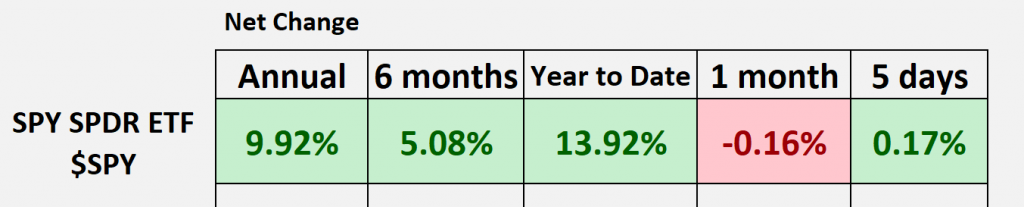
As you navigate the financial markets, now, as we typically do, we’re going to look at the Spy ETF to get a sense of the broader markets in the S&P 500. And so what we can see is, if we go back 12 months, we’re up about 10%. Year-to-date, still up about 14%, so not bad. But we’ve really had some trouble here over the last month. We had a really nice rally a couple of weeks ago. Vantage Point forecast did a really great job of getting in front of that, but this week’s been pretty boring as things run sideways, and there really hasn’t been a lot of movement and volatility across the broader markets. And this is why it’s especially important to have the right tools if you are trading individual stocks or individual shares or even Commodities Futures markets to really get the best out of each opportunity that arises here.
So, we’re going to take a look. We’ll start out, we got shares of Kellogg, Gap, Darden Restaurants, Quest Diagnostics, Harry Schein, and Ford Motor here. And so, really good examples of how all of these predictive indicators work and how it can really focus the attention.
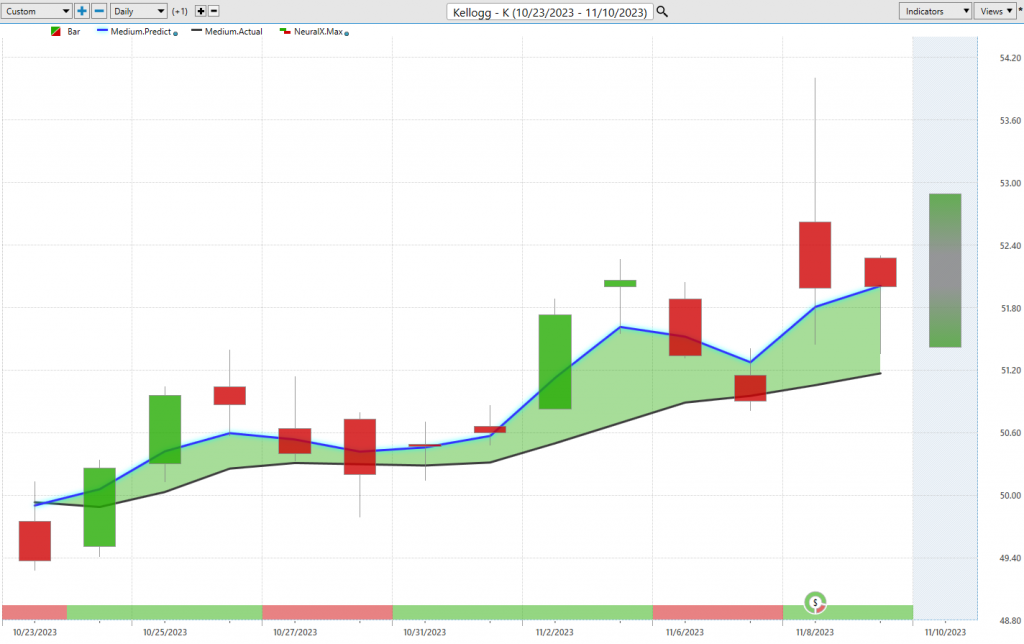
And so, one of the things I just want to highlight is that actually Kellogg ($K), Consumer Staples, have seen some support and strength here. And so we look at the forecast for Kellogg, what we can see is, what this is, is daily price action right. So each one of these candles is representing a full and complete trading day. And what’s right up against that price data is you’re going to notice that there is a black line value and also a blue line value. Now, that black line that you’re seeing on the chart, that is a simple moving average, we refer to it as the actual simple moving average, the actual average. In this case, it’s just a 10-period simple moving average. And what that does is look back at the previous closes, it’ll add those all together and then divide by 10. And what that really works as for us is a baseline. It’s a rearward-looking indicator; it’s only generated via that data from the past, but it gives us a good idea of where market prices have already been. This is just set in stone, a 10-period moving average; we can really smooth out that data. But obviously, Traders need to be ahead of that next move in the marketplace. And so what we want to compare that to of where prices have been is where prices are going.
And so to do this, what we’re utilizing is this is Vantage Point’s proprietary predicted moving average. So for this number, essentially, this price prediction to get calculated and plotted on the chart every evening. Well, that’s where the technology of artificial neural networks is performing their techniques. And what they’re doing is what we call intermarket analysis. So what’s important is to know that there are really dozens of markets that are known to drive and influence the future price of shares of Kellogg. And this can be very important; things like the Spy that we just looked at, right? There’s heavy correlations with certain stocks and the S&P 500. But this goes all the way down to things like the dollar Index, which has been critical for equity and risk on coming in and out of the market. You’ve got ETF groups that are going to gobble up a whole bunch of sectors and shares within the market, and those are going to share some important correlations like the, you know, technology ETF or financial ETF. But it goes all the way down to these relationships and individual stocks, individual shares, individual stocks. It also looks at Commodities like gold, oil, you know, in the Futures markets. And this is what Traders often aren’t doing and leaves them at a huge disadvantage. And when you have a tool that’s able to analyze all of these relationships and very accurately predict future price action, well, what we can do is take those predictions and actually build those price predictions into these indicators. So, what turns what we’re really lagging tools that are always getting dragged around by the market, well, it turns them into forward-looking predictive tools with a huge amount of lead time, really taking out the lag time associated with traditional technical analysis.
So, whenever we see this blue line cross above the black line again, it’s suggesting average prices are going to move higher. But we also utilize that technology here at the bottom of the chart. You see this bar that goes from green to red back to green. And this is utilizing the technology of artificial neural networks, but it’s tuned to solve a different problem, a very short-term problem of short-term strength or weakness in the market.
And as we go through these subsequent charts, what you’re going to notice is, at the end of the day, you’ll get this forecast, and it’s telling you there’s weakness over the next couple of trading days. But the blue line is still above the black line, the trend is still up. You see it again here; we get a little bit of a gap down and some volatility. But the overall trend is still up. And so, as we go through these forecasts, what we do every week is just look at how accurate all of these predictions for even things like our predicted high and low. So, you’re getting a predicted range every day before the trading day occurs. And so what happens is, we’re going to get a candle that’s going to fill in here once the day is complete, and we’ll see how accurate this prediction of the high and the low has been.
But what we see here is that once we get that crossover to the upside, it’s warning that look down towards these predicted lows to be a buyer. That’s where there’s exceptional entries; that’s where you’ll get an edge if you want to be on the long side of this Market. Again, here you have to buy on the low of the day to benefit as that trend resumes. And this is where Vantage Point really gets ahead of this stuff and helps Traders make much better trading decisions.
So, here we see the Market’s up about 4 and a half percent; you know, this is Kellogg and really across this consumer staple space, we’ve seen more strength. We look at the ETF; you’ve seen strength there.
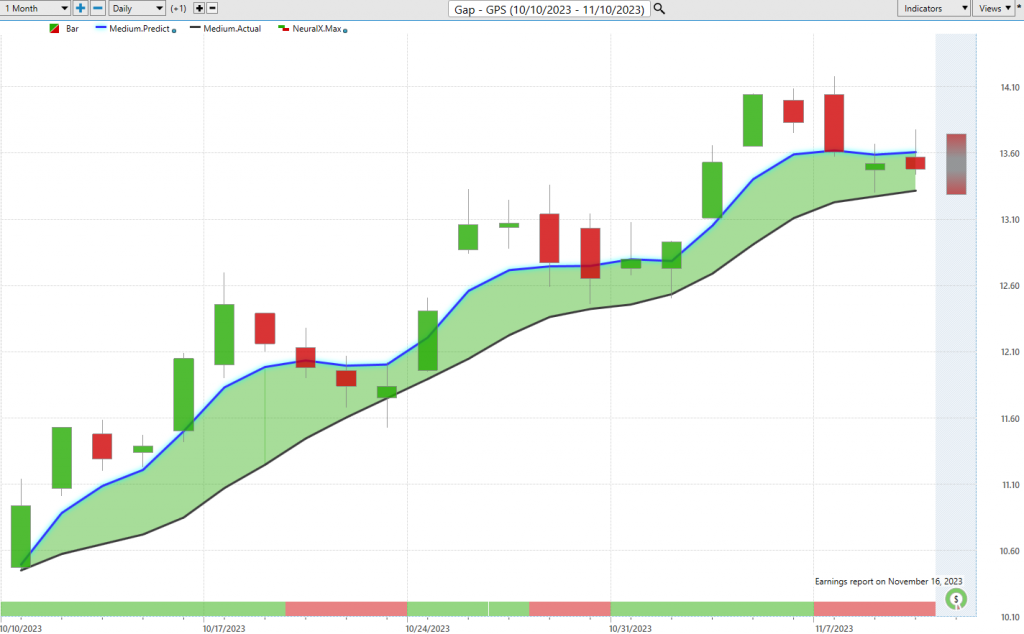
Shares of Gap ($GPS), Gap, another good example of a stock doing really well. Blue Line crossing above the black line in this
case. This has been going on for a while, right? So, if you’re looking for markets to be a bull in or potentially trade on the bullish side here, we see since really the early point in October, we get that blue line crossover to the upside saying the overall trend is up here. But you’ll notice that again, you get these little blips, very short term, and that neural index will go back to green, and you see the trend and that momentum resumes in the market here. Currently, getting a few days of weakness as well and seeing prices run sideways. But what you need is the ability to say, okay, well, what is my time frame? What am I really going for here?
And as a day trader, you can see these predicted highs and lows work excellently. If you’re getting entries down here, you see how that’s really a solid entry for the past couple of weeks. Right, you don’t want to be chasing this market and getting in, you know, inferior fills. Instead, use the technology to say, okay, where’s the best price to go ahead and accumulate a position. You see again here; we get some weakness over the next couple of days, but you’re getting an excellent entry in the overall daily range if you want to participate once you identify that, okay, well, this Market’s in an uptrend; you’d only want to be going long and taking profit on those long positions. So here we see Gap up about 26% here in the last 23 trading days. And again, if you’re a shorter-term Trader, you may come in each week with just using those shorter-term tools, just your predicted highs and lows, things like the 48-hour neural index and making decisions off of that indicator really linked to that time frame.
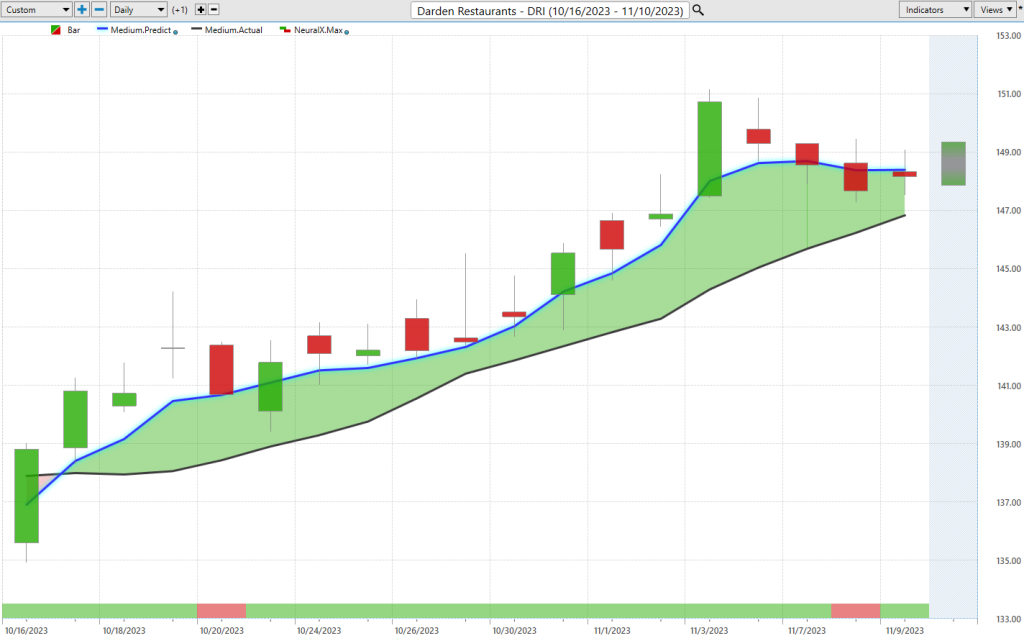
Here’s Darden again, another great example of you really want to identify those stocks that have that support and are doing well, right, where that blue line is solidly above the black line, where that neural index is bullish. You’ve seen here; you see get a couple blips where the neural index goes bearish, and what happens the next day? You get a gap down, but the trend is up. Again, here, we’re getting a little weakness over the next trading Day from the neural index might move down to some predicted lows, but the trend here still very much up. And we see shares of Darden again over 18 Trading days now moving up about 65%. So again, if you want to be a shorter-term Trader and take pieces out of the market, well, where would you want to be looking? Well, down here towards these predicted lows would offer better areas to accumulate a position and try to Target some of those upside forecasts that have come through, some of those upside levels from Vantage Point like the VantagePoint predicted highs.
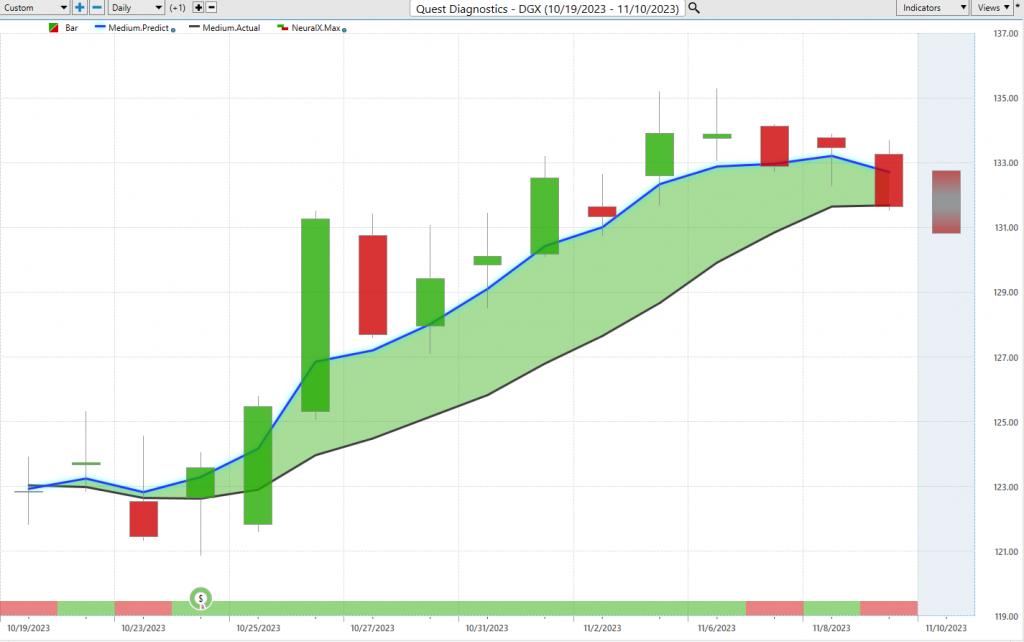
Quest Diagnostics ($DGX), we’ve looked at really for several weeks, shortly after this crossover came through to the bullish side. And we’ve gotten this nice move. But again, a good example of a lot of strength and momentum from the neural index. Well, now you’re seeing that neural index get weak here. So, indicating some very short term, over the next 48 hours, expect the market price to go lower. And so over the past couple of weeks, we’ve got a nice rally here in shares of Quest Diagnostics, about an 8% move. But of course, we can look at those very short-term predicted highs and lows and understand that, okay, well, when that neural index is bullish, yeah, you want to be buying at these predicted lows, targeting the predicted highs, and taking those pieces out of the market. Now, that neural index goes bearish; you know, expect market prices to decline and go lower; you may want to get out of the way and be looking for some lower prices.
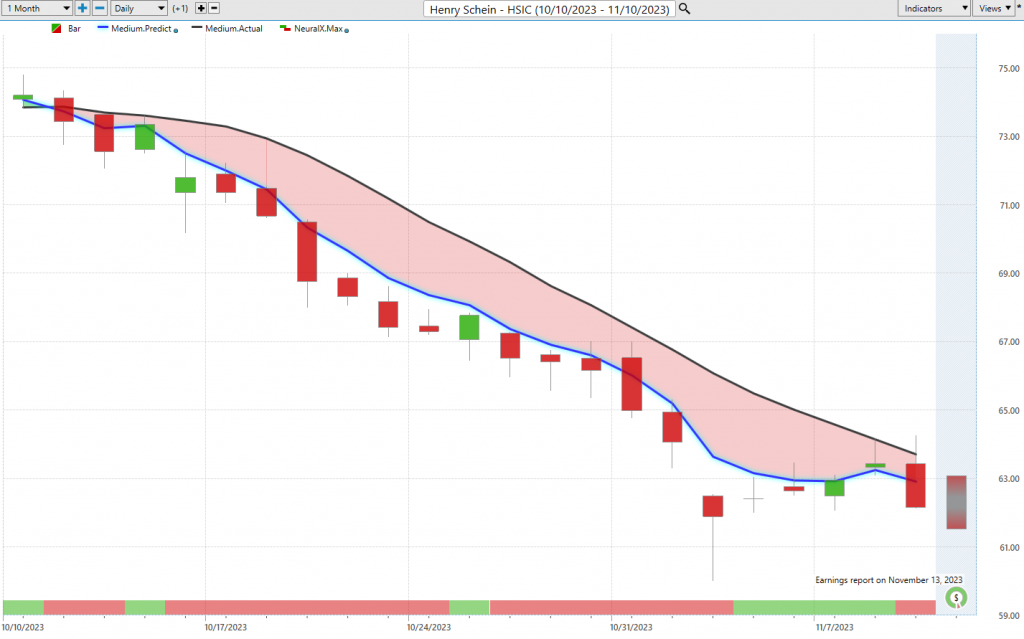
Henry Schein ($HSIC), here um HSIC, I believe these make, like, you know, Dental products and things like this, um, but here with HSIC and Ford here, there is some weakness in the market. And this is where as a Trader, if you want to go ahead and potentially hedge the portfolio, have areas where you’re willing to take on that bearish exposure along with the bullish but utilizing the VantagePoint forecast to really identify where that is. So here we see this Blue Line crossing below the black line, a similar time here at around 10:10, right? So certain markets started to do well, other things did poorly, we saw the indices just see a lot of volatility. But you want to find out what’s the real stuff with some real strength and completely get out of these things where there’s weakness or, you know, shorting here.
So here we see in Henry Schein, we get this crossover to the downside predicted highs and lows. And again, the exact same point here, of if you’re a shorter-term Trader or just a longer-term Trader trying to accumulate a position or establish a position, where do you want to be looking for places of value to, in this case, sell? So here we see that you get this move up to the predicted high; this is where this really starts going downhill very quickly. And you see you get those little blips over periods of time where you get that really nice entry over a pretty long period of time where you’re running flat, but that’s where you want to get those shorts on as that momentum continues on to the bearish side for that longer-term move. And again, you see as strength comes in, is this a market where you want to be a buyer? Well, you see that immediately not working well, right? Strength over a couple of days, but these predicted highs maintaining as levels where you’d want to short, not go long, as we see that blue line still below the black line.
So this is where it’s really advantageous to have the right tools and create that hedged portfolio. Right? If you’ve got a position where you’re down about 15%, some of these other things up 5 to 10%, we’ve got a lot of things working, and really the point here is that you’ve got the tools to adapt to those changing market conditions, right? If that blue line crosses above the black line, neural index gets bullish, well, you know what to do and what to expect from the subsequent price action that’s likely to follow there.
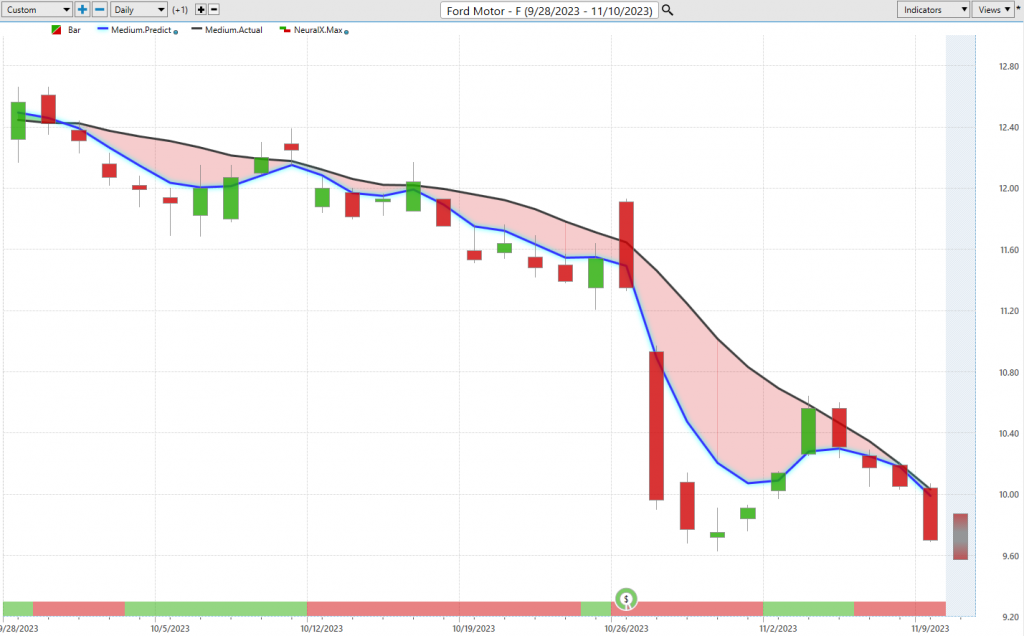
Here’s Ford Motor ($F), that’s likely to follow there.
A lot of news around Ford just with the UAW strikes, and again, you get a lot of those fundamentals playing into the market and people reacting. Well, what has been the VantagePoint forecast here? Well, it’s been pretty decidedly bearish here again, going back really through the month of October. So we see that Blue Line crossing below the black line, neural index doing an excellent job here, saying strength over the subsequent 48-hour periods. But we’re not getting into that bullish Trend, right? We’re not getting that predicted moving average above the actual moving average. And again, we can take this to the very short term and say, okay, well, the Vantage Point user has all of these levels ahead of time to understand that the trend is down. You want to short, take profits on shorts. I don’t know if this is, you know, earnings or some news there, but again, what’s going on? There are no buyers in this market. You get a gap up, you’re immediately going lower. And again, we start to see these short-term rallies. But is that something where you want to get long? Well, no, right? We still have that predicted moving average still below the actual moving average. And we have seen shares decline even more here. So about a 21% decline in the past 29 trading days. This is why it’s critical to have the right tools and really adapt to those changing market conditions. Clearly, not a good month to be involved in shares of Ford. Great place to go ahead and short. And some of these other things, like the consumable staples, you know, starting to turn around and show a lot of support. And so you can do some trading, get that sort of mixed exposure on the bullish and the bearish side, but not leave yourself vulnerable to these, you know, extremely strong rips we’re likely to see, potentially in the indices and individual shares, right? You want to be in the right thing, so when that volatility comes in, you’re really benefiting as things accelerate and move higher, like we’ve seen a gap Kellogg Darden and Quest here. So, I’ll leave it there, but once again, this has been our hot Soxs outlook for November 10th, 2023. Thank you all for watching. Best of luck and bye for now.