


Register for a Free Live Training
The Hot Stocks Outlook uses VantagePoint’s market forecasts that are up to 87.4% accurate, demonstrating how traders can improve their timing and direction. In this week’s video, VantagePoint Software reviews forecasts for Under Armour ($UAA), Sprouts Farmers Market($SFM), Infinera Corp ($INFN), Sally Beauty Holdings ($SBH), GoPro ($GPRO), JP Morgan Chase ($JPM), Goldman Sachs($GS), Bank of America($BAC), Occidental Petroleum($OXY)
Hello again, traders and welcome back to the Hot Stocks Outlook for November 19th, 2021. Hope y’all are having a excellent week out there in the financial markets, and as always, plenty to cover in today’s outlook. We have tons of markets to take a look at and really going over the major themes we’ve identified in the markets here.
So we’ll start out here with shares of Under Armour, Sprouts Farmers Market, Infinera Corporation, Sally, GoPro, J.P. Morgan. We’ve got financials here and we’ll end on petroleum stock here. And again, it’s to really highlight these themes. And then how VantagePoint, through the help of these very short term forecasts, really allows you to adapt and manage those positions.
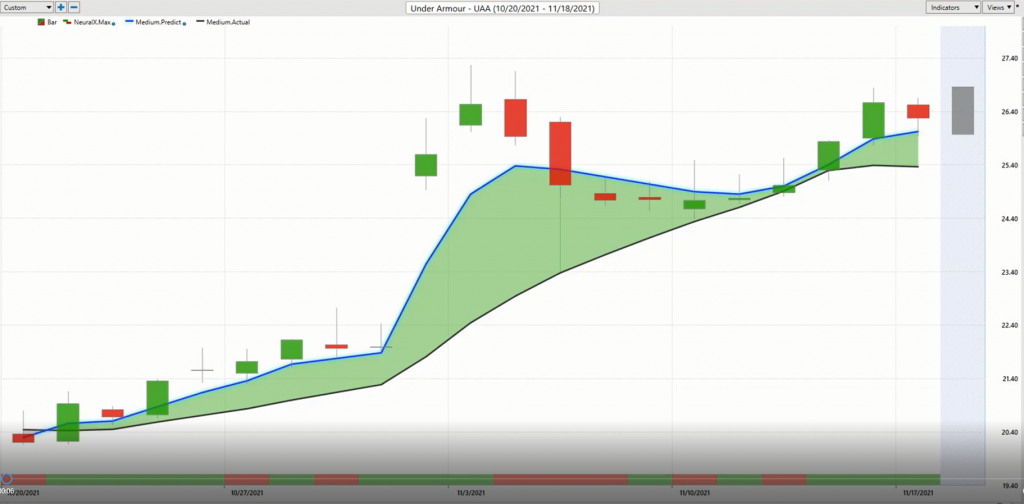
So the big thing here really being Under Armour and we talked a lot about the strength.
They really came through in the beginning of October, and we’ve just seen that coming through all over the market. So as you run your IntelliScans and are able to identify where are these market reversals coming through? Well, what we’re able to identify is things like we see here in Under Armour. So you see that we have daily price actions. So each one of those candles represents a full and complete trading day. And you’ll see that there is a black line and a blue line right up against all of that daily data.
Now the black line that you’re seeing there, that is a simple moving average or what we would refer to as the actual simple moving average. And that’s a very common technical indicator. In this case, it just looks back over the previous 10 closed prices. It’ll add those all together and then divide by 10. And what that does is it acts as a really good tool to smooth out the existing market data and let us know, okay, well, where has market price been, right?
But obviously a trader needs to know where is market price going next? So we can be ahead of these moves much like this big reversal we had in the first couple weeks of October. That’s been very important for where we are now and how you might be managing a portfolio. So what we’re able to identify are these situations where that blue line crosses the black line, but of course it’s what is that blue line telling us? So if we have this lagging moving average or simple moving average letting us know where the market has been, what we’re able to do is compare that to this blue value that’s generated via the technology of artificial intelligence found within VantagePoint.
Now, to be specific, what it’s doing is specifically for shares of Under Armour, which we might call the target market in this case, the market that we look to trade. What this technology is able to do is look at intermarket relationships that are known to drive and influence the future price of Under Armour. Now that can be things like the broader market like the S&P. That can be things like individual ETF groups, but it can also be things like global currencies, global interest rates, global futures and commodity markets.
So what it’s able to do is take upwards of really dozens, 20, 30 inner markets that are known to drive and influence future price and it takes all of that information and actually generates a true price prediction of where things are going. And rather than just using past prices that are just reamalgamating what’s already occurred in the market, what we have is a technology that’s making forward looking predictions, and it’s that predictive data that’s built into this suite of indicators, which we’ll go through here.
So whenever we have this blue line or that blue value cross above that lagging moving average, or that actual simple moving average, it’s suggesting prices are going to start moving higher. And what ends up happening here is when you’re able to take a technology like this and apply it to really all the markets, all the stocks like Under Armour and Nike, all the basic material stocks, all the Netflixes, Apples, all those, what you’re able to see are these shifts that take place in the market, not just in one area, but broadly across the market.
And that’s what we’ll get to when we get to actually some of the bearishness we’ve seen in the market. Where is that happening? And where might you want to hedge the portfolio and use the VantagePoint forecast to navigate all these different situations that are happening? But what we have here again, with the continuing on with Under Armor, is at the very bottom of the chart, you’ll see that there is a bar here that goes from green to red, potentially back to green and, and so forth. And this is also utilizing that technology of artificial neural networks but it’s tuned differently.
It’s not looking for average future prices going forward and creating that very accurate predicted moving average. This is tuned to look ahead 48 hours at a time. So very short term strength or weakness. And we have what we call a binary output of yes, no, green, red, right or wrong. Right. And so what this tells us is again, very short term, short strength or weakness in the market. So you see how it gets bearish here. It goes back to green. It’s getting a little confused it, right? Green, red, green, red, green, red, the point being though is you still have a very strong trend here, right?
So the predicted moving average is getting higher every day saying the overall trend is up saying, look, you may have some sideways price action. You may have some weakness to be prepared for. You see here, the neural index goes bearish. You get subsequent weakness over that price action again, neural [inaudible 00:04:41] you get this weakness, but as the strength of the forecast improves, and as you use tools like the predicted moving average to determine the overall trend direction and whether you should stay in that market, well, it provides a very compelling roadmap on how to manage this.
Now to really put the cherry on top here, as far as the forecast, you’re also through that technology, looking at different timeframes provided a predicted high and a predicted low, so intraday levels to make those trading decisions. And we can go back and see how accurate all of those predictions are against the actual market data. So when you’re able to identify these market shifts and you can form that directional bias and say, okay, well, here’s a market, potentially. I want to be long. You’ve got the guidance, but not just for the next day ahead, you have a tool that’s able to adapt.
So every day take in that new information, do that analysis of looking at those intermarket relationships, take in what happened with the S&P 500, related stocks, ETF groups, and provide a very accurate forecast of what’s likely to occur next. And that’s exactly the benefit of artificial neural networks. They’re very good at large data and predictions. And that’s how, where these are really being leveraged here. So we look at that blue line over black line, plenty of these predicted highs and lows hit very early. We actually hit this initial one, and we can go back to that, but a 28% rally in just the past 19 trading days and this is not atypical of what’s been going on in a lot of areas throughout the market.
So again, we can flip back to those predicted highs and lows and take a look at this. Yes, you’re up 28% over 19 trading days. But buying here, you can potentially take profit at predicted highs and helping to manage this opportunity as it progresses. And as it keeps moving higher and hitting these levels and hitting profit targets, but making sure that you are clearly long over this past 19 trading days.
Now let’s move over to Sprouts Farmers Market. I know we spent a lot of time there. We’re going to accelerate as we go through all these markets, but it’s the exact same thing as recognizing that there’s a lot of strength in this market. We see a lot of crossovers from this predictive technology that indicates that we should look for areas to get long, but we can be more specific with that as far as, “Hey, I want to buy at these predicted lows, I want to shoot towards these upward price targets” if you’re a short term day trader.
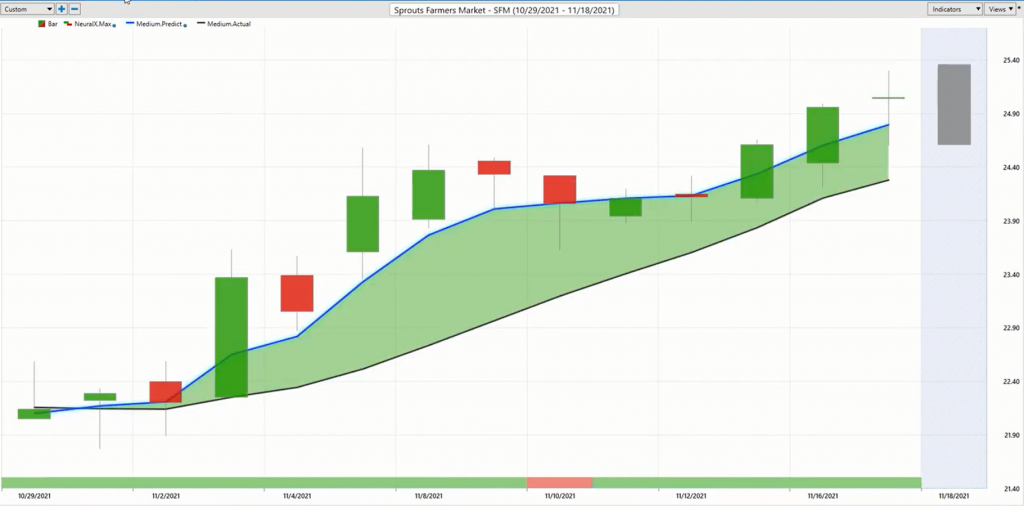
Now let’s move over to Sprouts Farmers Market. I know we spent a lot of time there. We’re going to accelerate as we go through all these markets, but it’s the exact same thing as recognizing that there’s a lot of strength in this market. We see a lot of crossovers from this predictive technology that indicates that we should look for areas to get long, but we can be more specific with that as far as, “Hey, I want to buy at these predicted lows, I want to shoot towards these upward price targets” if you’re a short term day trader.
But understanding that this is the direction we want to trade things. We won’t always hit those predicted lows, but as a guide map, a roadmap to have limit orders waiting and anticipating the price declines before they even get there so that you can make money as the continuation of the move plays out here. So here’s Sprouts Farmers Market, again, more recent shift here, but very compelling opportunity. You see here that the neural index, right? So this is a extremely accurate indicator upwards of 86, 87% accurate in many, many cases. Essentially, I think of it as four out of five times it gets this right.
Well, look at this forecast, green, green, green, green, green gets red here. You get a little sideways action, but back to green, green, and you’re moving higher. When you’re trading can start to incorporate that level of accuracy over the appropriate trading windows, you’re going to be able to get in on more of these opportunities and pull these pieces out of them, whether that’s short term off of predicted highs and lows, or getting a 12, 13% entry on a nice trending move in the market.
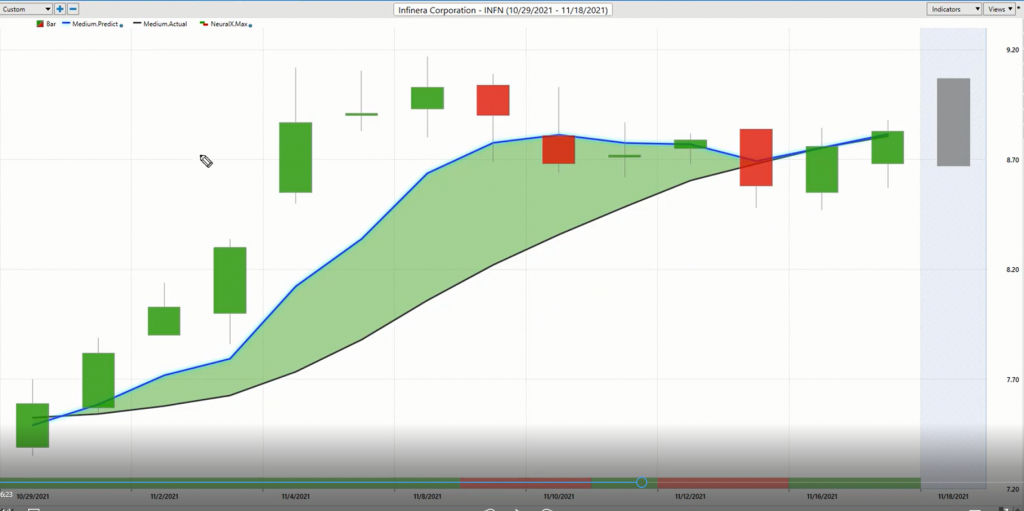
Now here’s Infinera Corporation. Now another great example of a lot of opportunities coming through, and you see this one, really gappy, moving around. That’s how stocks are sometimes, but VantagePoint takes that into account. It’s understanding that look, things are going to bounce around. The technology every single night gets updated, takes that into account, says, okay, well, look for these predicted highs and lows. You see it’s gappy, it’s all over the place, but the technology is constantly going to update and guide you based on what is currently happening. So even in days like this, which when you get that much volatility, things are going to shake around.
You might come outside of these predicted highs and lows. But the funny thing is it often corresponds to previous ones and it also very quickly adapts and understands, okay, what happened there? All right, here’s your new predicted lows if you’re getting bullish and all that. So again, really interesting opportunity. We never get that crossover. You see here between that blue line, you see it’s hanging right above there, and sure enough, here, the market runs a little higher. But this all started back here and we’ve had so many opportunities that just keep coming through really since that, I think about October 6th, 7th, 8th, that’s when it all started. And it has continued just with a lot of these opportunities, you see a 16% rally here in just the past 13 trading days.
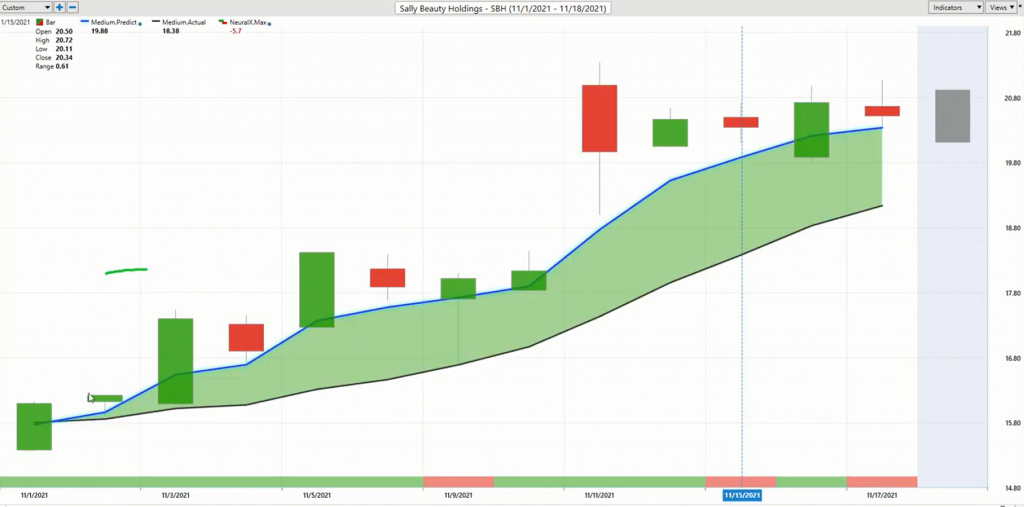
Here’s Sally Beauty Health. Once again, same thing, crossovers coming through, alerting you from that IntelliScan, these technologies really saying, “Hey, these are the areas to look, pay attention.” If you want to of configure the portfolio, these are the areas to be paying attention to and to get that exposure. And you see that’s at, seven or eight entries here as this market moves higher over the course of the trend, but that’s a 28% rally in the last 11 trading days.
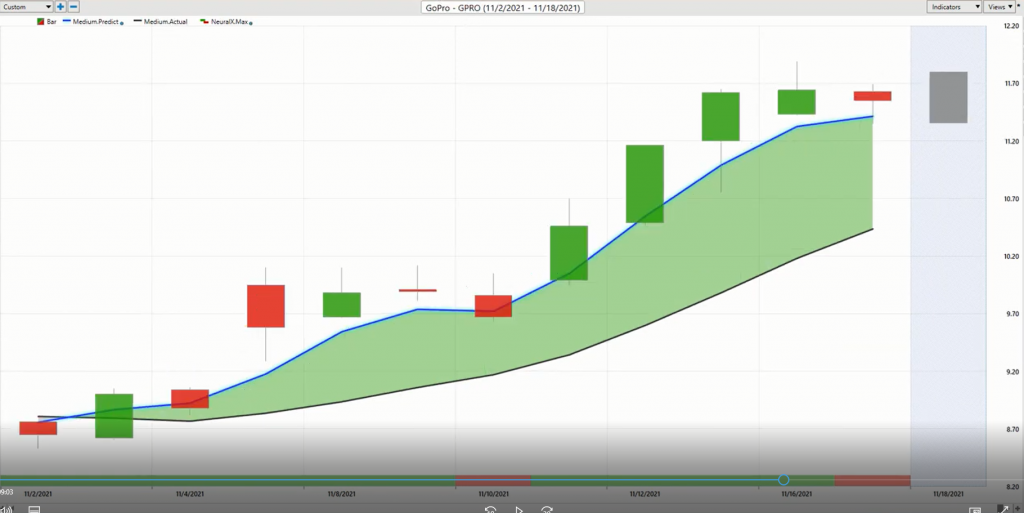
Here is shares of GoPro. Very similar situation, crossed over to the upside. Really nice rally, 30% rally here in shares of GoPro. Look at the predicted highs and lows, doing a good job, three, four entries on the way up there and very good entries. But now we’re going to get to areas where the market isn’t doing what we’ve seen from October, isn’t showing all that strength. Areas we should certainly avoid, right? If we’ve taken long positions in all these different areas of the market, maybe there’s some areas where we could hedge the portfolio by taking shorts, or even also understand that, yeah, we’re a month and a half into a really strong rally. Volatility’s going to heat up. Even on these things that are in uptrends.
We know they can shake around quite a bit. So we can take profit on some of these things with the help of predicted highs and lows, manage them or just hedge the portfolio in areas of weakness. And the two areas that have really stood out, at least for short term forecasting here is financials.
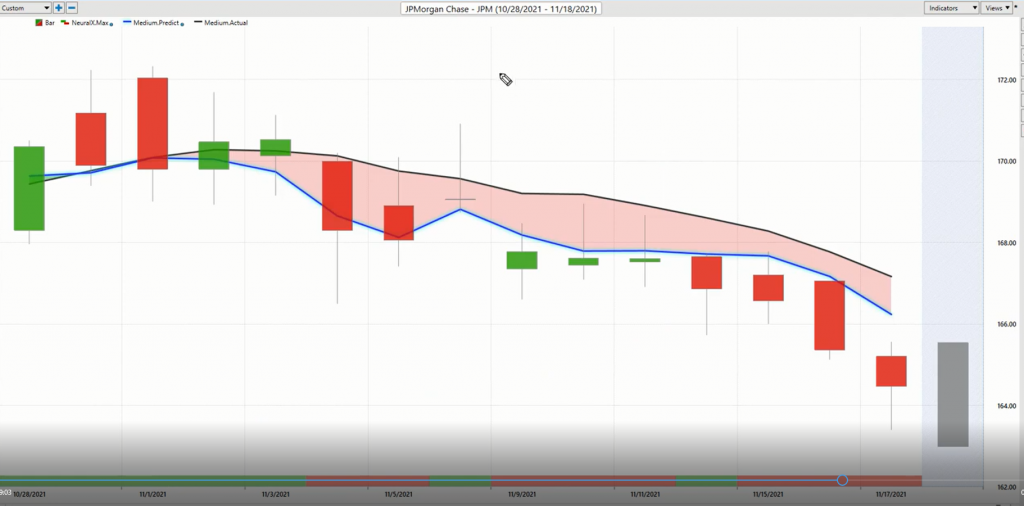
Here’s J.P. Morgan, Goldman Sachs and Bank of America, and also energies to an extent which bring in more markets here. They’re going to yell at me for just going through so many things here, right? But the point being is we look at J.P. Morgan, right? You’re running your scan. What are you seeing? And you see that even the conflict with the indicators, it’s a real strong market. We’ve seen some strength. You’ve got that crossover, the downside neural index bullish here.
But look what happens over the subsequent 48 hours, you’re running sideways, but what about the trend? Right? So these different predictive tools handling different jobs for us to really make us aware of what’s going on here, how might we want to position the portfolio? Where might we want to hedge? And if we’re hedging in financials, where are we looking on an interday basis? Up towards those predicted high levels to get those positions on and you see four entries there, the market has declined and this is one of these things where it’s like, you there’s been so much strength since October, you can trail your stops, make money in those areas, but also potentially hedge and get good entries if things start to slip, and this really insulates the portfolio from just about anything that happens out there in the marketplace.
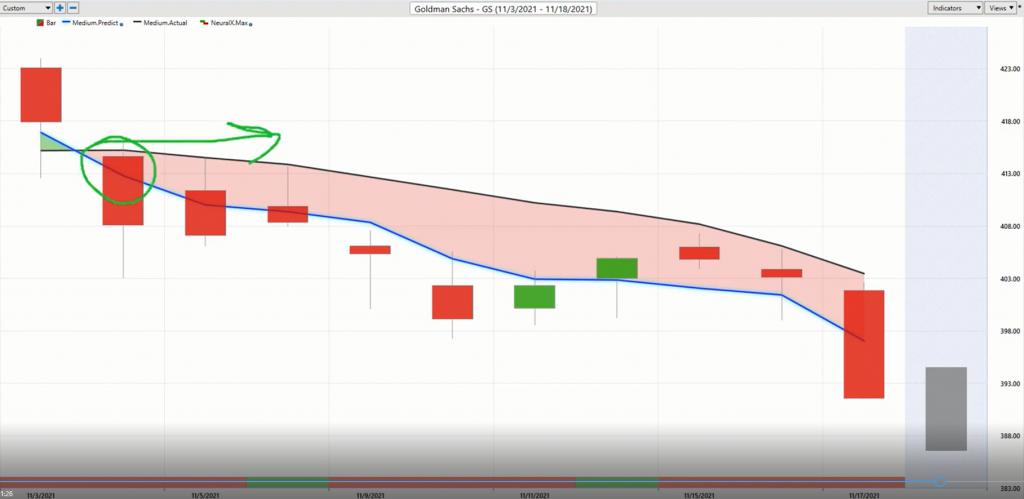
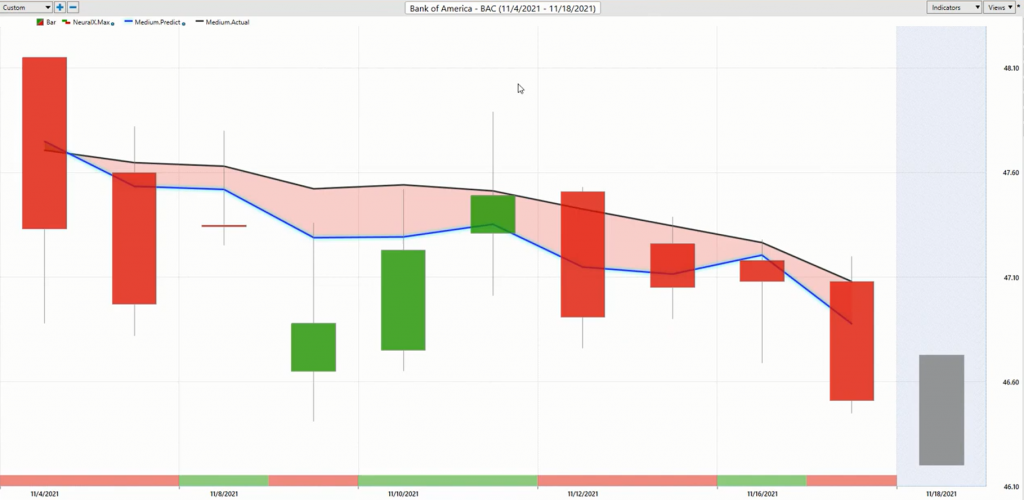
So here’s Goldman Sachs. This is now two weeks old, right? It’s very clear for the past two weeks. Are financial the place where you want to be getting aggressive and adding to the portfolio? For the past two weeks, think about if you’re a short term trader, is that the place? Well, no, there’s been plenty of other places over the past couple weeks to get bullish exposure, but it’s not in financials for sure. And it’s not in energies. And we’ve seen the difficulty in the crude oil market and things pull back there. Here’s Bank of America two weeks ago. You see all of these things clicking through and saying, mm something’s different here than some of these other areas in the marketplace.
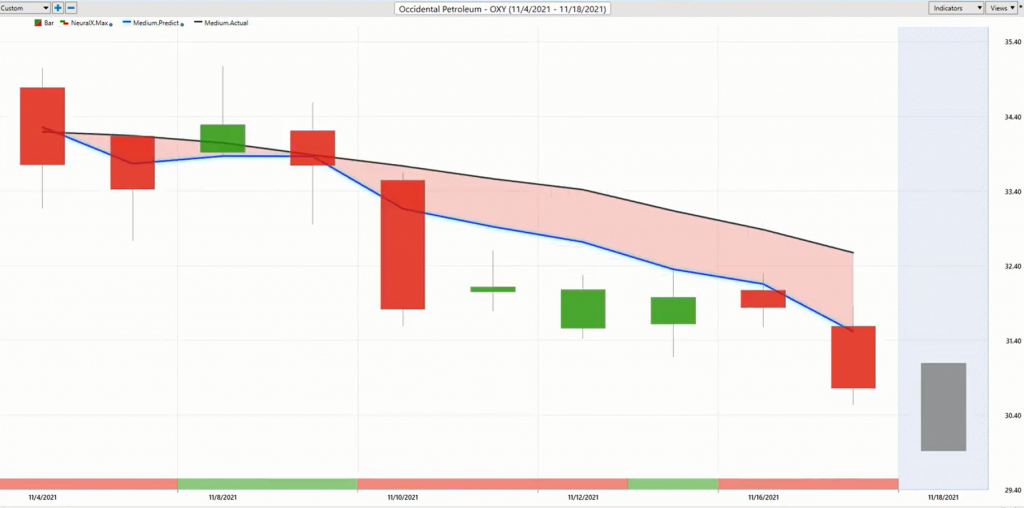
Lastly, here we’ll end on Occidental Petroleum, very similar situation. Crossovers here and you see that, not just here but across many stocks, across the crude oil futures, all of these markets really working together with that intermarket approach and doing a heck of a job forecasting how to position that portfolio on a longer term basis, but also day-to-day guiding you forward to make those better trading decisions. And that’s really what artificial intelligence is all about. Make better decisions with better use of the technology and a better perspective and view on what’s going out there in the marketplace.
Lastly, here we’ll end on Occidental Petroleum, very similar situation. Crossovers here and you see that, not just here but across many stocks, across the crude oil futures, all of these markets really working together with that intermarket approach and doing a heck of a job forecasting how to position that portfolio on a longer term basis, but also day-to-day guiding you forward to make those better trading decisions. And that’s really what artificial intelligence [inaudible 00:12:24] is all about. Make better decisions with better use of the technology and a better perspective and view on what’s going out there in the marketplace.
So once again, this is been our Hot Stocks Outlook for November 19th, 2021. Thank you all for watching, best of luck and bye for now,


