Register for a Free Live Training
The Hot Stocks Outlook uses VantagePoint’s market forecasts that are up to 87.4% accurate, demonstrating how traders can improve their timing and direction. In this week’s video, VantagePoint Software reviews forecasts for SPDR SPY($SPY), Archer Aviation ($ACHR), Helen of Troy ($HELE), Gamestop ($GME), Texas Pacific Land ($TPL), Procter and Gamble ($PG), SOFI ($SOFI).
SPDR SPY ETF ($SPY)
VantagePoint A.I. Hot Stocks Outlook for November 29, 2024
Hello again, traders, and welcome back to the Hot Stocks Outlook for November 29th, 2024. I hope you all had a nice Thanksgiving Day week. There was a little bit of disruption in the trading week with markets closed, and it’s been just a few days since the last Hot Stocks Outlook, but of course, we’ll update and take a look at the most recent VantagePoint A.I. predictive forecast. If you haven’t already, make sure you go ahead and click on the link down in the description below and get signed up for a live demonstration, so you can learn all the specifics about how these predictive technologies are helping traders make much better trading decisions in the marketplace.
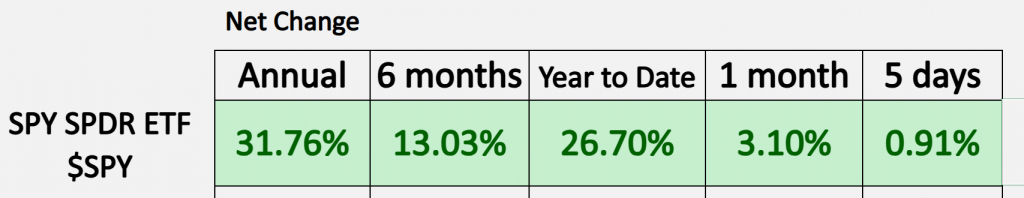
As we typically do, we can start out by looking at the S&P 500. Year-to-date, a little bit more in gains takes us up over 26%, and we have seen the markets climb a little higher, but we do see again some shares like Nvidia not performing well, and so the overall indices are being a little mixed, and therefore individual equities are really where you want to identify some new opportunities.

We can start out here with Archer Aviation ($ACHR). This is really where all of these predictive indicators work, regardless of what markets you’re trading. When we start out these forecasts, the first thing we want to understand is that this is all daily price action, so each one of the candles that you see represents a full and complete trading day. The first indicator, really predictive indicator, that we’re going to take a look at is this blue and black line right up against the price data.
Now, the black line that you’re seeing there is actually a simple moving average, or what we call the actual simple moving average. This is a very common technical analysis indicator, and what it’s doing is just looking back over the previous 10 close prices, it adds those all together and then divides by that number. So, what that gives us is a good baseline—a really rolling measure of letting us know where market prices have been. But traders want to be ahead of that next move in the marketplace.
What VantagePoint traders are able to do is utilize features like the IntelliScan to identify where we’d call this predicted moving average crossing above the actual moving average. For this number, which is essentially a calculation of future prices plotted forward on the chart for you, this number is utilizing that technology of artificial neural networks, and it’s performing what we would call intermarket analysis.
So, what this technology is able to do is understand market relationships—really doesn’t matter whether it be the broader S&P 500, another index like the NASDAQ, whether it be ETF groups or individual stocks, as well as things like currencies, global interest rates, or even global commodities. It’s going to look at how dozens of markets are affecting the target market that you’re trading and affecting future price movements. This is where we can extract a lot of these valuable price clues out of the data; some of these relationships are leading, lagging, some positive, or inverse correlations.
There’s really this level of analysis you have to rely on artificial neural networks because there’s really no way for a human to do it. So, what we end up getting is this forward-looking prediction of future prices, and so whenever we see this blue line cross above the black line, it’s suggesting that these average prices are going to start moving higher, and you may want to go ahead and look to take a long position.
So here in shares of Archer Aviation, we can see the market’s up 131% in just the past 15 trading days, and this all really came right after earnings, which you see right here. What I really want to do here is just highlight how really through earnings and after that event the predictive indicators from VantagePoint do an extremely good job here helping traders make better trading decisions.
While we got that big 100+ % move, if you look at the very bottom of the chart, you see this bar that goes from green to red and back to green. This is another tool utilizing that artificial intelligence neural network approach to analyzing market data, but this is tuned to solve a different problem, and this is really just 48 hours, or you can think of it as two trading days. So, you’ll notice that whenever that neural index goes down to a red configuration, we sometimes get some subsequent weakness over the next 48 hours, and this indicator has an extremely high level of accuracy, 80 plus %, on an extremely wide number of markets.
This allows traders in the short term to really know what to expect here. And so, when we really round this all out, you’re even provided a predicted high and predicted low candle. So, this gets down to intraday; we’re going for the overall trend, 48-hour predicted high and low, and really giving you that overall forecast of where things are headed.
Each week as we go through these VantagePoint predictive forecasts, we take a close look at how accurate all of these predicted high and low candles are before the trading day occurs, and you can see here you get these excellent entries really about four, five, six entries very close down towards those predicted lows, and the overall trend resuming here.
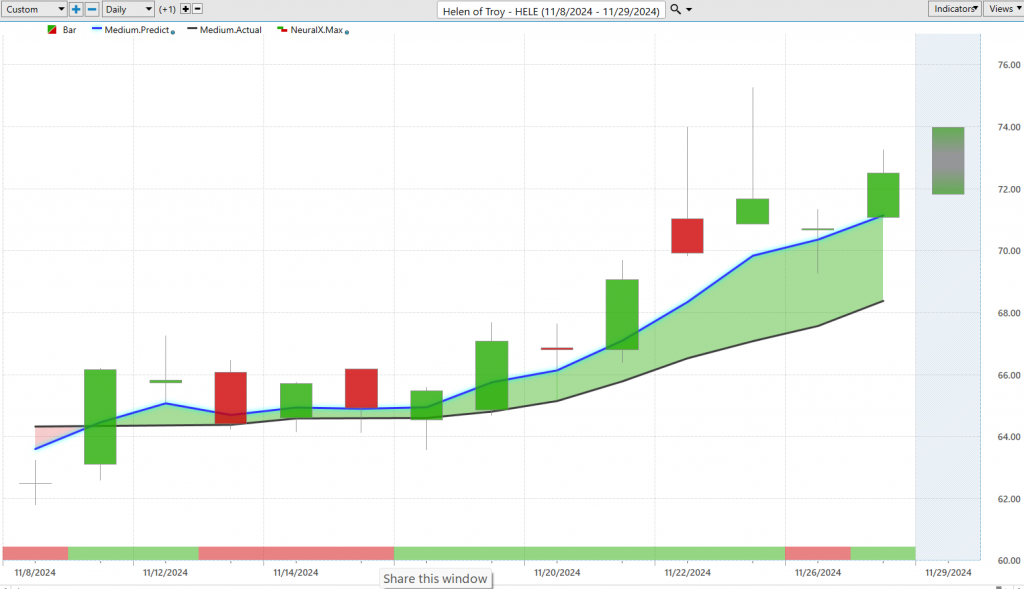
So, really phenomenal stuff, really exciting move there out of Archer Aviation, and really, this works off really regardless of what markets you’re trading. So last week, Helen of Troy ($HELE), we took a look at Helen of Troy, and we’ve only had a few trading days, so we actually took the information from Thursday here and say, hey, this market looks very bullish, and you see what we’ve seen over the next four trading days—well, the markets remained very bullish.
You see these really strong pushes in market price, and again we can look at those predicted high and low candles and get a sense here of, okay, well, where is VantagePoint forecasting this market to move lower? You see we move a little bit lower than this candle, but all that’s really happening is you’re getting this gap-filling behavior—all this really aggressive push higher, you get some volatility filling the gaps towards these predicted lows, and then the overall trend again moving towards that predicted high and still remaining very bullish there.
So, really nice opportunity there in Helen of Troy, and that’s only just extended this start to the move. So you know, we brought this through with a couple of other stocks; it started to turn higher here, and we’re seeing you know as it continues, you want to be able to exploit that as best as possible. So we’ve had an 11% move just in the past 13 trading days.
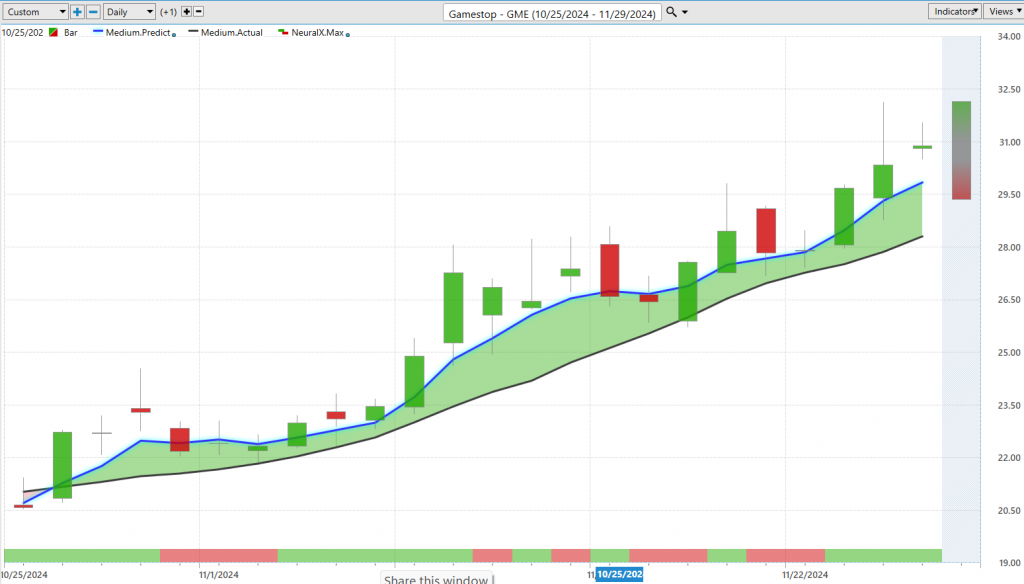
Last week we also took a look at GameStop ($GME), and again, it’s one of the weirder weeks where we only have a few trading candles in between the last updated forecast, but here you see in GameStop, we get this very clean crossover to the bullish side, a couple of periods where that neural index will go bearish, but very clearly, this market is in an uptrend, and so you see just over the past few trading days a lot more bullishness, the market continuing that rally, and really again, we see just over these past four trading days another 10 almost 11 %, um, since that last hot stocks outlook here, leading to about a 36% rally over the past 22 trading days.
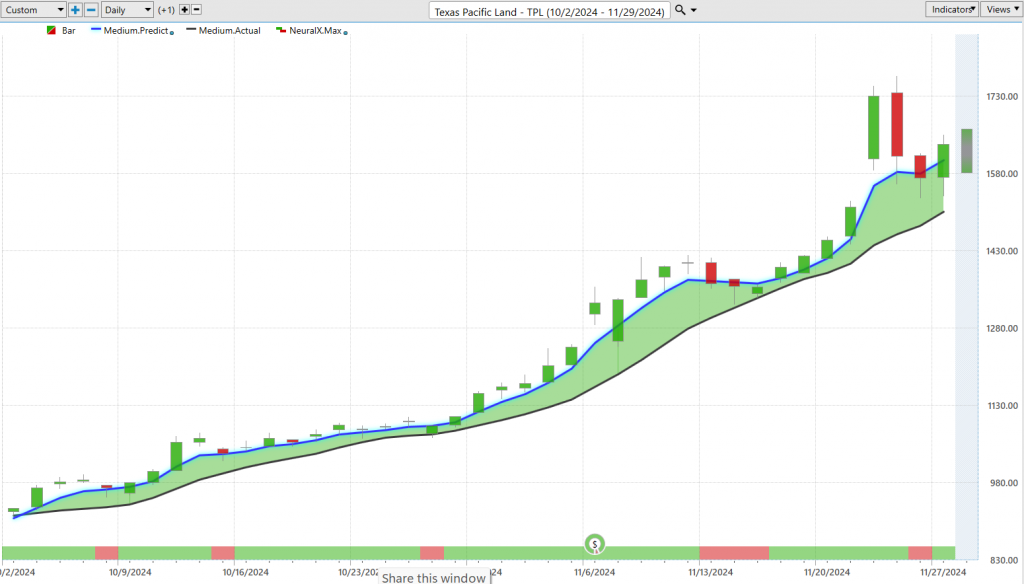
So new opportunity here in Texas Pacific Land ($TPL), just a good example of how when these trends get going, just like GameStop here or Hell in a troy right, you want to recognize this and do some trade management so that you can hold out for the longer term here. Here you see this crossover coming all the way back at the beginning of October, and you just see the tremendous amount of strength here.
So this is a good example where you can see that essentially almost every day the market moves higher right, so you get a couple of days here where that neural index technically is incorrect, it almost immediately corrects itself, and that’s where you see that momentum pick up. But you see here again, getting that weakness, a little bit of volatility more recently, but everything’s skewing very bullishly to the bullish side here.
So, if you are a trader, you’re constantly getting bullish signals that say, look, this is in an uptrend, look, there’s short-term momentum from the neural index, as well as okay, well you’ve also got those predicted highs and lows, and this is where this gets really exciting of just numerous entries as this market moves higher.
So you see here, we’ve got probably a good dozen entries here again, right around earnings, filling some of the gap, and then that trend almost immediately resuming here. So, really nice move here out of Texas Pacific Land, and of course, we can take a look here at the overall trend here from the VantagePoint predictive moving average about a 69-70% move since when that forecast first came through.
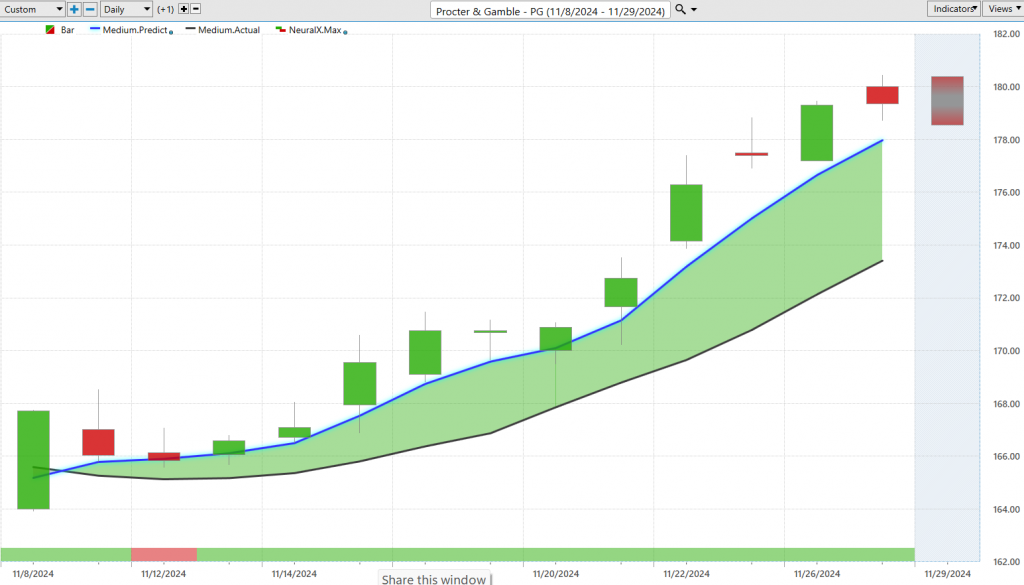
Here, shares of Procter & Gamble ($PG), here you see his blue line crossing above the black line, neural index very bullish, and the same thing right, so one day where that neural index is bearish, a couple of days of somewhat subdued price action, but you see how immediately that neural index gets bullish, and we’re just seeing all that momentum immediately kick in, and again, getting you ahead of this really nice advance in the market from about 160s up to about 180 per share.
And of course, we can take a look at that overall move here and about a 7% move, obviously Procter and Gamble, a little bit larger of the stock going to be a little bit more slow-moving but something that may be advantageous to add to the portfolio.
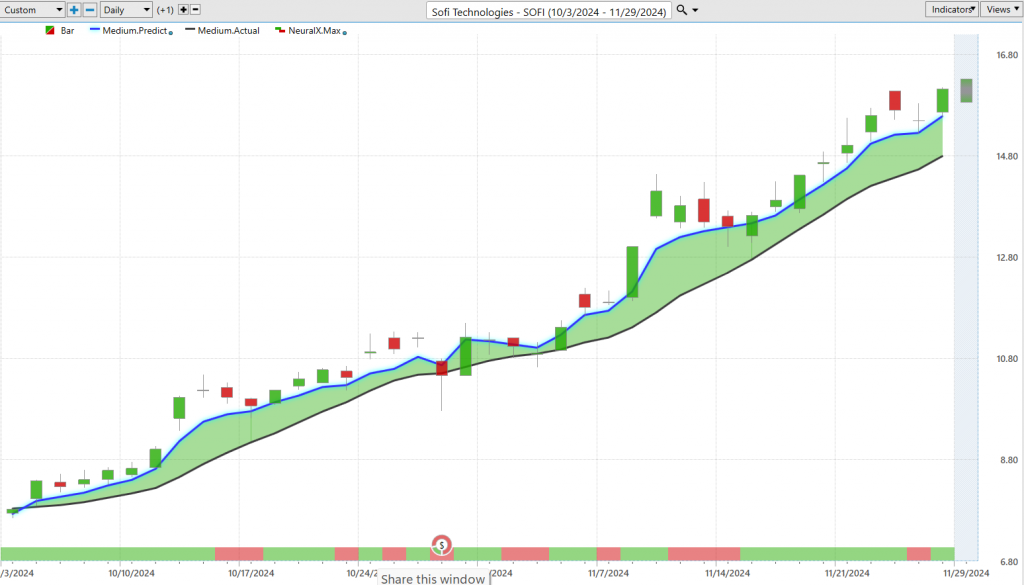
Lastly here, shares of Sofi Technologies ($SOFI), and again, another good example of here of when these crossovers come through you may have these opportunities that persist, and when you can identify a trend early, well often times you get that cushion going into earnings.
So, you see, we get a little bit of that noise and volatility right at that earnings mark, but overall, the trend here very bullish, and this market’s almost doubled here, and over that doubling process well of course we have a lot of levels coming through from the VantagePoint predicted highs and lows.
So, again, you see this noise around earnings, but how many times you’re moving down to that predicted low and pretty much within about two trading days starting to move higher within the overall trend here. So again, again, really nice opportunities, and really nice opportunities spread throughout the market, so this is where you’re seeing a lot of individual stocks perform extremely well.
Um, really over the past three months, there’s just plenty of markets where we’ve moved 50 to 100%, uh here SOFI up about 99% in just 39 trading days, so really exciting moves there, uh, and really the big thing is, of course, having the tools and that game plan ahead of time, of knowing that okay, we got these robust forecasts, we got that guidance from the short-term forecasting from the neural index and predicted highs and lows, and you can express that trading strategy, whether short-term, long-term, options, whatever you might be doing, uh but have a robust set of tools uh to help guide that trading behavior.
So, we’ll go ahead and leave it there for today. Once again, this has been the Hot Stocks Outlook for November 29th, 2024. Thank you all for watching, best of luck, and bye for now.