


Hot Stocks Outlook for the Week of
October 4, 2019
The Hot Stocks Outlook uses VantagePoint’s market forecasts that are up to 87.4% accurate, demonstrating how traders can improve their timing and direction. In this week’s video, VantagePoint Software reviews forecasts for Lennar(LEN), Charles Schwab(SCHW), Western Digital(WDC), and S&P 500(SPY).
This Week’s Hot Stocks Outlook
Good Afternoon and welcome back to the hot stocks outlook for October 4th, 2019. I hope y’all are having a excellent week out there in the financial markets. And as always, plenty to cover in this week’s hot stocks outlook. So we’re going to start taking a look at shares of Lennar. We’ve also got Charles Schwab, Western Digital, and we’re also going to take a look at the S&P 500 forecasts, as well as how a lot of these features work within the Intelliscan, allowing traders to find new opportunities after each and every trading day.
Lennar (Len)
But starting here with shares of Lennar, what we have here is daily candles. So each one of these candles represents a full and complete trading day. And against that daily price action, you see there is a black line and also a blue line. Now, the black line that you see against the chart, that is a regular or simple moving average. So very common technical indicator. All it really does is look back at previous closed prices, adds them all together, divides by 10, and sort of plots that line moving forward.
Now, the problem with an indicator like that is it’s only looking at past prices and, of course, only looking at the target market, in this case, closed prices of Lennar. But we want to know where are prices expected to move going forward. And so what we want to pay close attention to is this blue value or what is referred to as the predicted moving average. Now, for this value to be generated each and every night, VantagePoint is performing what’s called intermarket analysis. So it’s actually using artificial intelligence to understand how other related markets. So that can be things like ETFs, individual stocks, the major indices on the futures market, currencies, interest rates, how all of those are known to influence specifically shares of Lennar, and it actually utilizes this technology to generate future prices that haven’t yet occurred, and build that into the value of these indicators actually creating what was a lagging indicator turning into a forward looking predicted moving average.
So once that blue predicted moving average, in this case, crosses above the black line, average prices are expected to start moving higher. But you also have the additional help of a couple of other tools within the VantagePoint software. Now, at the very right hand corner of the chart here, you see that you have really a shadow bar. And this is actually predicted high and predicted low that’s generated before the next trading day.
So we’ll actually be able to see how accurate each one of these predictions are against the actual trading day. And really to round out the forecast, you also have this indicator at the very bottom of the screen, and this is an extremely accurate upwards of greater than 80% accuracy from this indicator at the bottom, but it’s forecasting the short term strength or weakness in the market.
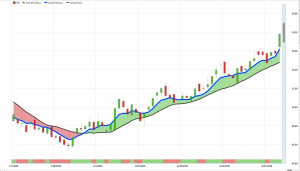
So how I like to use this indicator is to understand that, well, when that neural index is red or a bearish configuration, I should expect prices to likely move to the lower side of that predicted moving average. But of course, as long as that blue line is still above the black line, the overall trend still very much to the upside here. So what we get is really a combination of all these tools working together on a daily basis to help traders understand, well look, I know directionally if I want to go long, and I also have an intraday level to know where I should be looking to add or initially get involved with a particular position here.
And you see how within a couple of trading days and even when you have some of these days where you see you go out of the range, look at the guidance moving forward and letting you know, hey, you may see some weakness over these trading days, but you want to be a buyer down at these levels. And you see what happens. A little bit of consolidation, a little bit of weakness, but the overall trend still very much to the upside.
So these are the tools that are helping traders manage their trading opportunities on a day to day basis because you’re not only knowing, okay, well when has that trend reversed, but also where should I be adding to my position? How should I be managing this trade and expecting short term strength or weakness? So we see this market up over 12% in an environment where the markets have done very poorly, but certainly not an area where you’d want to be shorting. And here shares of Lennar, as you see that trend very much to the upside here.
Charles Schwab (SCHW)
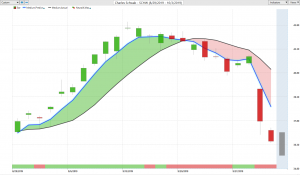
Now, moving on to shares of Charles Schwab. So I wanted to go ahead and bring this in because we had a lot of markets do really well in September, and we can see a very similar correlation playing out on a lot of different stocks. But here you see in Charles Schwab, great opportunity to get long benefit from that bullishness in September. But you see how quickly everything has shifted in a lot of these markets here and how the trend is decidedly down. And we’re really seeing that acceleration to the downside here. But look how accurate these predicted highs and lows are.
So on the upside, you know, okay, well where should I be coming in on a short term basis and adding to my position, but then recognizing, whoa, everything has really shifted here. Now I want to be shorting from these predicted highs and essentially making a bigger move to the downside here more recently. But you still see that nice move up, market moves up about 13, 14%. But very quickly, the environment shift starts to move lower. And very clearly, you see that over the past couple of weeks, a lot of these scans, so running the Intelliscan feature and identifying fresh crossovers from the software, have really been pointing to the downside. And that’s gotten traders ahead of a lot of this weakness coming through more recently.
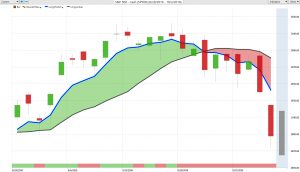
We see about a 15% decline after a 14% rally. You know, you’ve been up over 25 or so percent trading this market off of these VantagePoint forecasts. So really nice opportunities there. More recently, shares of Western Digital, you see we get this crossover to the downside. Again, more of these markets in a lot of different sectors highlighting this weakness, going into really the end of September and going into the early part here of October here. But you see this crossover to the downside. A lot of tech stocks doing very similar things. And of course, you have this tool that says, “Look towards these predicted highs as they’re really great places to go ahead and set shorts.”
And you see that this market really started a crossover here up here at $63, and multiple opportunities where within a couple of days, you’re shooting down to those predicted lows. You can take a short term trade or hold out for that longer move to the downside. So shares here certainly declining and not a good time to be pushing long positions in the market. So certainly if you’re long, some of those home builders, you’re starting to see those actually rollover. But you can trail your stop, stay on the long side where it’s appropriate, but have some bearish exposure in your portfolio certainly make sense here.
S&P 500 (SPY)
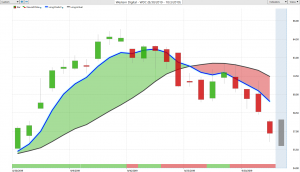
And I wanted to bring in this forecast from the S&P 500 because we can see going all the way back towards really the 22nd of September, this crossover moving to the downside and indicating the traders look, as far as the S&P 500 is concerned, when we’re up here at these predicted highs intraday, you certainly want to be looking to go ahead and short stocks, take some profits up at these levels, and more appropriately, short a little bit above 3000 here on the S&P. We see over the weekend, these forecasts came through and say, “Hey, look towards these predicted highs and nothing from the neural index.”
So you just see that continued forecast of weakness moving forward that says, “Look, don’t be long here. If you’re looking for individual stocks, you can be scanning to the bearish side of the market.” Understanding that, “Hey, the S&P is about to drop 4%.” Certainly, that’s not going to be very conducive to bullish stocks. So what we can do here is actually come into our Intelliscan feature. And I can go and you see… Type Intelliscan here. We’ll just go ahead and start a new one. We can also bring in our market tree here.
So you see on the left, what I’m able to do is drag any one of these areas. So maybe I want to trade futures or Forex or ETF groups. But what I can do is take all of these, in this case US stocks, move them over to the Intelliscan area and we can quickly scan for fresh crossover.
So looking for areas where there’s that fresh reversal of a particular market trend. And you see, with this weakness more recently, we’ve got 153 crosses to the downside. Certainly, over the past couple of weeks, we’ve gotten a lot of crossovers repeatedly coming to the downside indicating that fresh weakness coming through shares. But what we can do is then go ahead and look through some of these opportunities and say, “Okay. Well, where is the new opportunities for me to really start a new position here.”
So again, you see builders first source. You’ve seen certainly weakness over the past couple of weeks already here, but you see here a nice opportunity. Again, a lot of shares doing well in that bullish period in September, but when that environment changes, you want to go ahead and recognize that. So you’ve seen multiple opportunities here on the bullish side as this market moves higher, but very clearly, you see, things have really changed here. You’ve got a fresh crossover the downside indicating no longer would you want to be buying an opportunity like this. You wouldn’t want to keep shooting and targeting opportunities to the upside. You’d want more, so get away from that opportunity and even look to go ahead and go short.
Western Digital (WDC)
Although again, over the past couple of weeks, plenty of these opportunities like Western Digital, Schwab, you see the whole market really turning in unison and letting you know that it really make sense to go ahead really be net short and get exposure as these markets really start to decline. So really great opportunities all throughout the marketplace this week. But we’ve just seen, again, a lot of these shares do exactly what Charles Schwab is doing here, right?
We had great opportunities in September, but when those things start to shift, we pulled out shares of DocuSign last week, one of those fresh opportunities as far as weakness coming through. And you understand how to position that overall portfolio to benefit from where these bigger moves are likely to move here. So, have a great rest of the week. Of course, once again, this has been our Hot Stocks outlook for October 4th, 2019. Thank you all for watching. Best of luck and bye for now.


