


Register for a Free Live Training
The Hot Stocks Outlook uses VantagePoint’s market forecasts that are up to 87.4% accurate, demonstrating how traders can improve their timing and direction. In this week’s video, VantagePoint Software reviews forecasts for Public Storage ($PSA), Qiagen ($QGEN), Ciena ($CIEN), Lucid Group ($LCID), Goldman Sachs ($GS), Warby Parker ($WRBY)
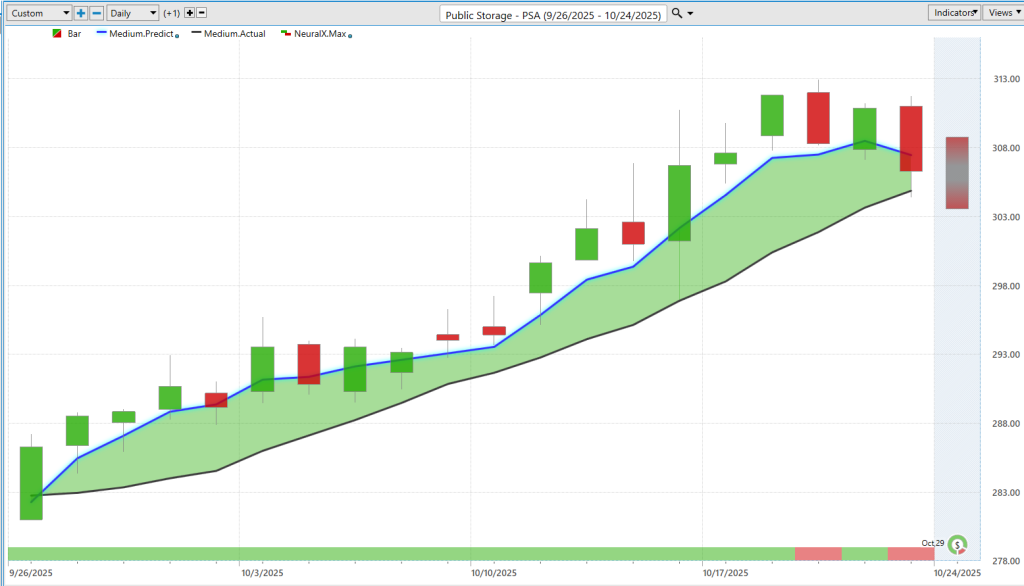
Public Storage ($PSA)
Hello again, traders, and welcome back to the Hot Stocks Outlook for October 24th, 2025. I hope you all have had an excellent week out there in the financial markets. And as always, we’re going to take a look at the most recent VantagePoint A.I. predictive forecast.
So, if you haven’t already, be sure to go ahead and click the link down in the description below, and get yourself signed up for a live demonstration to learn all the specifics about how these predictive indicators and technologies are helping traders navigate the financial markets and really make better trading decisions.
This is a really nice opportunity. We’ve seen volatility pick up in the marketplace—a good opportunity to really highlight how all of these predictive tools work together.
We can start out here with shares of Public Storage (PSA). And like with all of our previous and subsequent examples, all of this is based off of end-of-day data. Each one of these candles that you see there represents a full and complete trading day.
The first thing we’ll cover here is that right up against all that price data, you’ll notice there is a black line and also a blue line value. The black line that you’re seeing there is a simple moving average—this is a very common technical analysis indicator. The only issue with this indicator is that it always looks back, and in this instance, it’d be a 10-day moving average. So it looks back at the previous 10 close prices, adds them all together, and divides by that number.
That acts as a good baseline to let us know where market prices have been, but it really has no predictive capability—just smooths out what’s already occurred in the market.
What VantagePoint traders are able to do is compare that value to the VantagePoint proprietary predicted moving average. This number, which we can think of as a forecast of average prices looking forward on the chart, is generated through artificial neural networks performing what we would call intermarket analysis.
Rather than just looking back at past prices like traditional technical analysis, the neural networks within VantagePoint are using data from other markets—markets that are known to drive future price action, whether positive or inverse correlations. Neural networks and A.I. are good at identifying these leading and lagging relationships in the data.
This spans the global markets—individual stocks, ETF groups, global currencies, interest rates, and even particular commodities where applicable. Gold mining stocks, oil stocks—these are all driven by movements in the raw commodities themselves.
It takes this global approach, weighing dozens of market relationships, and uses that to generate highly accurate predictions. All of these VantagePoint indicators have a very high level of accuracy associated with their output, and the company continues fine-tuning the neural networks to get the best output possible.
Whenever we see this blue line cross above the black line, that suggests that these average prices should start moving higher and traders may want to look to take a long position. The distance and separation between the predicted moving average and the actual moving average are often good signs of how strong a particular trend might be.
As we look here, as far as that blue line moving above the black line going into just yesterday’s close here in Public Storage (PSA)—and a lot of storage companies generally have performed quite well over the past few weeks—you’ve got a 6–7% move here over the past 19 trading days.
But this is where things get exciting depending on what your trading strategy, approach, and timeframe really are. This is a holistic forecast—it’s not just looking at the overall trend direction. We also have this bar at the bottom of the screen which can go from green to red and back to green.
This indicator has an extremely high level of accuracy—upwards of 80-plus percent—on an extremely wide range of markets. Essentially, four out of five times this indicator will be good at anticipating whether prices will be higher or lower over the next 48-hour period.
We see how this works: as this trend moves to the upside, that neural index gets bullish and we get a lot of momentum in the market until recently, where you see that neural index go bearish, and subsequently, 48 hours later, prices are trading at lower levels.
Additionally, we’ve gone from the predicted moving average (the overall trend), to the neural index (48-hour forecast), and then to the intraday predicted high and low. This indicator utilizes that predictive data—looking at intermarket relationships—but focuses just on tomorrow’s price levels as far as a prediction of the high and the low.
As Friday trades here, we’ll get the actual market data filling in, and we can see how accurate all of those predictions are.
Looking back at previous forecasts, we can see how accurate all of these VantagePoint predictions have been. You really see how this works—getting very close to the predicted lows, moving down toward predicted lows, even seeing how the market tends to respond from those predicted highs and then trades lower from that point.
This is where traders can really utilize this information to make better trading decisions and navigate the markets more effectively. You see about three or four entries very early on here, guiding you every single day moving forward.
Even here, getting a pretty aggressive slant lower as far as that predicted trading range—and then, of course, earnings coming up here in the near future.
A very interesting opportunity again—we see a lot of these storage stocks performing well. This is where the software is very effective at identifying when these sectors start to move, allowing you to hone in on these opportunities.
Qiagen ($QGEN)
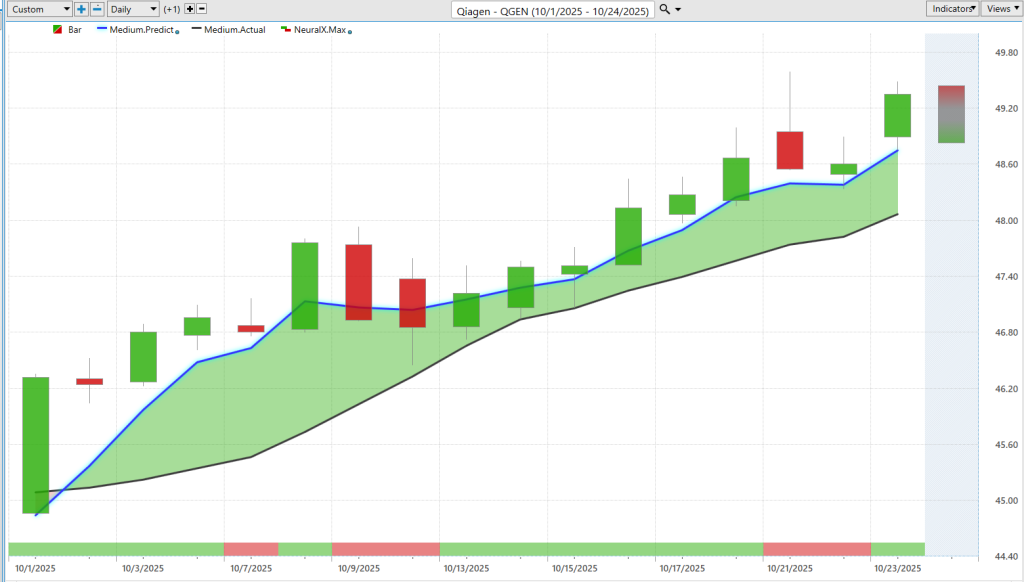
Here’s QGEN (Qiagen)—a good example again of how all of these tools work together. The predicted moving average moves above the actual moving average, neural index very bullish, but then we move down to a red configuration and run into sideways price action with subsequent 48-hour periods where that neural index goes bearish.
Once it gets bullish again, we see that momentum pick up in the market. Another day where we run sideways—but overall, clearly a market that’s in an uptrend and you’d only want to be going long and taking profit on long positions.
We see another 6–7% move just over the past few weeks, and of course, those predicted highs and lows can really help refine a lot of this. Understanding that you might want to be buying down at these predicted levels—you see a couple of days ago moving down to the predicted low and then moving up to that actual predicted high from that trading day as well.
Very interesting stuff here and again, good examples of how all the tools work together.
If your trading strategy is shorter term, maybe you want to rely on that neural index and predicted high and low. If you’re looking for position and swing trades, this is where the predicted moving averages can be very effective.
Ciena ($CIEN)
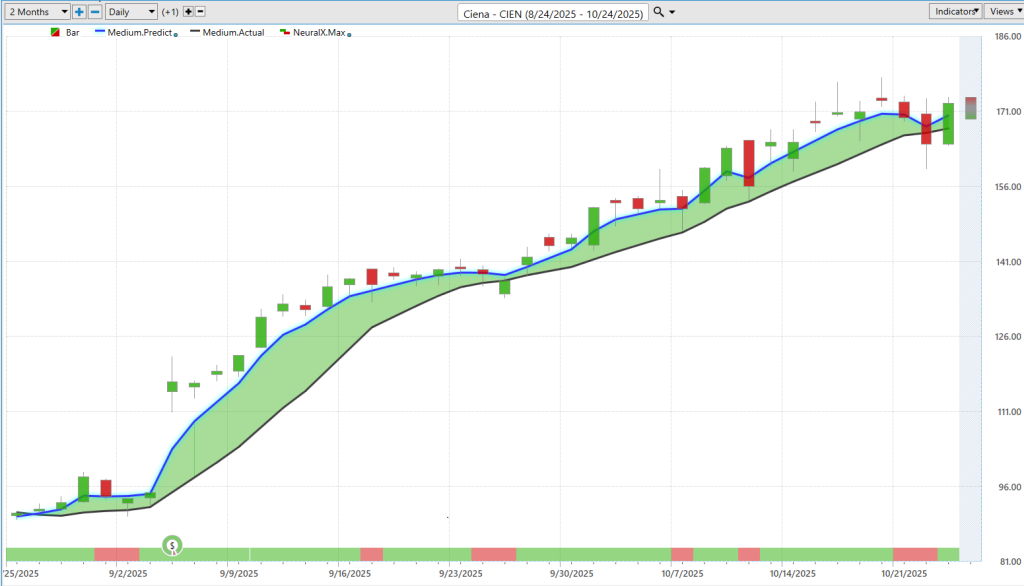
Here in Ciena Corporation (CIEN), this is a stock that really, in April, coming off of the lows, has continued to perform well. Whenever we see this forecast get bullish, it’s a good time to get involved in the market.
We see earnings here and the market really responding well. What’s really effective about VantagePoint is that even when you have these huge volatility catalysts—events that drive volatility in the market, such as big gaps—VantagePoint adapts to those market conditions and understands, “Hey, there’s been a big move here. Let’s look at those intermarket relationships and then generate all of these predictions moving forward from that point in time.”
Even when we see a lot of volatility, the software often does a good job of really adapting—getting back on track and saying, “Okay, where are these levels where we might want to accumulate a position?”
On days like this, if you’re waiting down at the predicted low, you just get filled actually at the open, and you see the market trading straight up from that point.
Many of these opportunities keep trading higher. If we look at this overall position, this has lasted over a very long period of time. As you get into these long, sustained trends, volatility and the daily ranges tend to pick up quite a bit.
You want to identify those early entry points. You see this market up about 85% now, just over the past 41 trading days, with a very solid forecast—the blue line remaining above the black line, letting us know the overall trend is still bullish.
Lucid Group ($LCID)
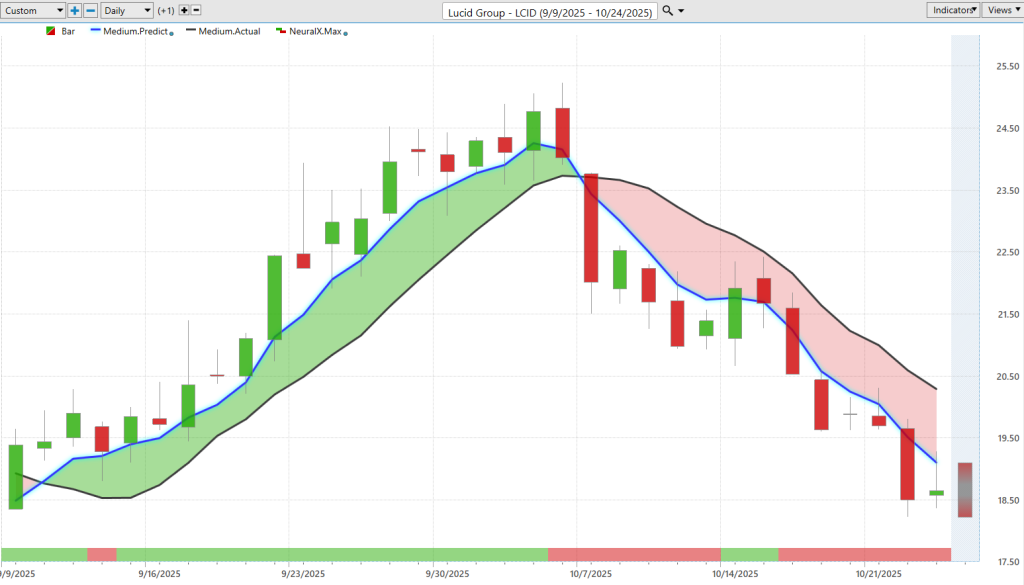
A couple of weeks ago, we looked at Lucid Group (LCID)—another example of how these tools adapt. As we see this blue line crossing above the black line and the neural index bullish, it really highlighted opportunities to get a position on.
You see how this works and get familiar with it as you utilize the software. Often, on these days where you take up the northern half of the range, the subsequent predicted low levels aren’t hit. The market moves right down to that level and then continues on with its uptrend.
There were numerous opportunities where we had this bullish momentum, the sustained price movement higher, and then you see this very strong move lower as the predicted high and low range and neural index before that trading day turned bearish—and all of that reverses.
The trend moves into a downtrend. You see how these predicted highs and lows now work on the bullish side or the bearish side—moving up toward the predicted high but then selling off.
Even just this past week, moving up to those predicted highs—and you’re already down about 8.5% just over the past few trading days. Clearly, this market is now in a downtrend.
If you want to benefit from the VantagePoint forecast, clearly it’s short—take profits on shorts. Previously, down at 19 was a good opportunity to get long going into early September, but you want to adapt to changing market conditions.
Goldman Sachs ($GS)
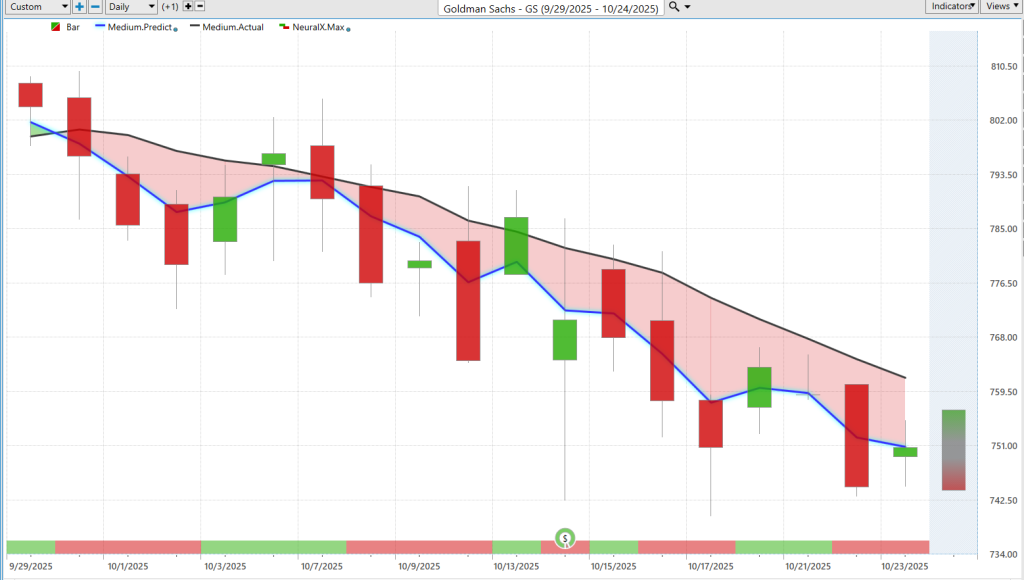
A lot of the banking stocks have been performing poorly. We looked at Regions Bank the other day; J.P. Morgan (JPM) and many of the big banks are also performing poorly.
Here we see with Goldman Sachs (GS), the stock very clearly shows the blue line crossing below the black line—again, one of these instances where the neural index gets bullish within a downtrend.
What do you get? Strength over a couple of trading days, but the overall trend is still very much bearish.
We can take a look at these predicted highs and lows and see how this works—even after this trade—saying, “All right, look for the market to trade up toward the upper part of these predicted ranges, but overall still in a downtrend where you’d want to short and take profits on short positions.”
Within 48 hours, you have that market moving down in the direction of the overall trend.
We’ll see if we get some reversals in some of these financial stocks, but currently not a great place to be positioned. The market’s down about 6%, and a lot of stocks are coming off their highs—representing a reason to be cautious.
Many stocks that performed well are now moving into downtrends—an opportunity to get out of the way, reassess, and find new bullish opportunities as we see these predicted moving averages turn bullish once again.
Warby Parker ($WRBY)
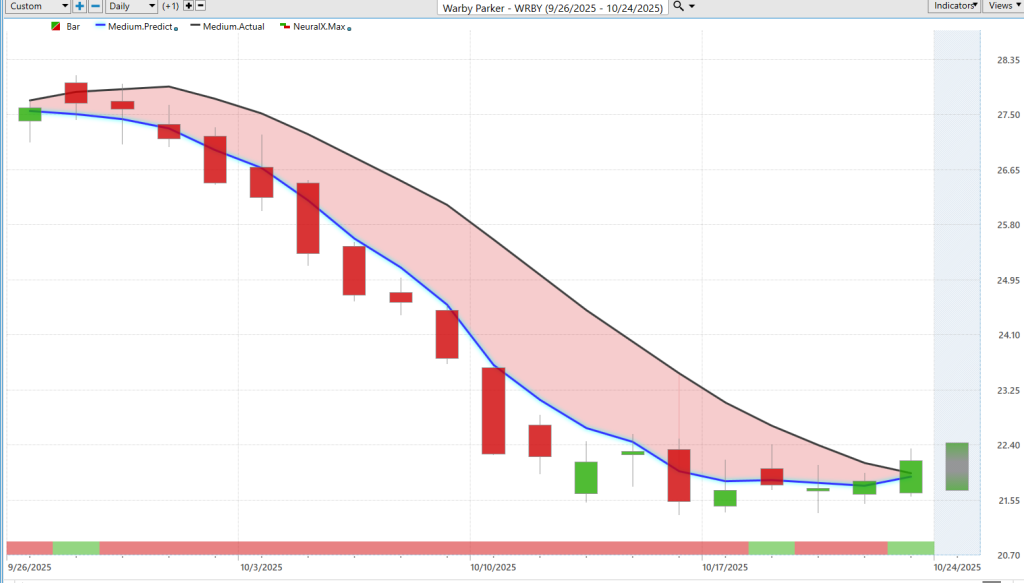
Here’s Warby Parker (WBY)—another example of the blue line crossing below the black line, with a lot of separation between the predicted moving average and the actual.
We see how this market just slips into a downtrend and continues moving lower. Very early on, moving up to the predicted high was immediately followed by selling off. Then you get these days where you scoot up toward that predicted high—but clearly, it’s a place to be a seller, not a buyer or accumulator of shares.
Overall, from this initial predicted high being hit, the market is currently down about 21% just over the past 19 trading days. This is the type of stuff you want to avoid—recognizing that conditions have shifted, predictive forecasts are getting bearish, and making sure you’re not on the wrong side of markets when they decline 20-plus percent over a short period.
Once again, this has been the Hot Stocks Outlook for October 24th, 2025. Thank you all for watching—best of luck and by for now.


